Zebra Battery Technologies for the All Electric Smart Car
←
→
Page content transcription
If your browser does not render page correctly, please read the page content below
SPEEDAM 2006
International Symposium on Power Electronics,
Electrical Drives, Automation and Motion
Zebra Battery Technologies for the All Electric
Smart Car
T. M. O’Sullivan, C. M. Bingham and R. E. Clark
Electrical Machines and Drives Group, Department of Electronic and Electrical Engineering, University of Sheffield,
Sheffield, S1 3JD, (UK)
Abstract-- This paper describes the operational behaviour for most driving cycles do not improve fuel economy or
and advantages of the high temperature, Sodium Nickel reduce emissions significantly over a small, well-
Chloride (Zebra) battery, for use in all electric urban (city) designed IC engine.
vehicles. It is shown that an equivalent parallel electrical
circuit can be employed to accurately simulate the
electrochemical behaviour inherent in the most recent
generation of Zebra cells. The experimental procedure is
outlined and summary attributes of the investigation
validated by both simulation studies, and experimentally,
via measurements from a prototype battery module
intended for use in an all electric smart car.
Index Terms-- Batteries, Electric propulsion, Energy
storage, Equivalent circuits, Modelling.
I. INTRODUCTION1
Due to increases in air pollution in congested cities, as
well as decreases in fuel efficiency for car usage in these
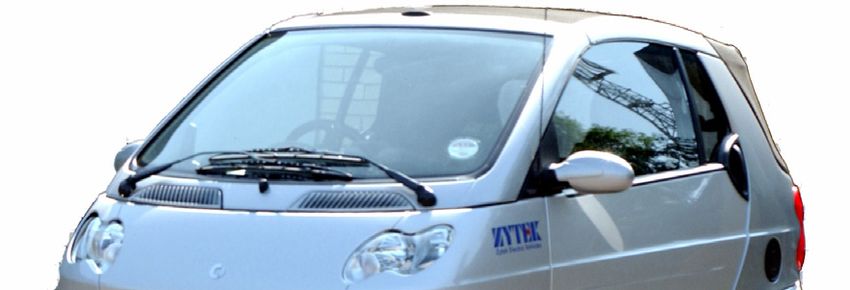
areas (i.e. traffic jams, stop lights, average speed, etc.) the Fig. 1. All-electric smart car
potential of small urban cars with alternative, low carbon
emission energy sources and drive train topologies have
IGBT
been heavily investigated in recent years.
Inverter
The urban vehicle under consideration here is shown
Gear and
in Fig. 1, viz. all-electric (EV) prototype version of the differential
smart car (a brand of Daimler Chrysler). The drive train, 300V
Fig. 2, designed by Zytek Electric Vehicles Ltd., is driven BLDC
Zebra
by a 55kW (75Hp peak) permanent magnet brushless DC module
machine (BLDC) and supplied from an IGBT power
Wheel
inverter via a 26kW (36Hp) Zebra battery module,
providing a DC bus voltage of ≈300V. Fig. 2. Drive-train topology
The progression of the EV and the hybrid electric
vehicles (HEV) from prototype to commercial The Zebra battery module, Fig. 3, has been previously
availability has been limited primarily by the deficiencies utilised successfully in prototype EVs, such as the BMW
in current alternative energy storage technologies. These E1 [1] and Mercedes-Benz 'A'-class as well as
include high cost, limited life span and low energy electric/hybrid public transportation buses in California
density when compared with the internal combustion (IC) and Italy. Additionally, Rolls Royce has selected the
engine and carbon based fuel. Moreover, in recent years, technology to replace lead-acid in military and rescue
with the availability of high-power silicon devices and surface and submersible ship applications. It therefore
advances in electrical machine design, such limitations promises to be a viable competitive energy storage
have become more critical in hindering the successful solution for EV applications, with several added
development of the alternative energy approach, advantages over other battery technologies. For instance,
particularly for the EV. As a result, therefore, a a typical Zebra module [2,3], exhibits a high energy
compromise, i.e. the HEV (two energy sources, one of density of 120Wh/kg 3-4 times higher than lead-acid and
which is often a battery) solution has been the 2-3 times nickel-metal hydride [4]. The pulse power
mainstream. However, such solutions, particularly for the capability is also adequate for typical electric vehicles
urban vehicle market are usually complex, expensive, and acceleration profiles, at around 1.5 the rated energy
(170W/kg). Zebra cells also offer significantly increased
The authors acknowledge the financial support of the UK cycle life ≈3500 nameplate cycles (7-8 times higher than
Department of Trade and Industry (DTI) and contributions of the project lead-acid), maintenance free operation, unaffected by
partners, Zytek Electric Vehicles Ltd., Beta Research and Development
Ltd. and MIRA. ambient temperatures, no gassing, zero self-discharge and
1-4244-0194-1/06/$20.00 ©2006 IEEE
S34 - 6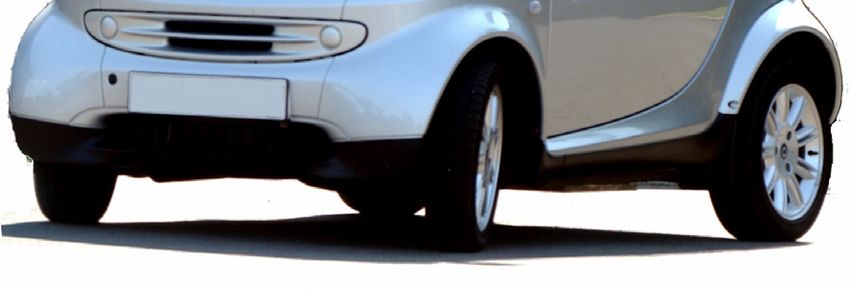
cells fail to a low resistance, so series connected strings                       II. ZEBRA BATTERY EQUIVALENT CIRCUIT
containing failed cells will continue to operate. Of                     The purpose of this section is to explore the main
particular importance to EV applications, state of charge             electrochemical behaviour within the Zebra cell and
estimation is also simple to evaluate since the cell are              formulate an equivalent electrical circuit representation.
100% coulombically efficient i.e. Ah charge in = Ah
discharge out.                                                             (a) Zebra cell          (b) Enlarged internal portion

                                                                          +ve current                            Solid ceramic
                                                                           collector                              electrolyte
                                                                                     -ve
                                                                                                    +ve electrode        -ve electrode
                                                                                     case

                                                                                                        Also contains
                                                                                                      liquid electrolyte

                                                                                                                                        Route of
                                                                                                                                        sodium
                                            Air inlet/outlets                                                                            ions
                                BMI

 Fig. 3. Typical Zebra module
                                                                                                                 NaCl
                                                                                                     NiCl2       +Ni            Na

    Individual Zebra cells operate within a specified                      +ve Current                                                  -ve Cell
temperature range of 270-350°C (as discussed in the next                    collector                          Reaction                   case
                                                                                                                front
section). Series and parallel chains are interconnected and                          Charged                                    Discharged
packaged within a sealed, vacuum insulated, air-cooled                                area   0          Layer radius        1      area
modular casing, Fig. 3, to minimise heat loss to the
environment. The module is regulated by a dedicated
battery management unit (BMI) attached to the front. The                  Fig. 4. Simplified chemical reactions within the Zebra cell during
                                                                          discharging
BMI is fully automated, controlling the charging,
maximum and minimum terminal voltages during
loading, charge status and thermal management by                         Figure 4 illustrates the Zebra cell showing (a) the main
regulating internal heaters and fan cooling. However, in              components of the cell and (b) an enlarged portion. The
general use, once operating temperatures are reached, the             central solid positive (+ve) electrode consists of a nickel
internal temperature of the module is self-regulating,                conductor (current collector) surrounded by a mixture of
exhibiting a natural cooling of around -3°C/hour (if left             nickel chloride (NiCl2), nickel (Ni) and liquid electrolyte
unconnected to an external power supply). Additionally,               (enabling the transfer of Na+ within the +ve electrode).
the module can remain within specified temperature                    The negative (-ve) electrode constitutes the metal cell
limits during a one hour discharge rate without additional            casing and molten sodium (Na). Both electrodes are
forced air cooling. Furthermore, after a sustained drive              separated via a solid ceramic electrolyte which facilitates
cycle, heat can be absorbed during the charging period                the conduction of Na+ ions between the reaction partners,
(i.e. heat can be either evolved or absorbed during                   sodium and nickel chloride. It also has the property of
charging).                                                            simultaneously acting as an insulator for electrons. The
    The relatively simple smart EV drive train, Fig. 2, has           cell requires high temperatures to liquefy the sodium and
therefore become an increasingly viable solution when                 ensure the internal resistance is minimised. The
combined with a Zebra module, being particularly well                 maximum temperature is dictated by the maximum
suited for around 80% of all urban vehicle trips, i.e. short-         allowable level of internal cell pressure.
distance, high-use applications within 50-100 mile                       During discharging, as illustrated by the events in Fig.
ranges. However, due to the complex nature, and recent                4, sodium reacts with nickel chloride to form sodium
development of the Zebra cell, there have been few                    chloride (salt) and nickel. This process is reversed during
equivalent models to predict its performance in                       charging and is given by (1).
applications such as EVs. To date therefore, much EV                                                Discharge
prototyping has been on a trial and error basis with time                  2Na + NiCl2                                     2NaCl + Ni          (1)
consuming experimental evaluation prohibiting an                                                    Charging
optimal solution and slowing progression. Furthermore,
there have been limited publications that clearly                        Variation of internal resistance is mainly attributed to
demonstrate the potential of this relatively new                      the behaviour of the solid +ve electrode (a characteristic
technology.                                                           feature of Zebra cells). During the course of discharging,
                                                                      the reaction front migrates inwards towards the central
                                                                      current collector, as illustrated in Fig. 4. This migration

                                                                S34 - 7
increases the overall internal resistance of the +ve influencing nameplate performance towards the end of
electrode since the reaction front is reduced, and the DOD, when the capacity of the nickel cell has depleted.
propagation distance of the Na+ ions is increased. It can
(a) Simplified components of cell impedance
be seen therefore that the +ve electrode of a fully charged
cell contains only NiCl2, whilst a fully discharged cell
contains only NaCl and Ni. The concept of reaction front
Resistance
is normalised and termed layer radius Sr. When Sr=0 the
reaction front is directly adjacent to the central current +ve electrode
resistance
collector and when Sr=1 adjacent to the sold ceramic
electrolyte.
Solid ceramic electrolyte
During charging, a second charged area (NiCl2 layer)
Metal resistance
is formed immediately adjacent to the solid ceramic
electrolyte, irrespective of the depth of discharge (DOD) 1 Layer radius 0
or the radius of the previous reaction front. Hence, after a (b) Equivalent circuit Sr
short charge, the layer radius is identical to that of a fully
charged cell. It follows therefore, that during a RNit
subsequent discharge, the cell exhibits a low internal Iterm
resistance as it depletes the recently charged outermost RNi
CNit
layer. Once depleted, the reaction front (or layer radius)
UNi
returns to the previous position before the charge was Vterm
initiated. Such an event subsequently causes non-linear ≈2.58V
step terminal voltages during a driving cycle, creating the
accumulation of many layers. As a result, the Zebra cell
cannot be accurately described as a function of charge
state, as with other cell types.
Fig. 5. Electrical circuit representation of a Zebra cell
The above electrochemical processes can be simplified
and represented as an equivalent electrical circuit of a cell
as illustrated in Fig. 5. Vterm and Iterm are the terminal RFe
voltage and current, respectively, and UNi is the open
circuit voltage (OCV) representing the electrochemical ≈2.35V Charging iron cell
potential of sodium and nickel chloride. The passive IFe
electrical components consist of RNi, the lumped ohmic UFe RNit
resistance of the solid ceramic electrolyte and Iterm
interconnecting metal, RNit, the resistance of the +ve RNi
CNit INi
electrode, and CNit, a capacitance which simulates the UNi
diffusion processes within the +ve electrode. However, Vterm
this circuit which is termed the nickel cell cannot ≈2.58V
adequately represent the newest generation of Zebra cells
which also contain iron doping of the positive electrode.
The doping forms a second sodium/iron cell (Na/FeCl2) Fig. 6. Electric circuit representation of an iron doped Zebra cell
that takes part in the reaction directly adjacent to the solid
ceramic electrolyte and constitutes approximately 20% of In general, both the liquid and ceramic electrolyte
the total energy capacity in the most recent cells. exhibit increased ion conductivity with elevated cell
To simulate the parallel supposition of the two temperatures which has the effect of reducing impedance
individual cells, the circuit of Fig. 5 is expanded in Fig. 6 of the +ve electrode. Furthermore the OCV is also
where RFe and UFe, represent the lumped iron cell influenced by temperature variation. The dependences of
resistance and OCV respectively. The iron cell only the individual elements of the equivalent electrical circuit
contributes to Iterm during a high power pulse discharge on additional parameters are assumed as follows [5]:
when the Vterm falls below UFe, thereby enhancing the
• OCV has a dependence on charge state (DOD)
pulse power capability (when compared with an undoped
and temperature only.
cell). Immediately commencing a high power pulse
• CNit, RNit, and RNi are not dependant on DOD but
discharge when Vterm increases above UFe, the iron cell is
show dependency on the current layer radius and
recharged by via the nickel cell. Current flow during this
temperature. Furthermore they exhibit different
event is illustrated by the dotted line in Fig. 6.
values for charging and discharging.
The level of iron doping is carefully prescribed,
• RFe, has shown dependency on current layer
representing a trade-off based on performance and cost.
radius and the DOD of the iron cell (DOD_Fe).
Iron is cheaper than nickel and improves pulse power
Temperature dependence is small and ignored.
capability. However, an increase in iron reduces the
capacity of the higher voltage nickel cell thereby
S34 - 8RNi RNit CNit RFe UNi UNi
DOD Look-up UFe
UFe Vterm BMI table
OCV Vterm
Imposes
Feedback current Iterm limited Terminal
components limits
voltage Iterm
calculation
Iterm
Direction
Pterm
flag
User Demands Look-up RNi
table RNit
Iterm CNit
direction Circuit RFe
Thermal elements
model Current
Temp DOD_Fe
Sr
Sr DOD_Fe
Fig. 7. Schematic of the Zebra battery model structure.
III. ZEBRA BATTERY MODEL
The model is based entirely on a single cell 26
representation, which is scaled to simulate the
Terminal voltage [Volts]
25
interconnection of series and parallel chains. Figure 7
illustrates schematically the model structure which is 24
implemented in a Simulink® modelling environment.
23
The equivalent electric circuit model, Fig. 6, forms the
core and is evaluated for each simulation step as a 22 Enlarged
conventional linear (time invariant) circuit. However, for pulse
21
each step, the equivalent circuit parameters are modified
based on the assumptions outlined in the previous section 20
in accordance with variations in Sr, DOD, terminal
19
current direction and battery temperature, obtained via an 0 1 2 3 4 5 6
auxiliary thermal model. Of particular importance, the Time [sec] ×10
4
4
x 10
prior history, location and capacity (in Ah) of previously
charged layers are stored. Outermost, charged layers are Fig. 8. Terminal voltage progression during a pulse discharge
depleted first by initiating step changes in the current sequence
layer radius. The BMI is modelled based on the actual
unit, enforcing voltage/current limits and monitoring state From the data in Fig. 8 the OCV as a function of DOD
of charge etc. Model accuracy is determined by the can be obtained as well as equivalent circuit parameters
estimated equivalent circuit parameters with respect to a for the nickel cell as a function of layer radius. Notably,
given operating condition. Parameters are identified via similar experiments were repeated at different
terminal voltage data at discrete points and the model temperatures employing both charging and discharging
performs interpolation between adjacent values. load sequences. One of the voltage transients during a
Experiments where preformed on a 10 cell series chain 12.5A pulse in Fig. 8 (marked) is enlarged and shown in
module, containing the most recent ML/8P 25Ah cells, Fig. 9 alongside the method for calculating the nickel cell
(intended for use in future EV smart cars). The module resistances. The capacitance is determined from the time
has a nominal OCV of 25.8V. Figure 8 shows terminal constant τ, by curve matching the transient part of the
voltage progression when the module is subjected to a pulse.
repeating pulse discharge sequence of 60min at 2.5A, In order to ensure the iron cell is not contributing to
30sec at 12.5A followed by 30min open circuit. Notably the terminal current (resulting in error of the estimated
these results where performed at a fixed temperature nickel cell resistances) the terminal voltage must be kept
(295°C) and the module was previously fully charged above ≈23.5V. Unfortunately voltages below 23.5V are
(i.e. contains no previous charged layers) and completely an inevitable occurrence at high DOD, since the nickel
discharged within the loading sequence. cell capacity is depleted, and the terminal current consists
only of the iron cell contribution. This is characterised in
S34 - 9Fig. 8, by a sudden fall in OCV to ≈ 23.5V (during the 30 10 (marked) is enlarged in Fig. 11, alongside a method
min open circuit periods). for calculating the iron cell resistance during charging
26
and discharging events. It should be noted that based on
this method, the accuracy of the estimate iron cell
Terminal voltage [Volts]
resistance is entirely based on the accuracy of the
25.5
previously estimated nickel resistances.
Figure 12 shows the estimated resistive circuit
25
INIRNI parameters as a function of layer radius during
INI(RNI+RNIR) discharging at 295°C. It can be seen that the nickel cell
24.5
resistances appear to sharply fall, whilst the iron cell
resistance rises when Sr1500
in all electric urban vehicles. It is shown that an
equivalent parallel electrical circuit can be employed to
accurately simulate the electrochemical behaviour
Load power [Watts]
1000 inherent in the most recent generation of Zebra cells. The
experimental procedure is outlined and summary
attributes of the investigation validated by both
500
simulation studies, and experimentally, via measurements
from a prototype battery module intended for use in a all
0 electric smart car and benchmark NEDC urban driving
cycle. It is demonstrated that the transient behaviour
during charging and discharging can be predicted with
-500
0 200 400 600 800 1000
sufficient accuracy to optimise the smart car drive train
without time consuming experimental trials.
Time [sec]
Fig. 14. Estimated and scaled smart car power requirements during a V. REFERENCES
NEDC driving cycle
[1] N. Amamm, J. Bocker and F. Prenner, “Active damping of drive
In order to evaluate the performance of the Zebra train oscillations for an electrically driven vehicle,” IEEE/ASME
battery model an ECE+EDDC (NEDC) driving cycle is Trans. on Mechatronics, Vol. 9, No. 4, pp. 697-700 (2004).
employed as a benchmark. Using data from the smart car [2] C-H. Dustmann “Advances in ZEBRA batteries,” Journal of
drive train, a demand power profile was estimated over Power Sources, Vol. 127, pp 85-92, (2004).
[3] J.L. Sudworth “The sodium/nickel choride (ZEBRA) battery,”
one NEDC cycle and scaled, Fig 14, to suit the 10 cell Journal of Power Sources, Vol. 100, pp 149-163, (2001).
experimental Zebra module. Figures 15 and 16 show both [4] P. Lailler, J-F Sarrau, C. Sarrazin “Comparative study for “36v”
the simulated and experimental results for the terminal vehicle applications: Advantages of lead-acid batteries,” Journal
voltage and terminal current progression throughout the of Power Sources, Vol. 95 pp. 58-67, (2001).
[5] M. Wansner, “Energy production industry and power station
cycle. engineering”, Institute for Power Engineering, Munich Technical
University, Thesis, (1996).
IV. CONCLUSIONS
This paper describes the operational behaviour and
advantages of the high temperature, Zebra battery, for use
28
Terminal voltage [Volts]
26
24
22
Simulated
20 Experimental
18
0 100 200 300 400 500 600 700 800 900
Time [sec]
Fig. 15. Simulated and experimental terminal voltage of a 10 cell Zebra module during a NEDC driving cycle
60
Terminal current [Amps]
Simulated
40 Experimental
20
0
0 100 200 300 400 500 600 700 800 900
Time [sec]
Fig. 16. Simulated and experimental terminal current of a 10 cell Zebra module during a NEDC driving cycle
S34 - 11You can also read