Single-Channel EEG Based Arousal Level Estimation Using Multitaper Spectrum Estimation at Low-Power Wearable Devices
←
→
Page content transcription
If your browser does not render page correctly, please read the page content below
Single-Channel EEG Based Arousal Level Estimation Using
                                              Multitaper Spectrum Estimation at Low-Power Wearable Devices
                                            Berken Utku Demirel1 , Ivan Skelin2 , Haoxin Zhang2,4 , Jack J. Lin2,3,4 , and Mohammad Abdullah Al Faruque1
                                                      1 Department of Electrical Engineering and Computer Science, 2 Department of Neurology
                                                         3 Department of Anatomy and Neurobiology, 4 Department of Biomedical Engineering

                                                                           University of California, Irvine, California, USA
                                                                         (bdemirel, iskelin, haoxinz1, linjj, alfaruqu)@uci.edu

                                              Abstract—This paper proposes a novel lightweight method           sleep stages. The CNN layers are used for representation
arXiv:2108.00216v1 [eess.SP] 31 Jul 2021

                                           using the multitaper power spectrum to estimate arousal levels       learning to extract time-invariant features, and the Bi-LSTM
                                           at wearable devices. We show that the spectral slope (1/f) of the    part is residual sequence learning to encode the temporal
                                           electrophysiological power spectrum reflects the scale-free neural
                                           activity. To evaluate the proposed feature’s performance, we used    information of EEG signals. This network’s major drawback
                                           scalp EEG recorded during anesthesia and sleep with technician-      is that it requires 25 epochs, where each epoch is a 30-second
                                           scored Hypnogram annotations. It is shown that the proposed          EEG, of data to be fed together to obtain 25 labels, which
                                           methodology discriminates wakefulness from reduced arousal           cannot be implemented in wearable devices due to memory
                                           solely based on the neurophysiological brain state with more         constraints. Authors in [6] proposed a CNN architecture to
                                           than 80% accuracy. Therefore, our findings describe a common
                                           electrophysiological marker that tracks reduced arousal states,      classify sleep EEG to 5 different stages. The architecture
                                           which can be applied to different applications (e.g., emotion        needs to perform billions of multiply-accumulate operations
                                           detection, driver drowsiness). Evaluation on hardware shows          (MACs) for classification, which is quite a time and energy
                                           that the proposed methodology can be implemented for devices         consuming process. Several solutions have been proposed to
                                           with a minimum RAM of 512 KB with 55 mJ average energy               make neural networks resource-efficient in terms of memory
                                           consumption.
                                                                                                                and energy, such as pruning or quantizing [7], [8], however, the
                                             Index Terms—Multitaper spectral density estimation, EEG,           networks’ classification performance is decreased, especially
                                           Arousal level, low-power wearable devices.
                                                                                                                when weight quantization is used as the precision of floating-
                                                                                                                operations are decreased. Moreover, these deep network ar-
                                                      I. I NTRODUCTION AND R ELATED W ORK                       chitectures are designed for specific applications rather than
                                               The assessment of the arousal level, which is defined as         general purposes since they do not investigate the underlying
                                           the level of consciousness [1], can be used for many different       common electrophysiological markers. However, in this paper,
                                           purposes at several applications, such as emotion recognition        we propose a lightweight method in terms of energy and
                                           [2], sleep stage classification, or driver drowsiness. Therefore,    memory to discriminate wakefulness from reduced arousals by
                                           it is important to define a common electrophysiological marker       examining the electrophysiological power spectrum of single-
                                           that tracks reduced arousal states, which can be employed for        channel EEG.
                                           different applications. State-of-the-art works extract several
                                                                                                                  The main contributions of this paper are as follows:
                                           features from the EEG signal for various classification pur-
                                           poses instead of finding a feature representing the underlying         1) A novel lightweight implementation of Multitaper power
                                           mechanism of neurological activity. For example, authors in               spectral estimation method to estimate arousal level
                                           [3] extract 181 distinct frequency-domain features for clas-              in low-power wearable devices using a single channel
                                           sifying a person’s arousal while watching emotional content               EEG.
                                           videos. In [4], authors extract 104 features from different fre-       2) Validation of our methodology on the anesthesia and
                                           quency bands of electroencephalogram (EEG) to classify sleep              sleep EEG data with technician-scored hypnogram an-
                                           stages. Also, these algorithms used more than one EEG chan-               notations.
                                           nel to extract features. However, as the number of extracted           3) Energy and memory efficiency validation of our pro-
                                           features and channels increases, the algorithms’ computational            posed methodology on real hardware.
                                           complexity and memory requirement increase, making them
                                           unsuitable for wearable devices with constrained memory and                        II. M ATERIALS AND M ETHODS
                                           energy resources. Deep learning algorithms like Convolutional
                                           Neural Networks (CNN) are widely used [5], [6] to avoid              A. Data Collection
                                           the feature extraction step since they automatically extract            The scalp EEG was recorded during overnight sleep or
                                           features through convolution layers. However, their memory           intra-operative anesthesia at the University of California at
                                           requirements are huge due to the number of parameters in             Irvine Medical Center. All patients provided informed consent
                                           the designed architecture. For example, authors in [5], use a        according to the local ethics committees of the University of
                                           Convolutional Neural Network (CNN) followed by Bidirec-              California at Berkeley and at Irvine and gave their written
                                           tional Long Short Term Memory cells (Bi-LSTM) to classify            consent before data collection. We analyzed recordings from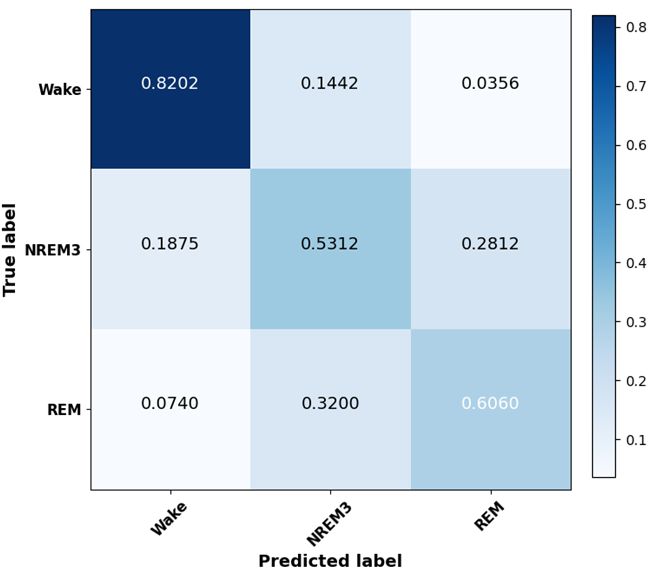
8 participants between 24 and 57 years old. The Polysomnog- 1, subject to the constraint that the sequence has finite power
raphy was recorded for the sleep stages during 8 hours (Equation 2).
and 5 min quiescent rest with eyes closed before and after Where Fs is the sampling rate of the sequence x[n] and
sleep. Data were recorded on a Grass Technologies Comet W < Fs /2. This ratio determines an index-limited sequence
XL system (Astro-Med, Inc, West Warwick, RI) with a 19- with the largest proportion of its energy in the band [–W, W ].
channel EEG using the standard 10–20 setup as well as three This maximization leads to the eigenvalue problem is given in
electromyography (EMG) and four electro-oculography (EOG) Equation 3.
electrodes are used to facilitate gold standard sleep staging.
The EEG was referenced to the bilateral linked mastoids and N −1
digitized at 1000 Hz. Sleep staging was carried out by trained X sin(2πW (n − m))
gk (m) = λk (N, W )gk (n) (3)
personnel and according to established guidelines. m=0
π(n − m)
The anesthesia data were recorded from the induction of
anesthesia to the recovery using a Nihon Kohden recording Where λk is the eigenvalues, and gk (n) is the DPSS values
system (256 channel amplifier), analog filtered above 0.01 that correspond to kth Slepian sequence. The eigenvectors of
Hz, and digitally sampled at 5 kHz. General anesthesia was this equation, gk (n), are the DPSS values, which are mutually
induced intravenous with remifentanil (100 µg) and propofol orthogonal to each other. We have used 29 tapers for 30-second
(150 mg). The awake state was defined as the time before the segments of sleep EEG and 9 tapers for 10-second anesthesia
administration of propofol, and anesthesia was defined as the segments, so the first 29 and 9 DPSS are used for multitaper
time after inducing remifentanil and propofol. PSD estimation. After obtaining DPSS values, the modified
periodograms are calculated in Equation 4 using a different
B. Methods Slepian sequence for each window.
1) Pre-Processing: Both sleep and anesthesia data are
N −1 2
resampled to 200 Hz from 1000 and 5000 Hz for sleep and X
anesthesia respectively, using a FIR antialiasing lowpass filter. Sk (f ) = ∆t gk (n)x(n)e−j2πf n∆t (4)
n=0
Then, a 10 order low-pass Butterworth filter is used with 50
Hz cut-off frequency for denoising. After filtering, sleep data Here Sk (f ) is the modified periodograms, each obtained
is epoched into 30-second segments. In contrast, the anesthesia using a different Slepian sequence (gk (n)). Finally, the mul-
is segmented as 10-second to increase the number of epochs as titaper PSD estimate is calculated, by averaging the modified
anesthesia’s duration (1-3 hours or less) is shorter than sleep periodograms using Equation 5.
(6-10 hours). It is observed that the feature’s discrimination
performance is best amongst the electrodes Fz, Pz, and Cz. K−1
1 X
For this study, we choose the Cz electrode for calculation of S(f ) = Sk (f ) (5)
K
spectral slope and classification. k=0
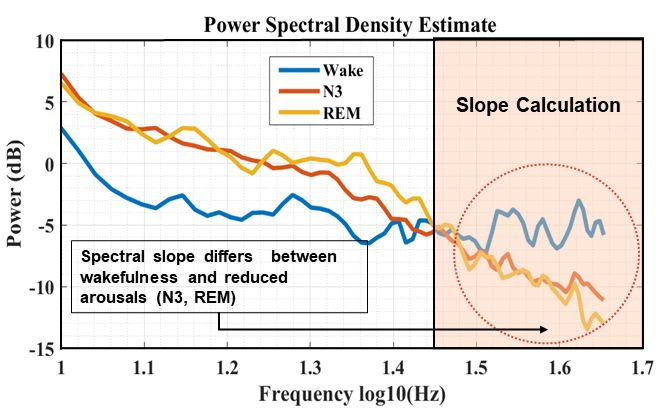
After obtaining the power spectral density estimation, we
C. Feature Extraction calculated the spectral slope by fitting a linear regression line
to the PSD in log-log space between 30 and 45 Hz. This
After artifact removal and segmentation, the Multitaper
range was proved to correlate best with arousal changes in
approach based on discrete prolate Slepian sequences is used
rodents and monkeys [9]. The best line is obtained using the
to compute the power spectral density (PSD) estimate from 0.5
polynomial curve fitting method to the 30-45 Hz range of
Hz to 45 Hz with 0.5 Hz smoothing. The multitaper method
multitapered power spectral density estimation. Figure 1 shows
gives better results than the periodogram for PSD estimation
the PSD estimation of three different EEG epochs obtained
of EEG signals since it reduces the temporal variability and
using curve fitting.
produces a consistent PSD. The multitaper method averages
modified periodograms obtained using mutually orthogonal
tapers (windows). Moreover, the obtained tapers are optimal
in time-frequency concentration as those tapers are calculated
using discrete prolate Slepian sequences.
RW 2 Fs /2
X(f ) df Z
−W 2
λ= (1) X(f ) df < ∞ (2)
Fs /2
R 2
X(f ) df −Fs /2
−Fs /2
The discrete prolate Slepian sequences (DPSS) arise from
the following spectral concentration problem. The discrete
Fourier transform (DTFT) (X(f )) of a finite time series x[n], Fig. 1: The power spectral density of three different EEG
for which a sequence maximizes the ratio given in Equation epochsAs shown in this figure, the spectral slope of the wake- 3 shows the spectral slopes obtained during wakefulness and
fulness and reduced arousals is different. The slope for the anesthesia. We observed that the spectral slope was higher
reduced arousals tends to be more negative than the wake during wakefulness (-1.9 median value with 0.5 standard
stage. To observe these spectral slope differences better be- deviations) than during anesthesia (-2.77 median value with
tween sleep stages, the whiskey plot is shown in Figure 2. 0.8 standard deviations).
These results provide evidence that the spectral slope dis-
criminates wakefulness from reduced arousals. Moreover, it
is observed that the more negative slopes of the wake stage
are closer to state transitions, which can be explained as the
subjects are still drowsy.
III. R ESULTS AND D ISCUSSION
A. Performance Evaluation
To evaluate the proposed methodology’s performance, we
used sleep recording, specified in Section II-A, which has
an associated hypnogram file scored by a specialist. The
hypnogram files contain labels identifying the sleep stages.
The two different NREM stages (3 and 4) are combined into
one group as NREM3 since these two stages are considered
as deep sleep, whereas NREM1 and NREM2 are considered
as light sleep [10]. Thus, the classification is performed for
Fig. 2: The whisker plot for slope distribution of three three different sleep stages (Wake, NREM3, and REM).
different stage Since we extracted spectral slope from one channel of the
EEG signal, simple threshold values are used for discriminat-
Figure 2 shows the spectral slopes’ distribution for three ing sleep stages from each other instead of using machine
different sleep stages (Wake, NREM3, and REM). We ob- learning algorithms. For this study, the threshold value is
served the wake stage slope between -0.1 and -3 with a -2.08 chosen as -2.45 for separating wakefulness from different sleep
median value and 0.6 standard deviations. On the other hand, stages. If the calculated spectral slope of an EEG epoch is
the median of spectral slopes for the REM stage is -3.45 with greater than -2.45, this epoch is classified as Wake. If the slope
0.5 standard deviations. is less than -3.2, the period is classified as REM. Lastly, if the
calculated spectral slope is between these two threshold values,
the epoch is classified as the NREM3 stage.
Fig. 3: The whisker plot for slope distribution of wake and
anesthesia
We have applied the same method to EEG data recorded
under propofol anesthesia to show that the spectral slope Fig. 4: The normalized confusion matrix
between 30-45 Hz can track the reduced arousal levels. In
these recordings, the wake stage is defined as the time before Figure 4 shows the confusion matrix for three different
the start of propofol and remifentanil, and anesthesia was sleep stages. As can be seen from the figure, the confusion
defined as the periods when the patients were unresponsive to of Wake stage with NREM3 and REM stages are lower than
verbal commands assessed by the attending anesthetist. Figure 15%, which indicates that the spectral slope feature candiscriminate the wakefulness with reduced arousal brain states. be decreased, which would reduce PSD resolution and result
Since both NREM3 and REM stages are considered as low in a high-variance spectrum.
arousal level, the algorithm’s discrimination performance for IV. C ONCLUSIONS
these two stages is not as high compared to Wake classifi-
cation. However, the confusion degree for reduced arousal This paper proposes a lightweight feature extracted using
with wakefulness is as low as 7% (Wake-REM). As seen Multitaper power spectra that can be implemented in low-
in these results, the spectral slope calculated from the power power wearable devices to discriminate the reduced arousal
spectral density can estimate the human’s arousal level based states from wakefulness based on single-channel EEG signals.
on neurophysiological brain state. Also, it is known that if We used EEG signals recorded in two different ways during
the PSD estimates are obtained from different electrodes with sleep and anesthesia to validate the performance of the feature.
high sampling frequency and averaged across all electrodes, It is shown that the feature is an electrophysiological marker
the discrimination performance of the spectral slope increases that tracks reduced arousal states in EEG signals. Therefore,
for arousal level estimation [11] or different methods and it can be applied for various applications in which monitoring
techniques can be applied to multitaper power spectra to obtain the arousal level is important such as emotion recognition,
a more accurate and fine estimation of frequency variations. epileptic seizures, coma, the vegetative or minimally conscious
However, the algorithm’s memory requirement and energy state. The implementation of the proposed methodology on
consumption increase with the sampling rate and number of hardware shows that it is energy and memory-efficient with
channels used, making it unsuitable for wearable devices. 55 mJ average energy consumption, making it suitable for
Also, most of the wearable system try to use as few channels wearable devices with a minumum RAM of 512 KB.
as possible to increase the comfortability and acceptability
amongst society [12]. R EFERENCES
[1] M. Boly, A. Seth, M. Wilke, P. Ingmundson, B. Baars, S. Laureys,
B. Memory and Energy Consumption Evaluation D. Edelman, and N. Tsuchiya, “Consciousness in humans and non-
We evaluate our proposed methodology’s memory foot- human animals: recent advances and future directions,” Frontiers in
Psychology, vol. 4, p. 625, 2013.
print and energy consumption using an STM32 Nucleo-144 [2] J. Kortelainen and T. Seppänen, “Eeg-based recognition of video-
(STM32H743Z), 32-bit ARM Cortex-M7 core with 480 MHz induced emotions: Selecting subject-independent feature set,” in 2013
maximum operating frequency, and 1 MB RAM. The energy 35th Annual International Conference of the IEEE Engineering in
Medicine and Biology Society (EMBC), 2013, pp. 4287–4290.
profiling is performed using STM32 Power Shield (LPM01A), [3] ——, “Eeg-based recognition of video-induced emotions: Selecting
an accurate power monitoring device with a power con- subject-independent feature set,” in 2013 35th Annual International
sumption measurement range between 180 nW and 165 mW. Conference of the IEEE Engineering in Medicine and Biology Society
(EMBC), 2013, pp. 4287–4290.
Table I shows the execution time, energy consumption, and [4] P. Memar and F. Faradji, “A novel multi-class eeg-based sleep stage
required memory for each operation. The energy and memory classification system,” IEEE Transactions on Neural Systems and Reha-
calculation is performed using a 30-second epoch of EEG bilitation Engineering, vol. 26, no. 1, pp. 84–95, 2018.
[5] A. Supratak, H. Dong, C. Wu, and Y. Guo, “Deepsleepnet: A model for
signal, sampled at 200 Hz. automatic sleep stage scoring based on raw single-channel eeg,” IEEE
Transactions on Neural Systems and Rehabilitation Engineering, vol. 25,
TABLE I: Memory and Energy Consumption on Nucleo no. 11, p. 1998–2008, Nov 2017.
Board [6] O. Tsinalis, P. Matthews, Y. Guo, and S. Zafeiriou, “Automatic sleep
stage scoring with single-channel eeg using convolutional neural net-
Exe. Energy Flash Memory RAM works,” ArXiv, vol. abs/1610.01683, 2016.
Operations
Time (ms) mJ Footprint (KB) Footprint (KB) [7] N. Rashid and M. A. Al Faruque, “Energy-efficient real-time myocardial
Filtering 180 10 26.4 96.87 infarction detection on wearable devices,” in 2020 42nd Annual Interna-
Multitaper PSD tional Conference of the IEEE Engineering in Medicine Biology Society
101 45 45 350
Estimation (EMBC), 2020, pp. 4648–4651.
[8] H. Li, A. Kadav, I. Durdanovic, H. Samet, and H. Graf, “Pruning filters
for efficient convnets,” ArXiv, vol. abs/1608.08710, 2017.
The overall execution time for a 30-second epoch takes 281 [9] R. Gao, E. J. Peterson, and B. Voytek, “Inferring synaptic excita-
ms in the device with 55 mJ average energy consumption. The tion/inhibition balance from field potentials,” NeuroImage, vol. 158, pp.
proposed methodology is also compatible with any devices 70 – 78, 2017.
[10] L. Genzel, M. C. Kroes, M. Dresler, and F. P. Battaglia, “Light sleep
with a minimum RAM of 512 KB. When multitaper PSD versus slow wave sleep in memory consolidation: a question of global
estimation is calculated, the discrete Prolepian sequences are versus local processes?” Trends in Neurosciences, vol. 37, no. 1, pp. 10
represented as sparse matrices to save memory. Since the first – 19, 2014.
[11] J. D. Lendner, R. F. Helfrich, B. A. Mander, L. Romundstad, J. J. Lin,
sequences contain a few non-zero elements, storing them as M. P. Walker, P. G. Larsson, and R. T. Knight, “An electrophysiological
sparse matrices are more efficient. The number of discrete marker of arousal level in humans,” eLife, vol. 9, p. e55092, jul 2020.
Slepian sequences (29 tapers in this study) used for PSD [12] S. Elmalaki, B. U. Demirel, M. Taherisadr, S. Stern-Nezer, J. J. Lin, and
M. A. A. Faruque, “Towards internet-of-things for wearable neurotech-
calculation can be decreased using fewer tapers to save more nology,” in 2021 22nd International Symposium on Quality Electronic
memory. However, the value for frequency smoothing needs to Design (ISQED), 2021, pp. 559–565.You can also read