MICROSTRUCTURE AND FATIGUE PROPERTIES OF CU-NI-SI ALLOY STRENGTHENED BY NI2SI INTERMETALLIC COMPOUNDS
←
→
Page content transcription
If your browser does not render page correctly, please read the page content below
Computational Methods and Experimental Measurements XX 75

 MICROSTRUCTURE AND FATIGUE PROPERTIES
 OF CU–NI–SI ALLOY STRENGTHENED BY NI2SI
 INTERMETALLIC COMPOUNDS
 MASAHIRO GOTO1, TAKAHITO UTSUNOMIYA1, TAKAEI YAMAMOTO1, SEUNG ZEON HAN2,
 JUNICHI KITAMURA1, JEE-HYUK AHN2, SUNG HWAN LIM3 & TERUTOSHI YAKUSHIJI4
 1
 Department of Mechanical Engineering, Oita University, Japan
 2
 Korea Institute of Materials Science, Changwon, Republic of Korea
 3
 Department of Advanced Materials Science and Engineering, Kangwon National University, Republic of Korea
 4
 National Institute of Technology, Oita College, Japan

 ABSTRACT
Microstructure and fatigue properties of Cu–6Ni–1.5Si alloy having different morphologies of Ni2Si
intermetallic compounds that are disk-shaped continuous precipitates (CPs) with nano-size diameter by
normal aging, fibre-shaped discontinuous precipitates (DPs) by overaging and elongated DPs fabricated
by cold-rolling (DPR) were studied. There was a negligible difference in fatigue strength between the
CP and DP specimens despite higher tensile strength of the CP specimen. The DPR specimen had the
highest tensile and fatigue strengths in all specimens. The fatigue crack initiation resistance of the DPR
specimen was drastically enhanced. The growth rate of a small crack can be determined by a term σanl.
The crack growth resistance of the DPR specimen was nearly equal to that of the CP specimen. The
reason for such trends of tensile and fatigue strengths was discussed based on the microstructure of
each specimen.
Keywords: fatigue, copper alloy, crack initiation, microstructure, cold-rolling.

 1 INTRODUCTION
Cu–Ni–Si alloys [1] used for lead frame, connector applications are commercially
manufactured through normal aging after solution heat treatment (SHT). Normal aging of
Cu–6Ni–1.5Si alloy produced continuous precipitates (CPs) of nano-sized, δ-Ni2Si
intermetallic compounds which brought a high tensile strength throughout the matrix [1]–
[4]. It is well known that an enhancement in the tensile strength of normal aged Cu alloys is
inevitably accompanied by a reduction in electrical conductivity. On the other hand,
overaging of Cu–Ni–Si alloys, particularly with high solute concentrations, produced
discontinuous precipitates (DPs) that were fibre-shaped, stable δ-Ni2Si intermetallic
compounds in the Cu matrix. Mechanical properties of Cu–Ni–Si alloys are degraded by the
formation of DPs [5]–[9], however DPs have a superior electrical conductivity. It has been
shown that the DP specimen subjected to cold working had elongated nanofiber-shaped
δ-Ni2Si precipitates and the tensile strength was enhanced without a significant loss of
electrical conductivity [8].
 For the envisaged structural applications, fatigue strength should be clarified, because
that at least 90% of mechanical failures during service were caused by the fatigue failure. To
make the design and maintenance of safe machine components and structures, the fatigue
behaviour such as crack initiation and propagation should be clarified. Up to now, there was
a small number of studies [10]–[16] on fatigue behaviour of Cu–Ni–Si alloys, particularly in
DPs. In the present study, fatigue tests of Cu–6Ni–1.5Si alloy with different morphologies of
Ni2Si precipitates were carried out at the room temperature. The objective of this study is to
investigate the microstructure and fatigue crack growth behaviour of Cu–Ni–Si alloy with
different morphologies of Ni2Si precipitates.

 WIT Transactions on Engineering Sciences, Vol 130, © 2021 WIT Press
 www.witpress.com, ISSN 1743-3533 (on-line)
 doi:10.2495/CMEM210071
76 Computational Methods and Experimental Measurements XX

 For the envisaged structural applications, fatigue strength should be clarified, because
that at least 90% of mechanical failures during service were caused by the fatigue failure. To
make the design and maintenance of safe machine components and structures, the fatigue
behaviour such as crack initiation and propagation should be clarified. Up to now, there was
a small number of studies [10]–[16] on fatigue behaviour of Cu–Ni–Si alloys, particularly in
DPs. In the present study, fatigue tests of Cu–6Ni–1.5Si alloy with different morphologies of
Ni2Si precipitates were carried out at the room temperature. The objective of this study is to
investigate the microstructure and fatigue crack growth behaviour of Cu–Ni–Si alloy with
different morphologies of Ni2Si precipitates.

 2 EXPERIMENTAL PROCEDURES
Using 99.9% pure Ni, and 99.99% pure Si as alloying elements, Cu–6wt%Ni–1.5wt%Si alloy
was cast by induction melting. The cast was cold-rolled with 80% reduction in area, and
subsequently solution heat-treated at 980°C for 1 h with water quenching. The solution heat-
treated bars were aged at 500°C. The aging time was 0.5 and 3 h for CP and DP structure,
respectively. In what follows, the specimen aged for 0.5 and 3 h is designated by the CP and
DP specimen, respectively. Some of the cast were hot-rolled down to 75% reduction in area,
and solution heat-treated at 980°C for 1 h. The solution heat-treated specimen was aged at
500°C for 3 h to obtain fully DP structure, then cold-rolled down to 80% reduction in area,
which is designated as “DPR specimen”.
 The microstructure was observed using an optical microscope (OM) and a scanning
electron microscope (SEM). A 200 kV field-emission transmission electron microscope
(TEM) was utilized to characterize precipitates. Disks 3 mm in diameter and 100-µm-thick
were prepared for the TEM observation by mechanical polishing with a digitally enhanced
precision specimen grinder and dimpling by a dimple grinder. The microhardness (Hv) was
measured using a Vickers hardness tester with an applied load of 1 N. Tensile tests (4 mm
diameter specimens) were performed on a tensile testing machine (4206, Instron) with a strain
rate of 0.017 s−1 at room temperature.
 Fatigue specimens were round-bar with 5 mm diameter (Fig. 1) which machined from the
CP, DP and DPR samples. To eliminate any surface damage induced during specimen
preparation, the layer of approximately 25 µm of the specimen’s surface was removed by
electrolytic polishing prior to fatigue testing. All fatigue tests were conducted at room
temperature using a rotating bending fatigue machine (constant bending-moment type, the
stress ratio: R = –1) operating at 50 Hz. The observation of fatigue damage on the specimen
surface and on the fracture surface was conducted using OM and SEM. The crack length, l,
was measured along the circumferential direction of the surface using a plastic replication
technique. The stress value referred to is that of the nominal stress amplitude, σa, at the
minimum cross-section (5 mm diameter).

 Figure 1: Schematic illustration of the fatigue specimen (in mm).

 WIT Transactions on Engineering Sciences, Vol 130, © 2021 WIT Press
 www.witpress.com, ISSN 1743-3533 (on-line)
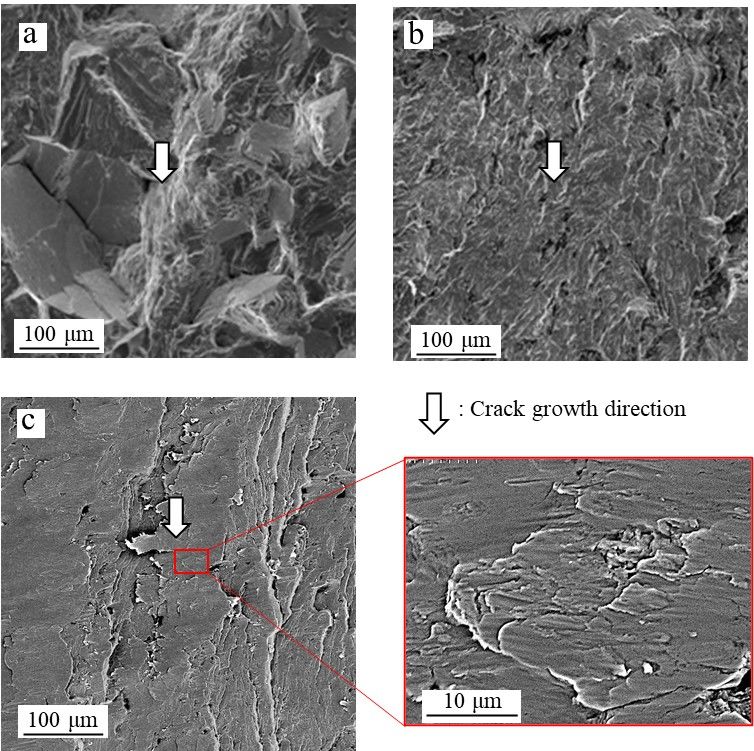
Computational Methods and Experimental Measurements XX 77

 The electrical resistivity of a 300 mm length specimen was measured by a portable double
bridge apparatus (2769, Yokogawa M&C) at room temperature (27 ± 1°C). It was then
converted to electrical conductivity by taking inverse of the resistance. The electrical
conductivity was represented by the value of International Annealed Copper Standard
(%IACS) which was calculated by the ratio of electrical conductivity between sample and
annealed pure Cu.

 3 EXPERIMENTAL RESULTS AND DISCUSSION
Fig. 2 shows OM micrograph of microstructure, Vickers hardness and electrical conductivity
as a function of aging time. The hardness shapely increased with an increasing aging time.
At 0.5 h aging, it reached near maximum value (Hv = 259), followed by a gradual decreasing
trend. The 0.5 h aged microstructure consisted of bright gains and sporadically distributed
dark/tarnished phases. The dark phases were DPs. After 3 h aging, the matrix was
transformed to fully DP phases (DP fraction was over 95%) and hardness dropped to 196.
The electrical conductivity (%IACS) gradually increased with an increase in aging time. The
conductivity for 0.5 h aging was 25%IACS. After 3 h aging, it was drastically enhanced to
44%IACS. Even though the formation of DPs was detrimental to the mechanical properties
of Cu–Ni–Si alloys, the electrical conductivity of DPs was superior to that of the CP
counterpart. The increased conductivity of DPs was caused by the further reduction of Ni and
Si solute elements in the Cu matrix.

3.1 Microstructure of the CP specimen

Fig. 3 shows the microstructure of the CP specimen. There were bright grains, dark/tarnished
phases which sporadically distributed along grain boundaries (GBs) and inclusions with a

Figure 2: OM micrograph of microstructure, Vickers hardness and electrical conductivity
 as a function of aging time.

 WIT Transactions on Engineering Sciences, Vol 130, © 2021 WIT Press
 www.witpress.com, ISSN 1743-3533 (on-line)
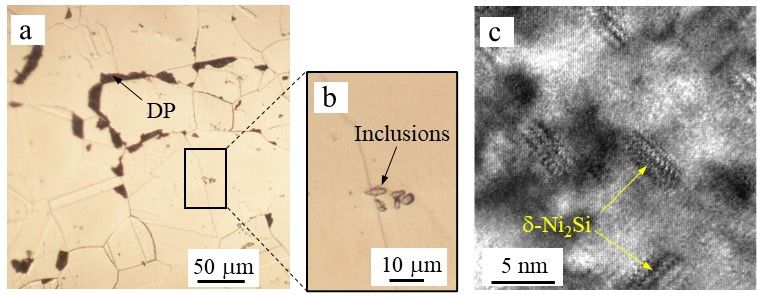
78 Computational Methods and Experimental Measurements XX

Figure 3: Microstructure of the CP specimen. (a), (b) OM micrograph; and (c) high-
 resolution TEM image of the matrix.

few micrometres in size (Fig. 3(a) and (b)). Fig. 3(c) shows high resolution TEM images of
the matrix (bright grains in Fig. 3(a)). Disc-shaped precipitates with a few nanometres in
diameter were observed. These precipitates were characterized as δ-Ni2Si intermetallic
compounds by an optical diffractogram. As will be discussed in subsequent section, the dark
phases in Fig. 3(a) were DPs with the fibre-shaped Ni2Si precipitates which have also been
called “cellular precipitates”.
 Fig. 4(a) shows TEM images on the microstructure around GB areas in the CP specimen.
A band-like bright zone and a particle with a few tens of nanometres were observed along
the GBs (refer to magnified views: Fig. 4(b) and (d)). Fig. 4(c) and (e) indicated that the
bright zone and particle was the precipitate-free zone (PFZ) and NiSi intrametric compounds
(heterogeneous precipitates), respectively. Along with NiSi, Ni2Si intermetallics with a few
tens of nanometres in size was also observed at GB areas [14]. The generation and subsequent
growth of the heterogeneous precipitates (NiSi, Ni2Si) at GBs were brought by the fast
diffusion along the GBs. Accordingly, solute atoms’ absorption near the heterogeneous
precipitates should lead to the formation of PFZ.

 Figure 4: TEM micrographs of GB areas in the CP specimen.

 WIT Transactions on Engineering Sciences, Vol 130, © 2021 WIT Press
 www.witpress.com, ISSN 1743-3533 (on-line)
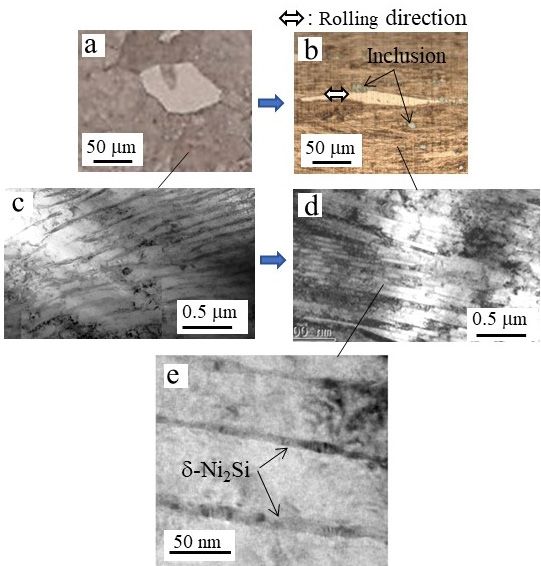
Computational Methods and Experimental Measurements XX 79

3.2 Microstructure of the DP specimen

Fig. 5(a) shows the microstructure of the DP specimen, which consists of almost all DP
phases. Inclusions with a few micrometres in size were formed and most of which were along
GBs. The colonies of fibre-shaped δ-Ni2Si intermetallic compounds were observed inside the
grain [15]. Yellow arrow heads in Fig. 5(b) indicate the DP–DP–phase boundaries in the
grain. It has been established that DP is formed by the decomposition of supersaturated solid
solution into solute-depleted matrix and precipitates across moving boundary [17]. Previous
study [15] on the formation of DP structure has shown that after DP generation at the GBs,
the DPs grew towered the grain interior with moving boundaries. Colonies of Ni2Si fibre
(Fig. 5(c)) with an extremely high aspect ratio were then formed within intergranular DPs.
The DPs grew along a specific orientation in the Cu matrix, even though their growth
orientations were not always uniform inside the same grain (parent grain). Although the
formation of DPs is detrimental to the hardness of Cu–Ni–Si alloys, the electrical
conductivity of DPs is superior to that of the normal aged alloy with the highest hardness
(Fig. 2). The further reduction of Ni and Si solute elements in the Cu matrix during the DP
formation induced the high electrical conductivity of DP specimen.

 a b c
 DP-DP-Phase
 boundary
 δ-Ni2Si

 2 µm 100 nm

Figure 5: Microstructure of the DP specimen. (a) OM micrograph; (b) DP–DP–phase
 boundaries characterized by colonies of fibre-shaped Ni2Si with a specific
 orientation; and (c) TEM image of Ni2Si fibre in the Cu matrix.

3.3 Microstructure of the cold-rolled DP specimen

Simultaneous increase in electrical conductivity and tensile strength of precipitate
strengthened Cu–Ni–Si alloys is often extremely difficult, because a decrease in electric
conductivity is inevitably caused by the available strengthening mechanism. Using Cu–6Ni–
1.4Si–0.1Ti alloys, Han et al. [8] fabricated alloys with fully DP phases through a prolonged
aging (overaging) process. The product was then mechanically rolled with 90% reduction in
area. Such a rolled DP phases showed a simultaneous increase in electrical conductivity and
tensile strength by 1.3 times compared with conventional precipitate-strengthened Cu alloys.
These recent results suggest that Cu alloys with fully DP phases processed by severe plastic
deformation have a great potential as electrical materials with high electrical conductivity
and super-high strength. Here, the microstructure of DP phases subjected to cold-rolling was
investigated. Accordingly, some of the specimens with fully DP phases were then cold-rolled
down to 80% reduction in area (DPR specimen).
 Fig. 6(a) shows the OM micrograph observed on the surface of DP specimen. The DP
phases were composed of fibre-shaped Ni2Si intrametric compound and Cu matrix (Fig. 6(c)).

 WIT Transactions on Engineering Sciences, Vol 130, © 2021 WIT Press
 www.witpress.com, ISSN 1743-3533 (on-line)
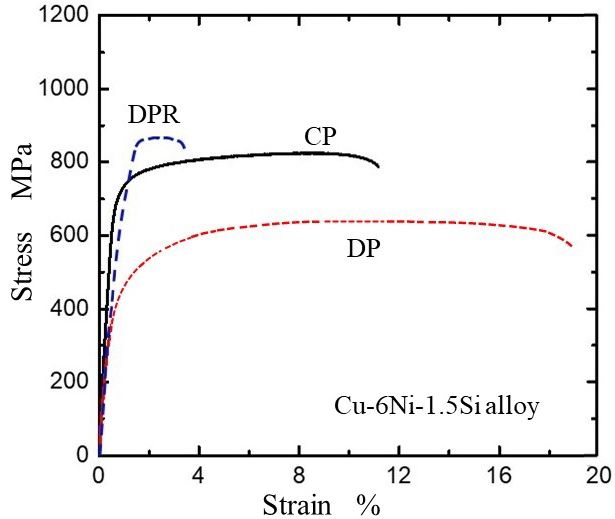
80 Computational Methods and Experimental Measurements XX

Fig. 6(b) is the OM micrograph of the DPR specimen, showing stream lines along rolling
direction. These lines were the array of Ni2Si intermetallic fibres which tend to align along
the direction of cold-rolling (Fig. 6(d)). The analysis [18] on the nanofiber in DP structure
showed that the diameter of intermetallic fibre reduced from 14 to 7 nm as the result of 80%
cold-rolling, while the average spacing between them reduced from 87 to 41 nm.

Figure 6: OM and TEM micrographs of the DPR specimen. (a) and (c) Microstructure
 before cold-rolling; (b) and (d) Microstructure after cold-rolling; and
 (e) Magnified view of Ni2Si fibre after cold-rolling.

3.4 Tensile properties of precipitate strengthened Cu–6Ni–1.5Si alloy

The stress–strain curves of the CP, DP and DPR specimens are shown in Fig. 7. Indeed, the
tensile strength of the DP specimen was lower than that of the CP specimen, however, the
DPR specimen shows the highest tensile strength among the specimens tested. The highest
tensile strength of DPR specimen was mainly caused by the decrease in the radii of aligned
Ni2Si nanofibers and the interdistance between them. It has been shown that an increase in
tensile strength induced by work hardening is less than 60% of that brought by the nanofiber
array formation in Cu–6Ni–1.4Si–0.1Ti alloys subjected to cold-rolling with 90% reduction
in area [8]. The electrical conductivity of the CP and DP specimen was 25 and 44%IACS,
respectively (Fig. 2), while that of the DPR specimen was 41%IACS. Consequently, the DPR
specimen retained a superior combination between the tensile strength and electrical
conductivity, while the tensile elongation was significantly reduced.

 WIT Transactions on Engineering Sciences, Vol 130, © 2021 WIT Press
 www.witpress.com, ISSN 1743-3533 (on-line)
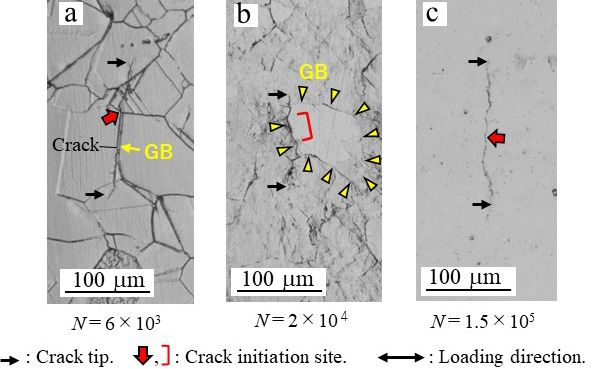
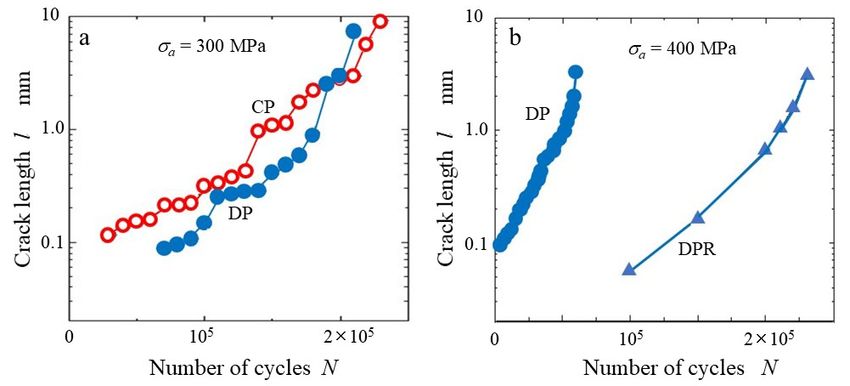
Computational Methods and Experimental Measurements XX 81

 Figure 7: Stress–strain curves of the CP, DP and DPR specimens.

3.5 Fatigue characteristics of precipitate strengthened Cu–6Ni–1.5Si alloy

Previous studies [15], [18] indicated that the S–N plots of the CP specimen were comparable
to that of the DP specimen despite a higher tensile strength for the CP specimen than that
for the DP specimen, and the DPR specimen showed the highest fatigue strength among
specimens tested. The fatigue limit stress at N = 107 cycles, σw, of the DPR specimen
(σw= 300 MPa) was about 1.5 times of the CP (σw= 200 MPa) and DP (σw= 195 MPa)
specimens. The ratios of σw, to the tensile strength, σu, was 0.35 and 0.34 for the DP and
DPR specimen, respectively, while it was 0.25 for the CP specimen.
 Fig. 8(a)–(c) shows the surface morphology around an initial crack formed by cyclic
stressing at σa = 400 MPa. Fatigue crack in the CP specimen was initiated at GBs, followed
by propagation along a favourable crystallographic slip orientation of the grain not along
GBs. On the DP specimen, crack was initiated along GBs. Although the crack path just after
the initiation was along GBs, the crack passed through both GBs and DP phases with further
stressing. The number of cycles to create a grain-sized crack (l ≈ 100 µm) was 3 × 10⁴ for the
CP specimen and 7 × 10⁴ for the DP specimen, respectively. It has been shown [14] that GB
areas of the CP specimen are weakened because of PFZ formation (Fig. 4(a)). An easy GB-
crack initiation of the CP specimen was attributed to weakened GB areas despite the high
tensile strength compared with the DP specimen. A 100-µm long crack in the DPR specimen
was initiated after 1 × 10⁵ repetitions that was significantly larger than that for the CP and
DP specimens. The arrays of finely distributed Ni2Si nanofibers brought the high strength of
DPR specimen and the interface of nanofibers possessed a coherency with Cu matrix [7],
resulting in a drastic increase in crack initiation resistance.
 Fig. 9(a) shows the crack growth curve (lnl vs. N) of the CP and DP specimens at
σa = 300 MPa. The initiation life of grain-sized crack in the CP specimen was shorter than
the DP specimen (Fig. 8(a) and (b)). On the contrary, the crack growth rate was slower in the
CP than the DP specimen. Accordingly, comparable S–N plots between the CP and DP
specimens were attributed to the shorter life on grain-sized crack generation and longer life
on crack growth of the CP specimen. Fig. 9(b) shows the comparison of crack growth curves
between the DP and DPR specimens at σa = 400 MPa. The slop of growth curve for the DP
specimen was steeper than that for the DPR specimen, indicating an enhanced crack growth
resistance in the DPR specimen.

 WIT Transactions on Engineering Sciences, Vol 130, © 2021 WIT Press
 www.witpress.com, ISSN 1743-3533 (on-line)
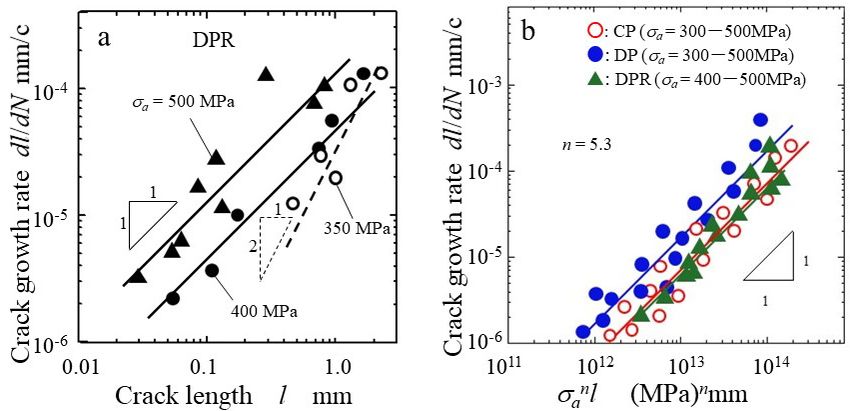
82 Computational Methods and Experimental Measurements XX

Figure 8: The surface damage around crack initiation site at σa = 400 MPa. (a) The CP
 specimen; (b) The DP specimen; and (c) The CPR specimen.

Figure 9: Crack growth curves (lnl vs. N correlation). (a) The CP and DP specimen at
 σa = 300 MPa; and (b) The DP and DPR specimens at σa = 400 MPa.

 Fig. 10(a) shows the dependency of crack growth rate (CGR, dl/dN) on crack length l for
the DPR specimen. Here, the CGR was calculated from the growth curves represented by
smoothed curves which pass through the average of each set of plots. For every constant
stress range, a straight line could be drawn approximately for crack length smaller than
2 mm, while the slop of the lines depended on the stress amplitude. For the range of
σa ≧ 400 MPa, the slope is about 1, indicating that the dl/dN is proportional to l. However,
the slope of line at σa = 350 MPa was steeper than that for high stress ranges (σa ≧ 400 MPa)
and was nearly equal to 2. Extended study on the dl/dN vs. l correlation of the CP and DP
specimens showed that the dl/dN was nearly proportional to l at the stress range of
σa ≧ 300 MPa.

 WIT Transactions on Engineering Sciences, Vol 130, © 2021 WIT Press
 www.witpress.com, ISSN 1743-3533 (on-line)
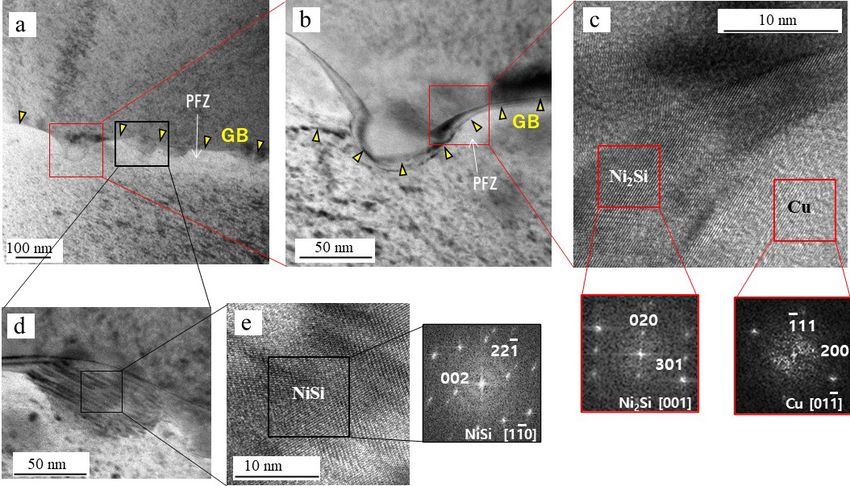
Computational Methods and Experimental Measurements XX 83

 It has been established that stress intensity factor range (SIFR, ∆K) is applicable to
estimate the growth rate of fatigue crack propagating under the condition of small-scale
yielding (a long/large crack at a comparatively low stress). The SIFR cannot estimate the
growth rate of a small/short crack (e.g., l < 1 mm) [19], [20], unlike a large crack growing
under a low cyclic stress. Nisitani et al. [21] and Goto and Nisitani [22] proposed eqn (1) for
determining the growth rate of a mechanically small crack propagating under the large-scale
yielding condition:

 = 1 (1)

where C1 and n are material constants. The studies on small crack growth behaviour in
various metals and alloys, such as carbon steels [21], low alloy steels [22], aluminium alloys
[23], Ni-based superalloys [24], copper [25] and copper alloys [26], indicated that dl/dN of a
small surface-crack in smooth specimens is determined by the term σanl.

Figure 10: The crack growth data. (a) The dl/dN vs. l relationship of the DPR specimen;
 and (b) The dl/dN vs. σan l relationship of the CP, DP and DPR specimens.

 Fig. 10(b) shows the growth data of a small surface-crack with the dl/dN vs. σanl
correlation. The value of n in eqn (1) was 5.3 in all specimens. Excepting a lower stress
amplitude (σa < 300 MPa for the CP and DP specimens, and σa < 400 MPa for the DPR
specimen), the CGR could be uniquely determined by σanl, supporting the validity of eqn (1)
for estimation of growth rate of a small crack. The crack propagation resistance of the DPR
specimen was nearly equal to that of the CP specimen. Therefore, a longer fatigue life of the
DPR specimen was mainly caused by an enhanced crack initiation resistance rather than
crack propagation. At a low stress amplitude, the SIFR should be applicable. The slope of
the dl/dN vs. l correlation at σa = 350 MPa in the DPR specimen was nearly equal to 2
(Fig. 10(a)), suggesting the applicability of Paris law: dl/dN = C∆K4. Bellinia et al. [27]
conducted fatigue tests of Cu–Ni–Si alloy using the CT specimen. They showed the lower
∆Kth and a high CGR for a low ΔK range, followed by a well-developed Paris stage in a range
of ∆K > 6 MPa⋅m0.5.
 The fracture surfaces (1.0 mm beneath the specimen surface) of the CP, DP and DPR
specimens are shown in Fig. 11. The fracture surface of the CP specimen (Fig. 11(a)) had the
rough surface characterized by intergranular and transgranular facets. Such rough surface
was formed as the result of crack propagation along both favourable slip planes of grains and

 WIT Transactions on Engineering Sciences, Vol 130, © 2021 WIT Press
 www.witpress.com, ISSN 1743-3533 (on-line)
84 Computational Methods and Experimental Measurements XX

GBs. The transgranular fracture surface with the presence of some areas characterized by
intergranular facets has been observed in Cu–Ni–Si alloy with a fine and dispersed Ni2Si
phase [27]. The fracture surface of the DP specimen was comparatively flat (Fig. 11(b))
which contrasted well with the rough fracture surface of the CP specimen. The flat surface
appeared to be caused by a variety of Ni2Si fibre orientation of DP colonies formed inside
the parent grain, unlike the CP specimen with a single crystallographic slip orientation in the
grain. The fracture surface of the DPR specimen is shown in Fig. 11(c). The magnified view
of a highlighted area in Fig. 11(c) is likely to assist the crack growth by forming striations.

Figure 11: The fracture surface at 1.0 mm beneath the surface. (a) The CP specimen
 (σa = 300 MPa); (b) The DP specimen (σa = 300 Mpa); and (c) The DPR
 specimen (σa = 350 MPa).

 4 CONCLUSIONS
The main findings of this study of the microstructure and fatigue properties on precipitate
strengthened Cu–6Ni–1.5Si alloys can be summarized as follows.

1. The normal aged specimen (CP) had the matrix strengthened by disk-shaped δ-Ni2Si
 intermetallics with nano-size diameter. The microstructure of overaged specimen (DP)
 showed a cellular component composed of fibre-shaped δ-Ni2Si in the Cu matrix. The
 fibre-shaped δ-Ni2Si intermetallics were elongated in the DP specimen subjected to the
 cold-rolling (80%) (DPR). The diameter of δ-Ni2Si fibre decreased from 14 to 7 nm, while
 the average spacing between them decreased from 87 to 41 nm.
2. The DRP specimen showed the highest tensile strength among the specimens tested: 1.5
 and 1.06 times of the DP specimen and CP specimen, respectively.
3. The fatigue limit stress at 107 cycles of the DPR specimen was 1.5 times of the CP and
 DP specimens. The initiation resistance of a grain-sized crack (l ≈ 100 µm) in the DPR
 specimen was drastically enhanced.

 WIT Transactions on Engineering Sciences, Vol 130, © 2021 WIT Press
 www.witpress.com, ISSN 1743-3533 (on-line)
Computational Methods and Experimental Measurements XX 85

4. At the stress range of σa ≧ 300 MPa for CP/DP and σa ≧ 400 MPa for DPR specimen,
 the growth rate of a small crack can be determined by a term σanl. The value of n was 5.3
 regardless of a difference in the specimens. The crack growth resistance of the DPR
 specimen was nearly equal to that of the CP specimen.
5. The increased tensile and fatigue strengths of the DPR specimen were attributed to a
 reduced spacing between δ-Ni2Si fibres along with work hardening. Consequently, the
 DPR specimen was superior to the CP specimen in all of electrical conductivity, tensile
 strength and fatigue resistance.

 ACKNOWLEDGEMENTS
This study was supported by a Grant-in-Aid for Scientific Research (Kiban-B) (KAKENHI:
No. 18H01340) and for Encouragement of Scientists (No. 18H00244) from the Japan Society
for the Promotion of Science, as well as the National Research Foundation of Korea (NRF)
grant funded by the Korea government (MSIP) 2020M3D1A2098962. The authors are very
grateful to the members of the Strength of Materials Laboratory of Oita University for their
excellent experimental assistance. Thanks are also extended to the members of the Korea
Institute of Materials Science, for the fabrication of the Cu–Ni–Si system alloys.

 REFERENCES
[1] Corson, M.G., Electrical conductor alloys. Electr. World, 89, pp. 137–139, 1927.
[2] Locker, S.A. & Noble, F.W., Precipitate microstructure in a Cu-Ni-Si alloy. J. Mater.
 Sci., 29, pp. 218–226, 1994.
[3] Fujiwara, H., Sato, T. & Kamio, A., Effect of alloy composition on precipitation
 behavior in Cu-Ni-Si alloys. J. Jpn. Inst. Metals., 62, pp. 301–309, 1998.
[4] Hu, T., Chen, J.H., Liu, J.Z., Liu, Z.R. & Wu, C.L., The crystallographic and
 morphological evolution of the strengthening precipitates in Cu–Ni–Si alloys. Acta
 Mater., 61, pp. 1210–1219, 2013.
[5] Srivastava, V.C., Schneider, A., Ojha, V., Uhlenwinkel, S.N. & Bauckhage, K., Age-
 hardening characteristics of Cu–2.4 Ni–0.6 Si alloy produced by the spray forming
 process. J. Mater. Process. Technol., 147, pp. 174–180, 2004.
[6] Monzen, R. & Watanabe, R., Microstructure and mechanical properties of Cu–Ni–Si
 alloys. Mater. Sci. Eng. A, 483–484, pp. 117–119, 2008.
[7] Favez, D., Wagnière, J.D. & Rappaz, M., Au–Fe alloy solidification and solid-state
 transformations. Acta Mater., 58, pp. 1016–1025, 2010.
[8] Han, S.Z. et al., Increasing strength and conductivity of Cu alloy through abnormal
 plastic deformation of an intermetallic compound. Sci. Rep., 6, 30907, 2016.
[9] Semboshi, S., Sato, S., Iwase, A. & Takasugi, T., Discontinuous precipitates in age-
 hardening Cu–Ni–Si alloy. Mater. Charact., 115, pp. 39–45, 2016.
[10] Lockyer, S.A. & Noble, F.W., Fatigue of precipitate strengthened Cu–Ni–Si alloy,
 Mater. Sci. Technol., 15, pp. 1147–1153, 1999.
[11] Sun, Z., Laitem, C. & Vincent, A., Dynamic embrittlement during fatigue of a Cu–Ni–
 Si alloy. Mater. Sci. Eng. A, 528, pp. 6334–6337, 2011.
[12] Fujii, T., Kamio, H., Sugisawa, Y., Onaka, S. & Kato, M., Cyclic softening of Cu–Ni–
 Si alloy single crystals under low-cycle fatigue. Mater. Sci. Forum, 654–656, pp.
 1287–1290, 2010.
[13] Delbove, M., Vogt, J.-B., Bouquere, J., Soreau, T. & Primaux, F., Low cycle fatigue
 behavior of a precipitation hardened Cu–Ni–Si alloy. Int. J. Fatigue, 92, pp. 313–320,
 2016.

 WIT Transactions on Engineering Sciences, Vol 130, © 2021 WIT Press
 www.witpress.com, ISSN 1743-3533 (on-line)
86 Computational Methods and Experimental Measurements XX

[14] Goto, M., Han, S.Z., Lim, S.H., Kitamura, J., Fujimura, T., Ahn, J.-H., Yamamoto, T.,
 Kim, S. & Lee, J., Role of microstructure on initiation and propagation of fatigue
 cracks in precipitate strengthened Cu–Ni–Si alloy. Int. J. Fatigue, 87, pp. 15–21, 2016.
[15] Goto, M. et al., Microstructure-dependent fatigue behavior of aged Cu-6Ni-1.5Si alloy
 with discontinuous/cellular precipitates. Mater. Sci. Eng. A, 747, pp. 63–72, 2019.
[16] Gholami, M. et al., Influence of grain size and precipitation hardening on high cycle
 fatigue performance of CuNiSi alloys. Mater. Sci. Eng. A, 684, pp. 524–533, 2017.
[17] Findik, F., Discontinuous (cellular) precipitation. J. Mater. Sci. Lett., 17, pp. 79–83,
 1998.
[18] Goto, M. et al., Simultaneous increase in electrical conductivity and fatigue strength
 of Cu-Ni-Si alloy by utilizing discontinuous precipitates. Mater. Lett., 288, 129353,
 2021.
[19] Miller, K.J. & de los Rios, E.G. (eds), The Behaviour of Short Fatigue Cracks, EGF-
 Pub 1, MEP, 1986.
[20] Ravichandran, K.S., Ritchie, R.O. & Murakami, Y. (eds), Small Fatigue Cracks:
 Mechanics, Mechanisms and Applications, Elsevier, 1999.
[21] Nisitani, H., Goto, M. & Kawagoishi, N., A small-crack growth law and its related
 phenomena. Eng. Fract. Mech., 41, pp. 499–513, 1992.
[22] Goto, M. & Nisitani, H., Fatigue life prediction of heat-treated carbon steels and low
 alloy steels based on a small-crack growth law. Fatigue Fract. Eng. Mater. Struct., 17,
 pp. 171–185, 1994.
[23] Goto, M. & Kawagoishi, N., Growth behavior and crack distribution characteristics of
 small surface cracks of age-hardened Al-alloy 2017-T4. J. Society Mater. Sci. Jpn., 45,
 pp. 675–679, 1996.
[24] Goto, M. & Knowles, D.M., Initiation and propagation behavior of microcracks in Ni-
 based superalloy Udimet 720 LI. Eng. Fract. Mech., 60, pp. 1–18, 1998.
[25] Goto, M. et al., High-cycle fatigue strength and small-crack growth behavior of
 ultrafine-grained copper with post-ECAP annealing. Eng. Fract. Mech., 110, pp. 218–
 232, 2013.
[26] Goto, M. et al., Behaviour of small fatigue cracks in Cu-5.5Ni-1.28Si alloy round-bar
 specimens. WIT Trans. Eng. Sci., 125, pp. 3–13, 2019.
[27] Bellinia, C., Brotzu, A., Di Cocco, V., Felli, F., Iacoviello, F., Pilone, D., Fatigue crack
 propagation mechanisms in C70250 and CuCrZr copper alloys. Procedia Struct.
 Integrity, 26, pp. 330–335, 2020.

 WIT Transactions on Engineering Sciences, Vol 130, © 2021 WIT Press
 www.witpress.com, ISSN 1743-3533 (on-line)
You can also read