Pre-drill surface seismic in the vicinity of the AIG-10 well and post-drill VSP
←
→
Page content transcription
If your browser does not render page correctly, please read the page content below
C. R. Geoscience 336 (2004) 407–414
Tectonics
Pre-drill surface seismic in the vicinity of the AIG-10 well
and post-drill VSP
Charles Naville a,∗ , Sylvain Serbutoviez a , Isabelle Moretti a , Jean-Marc Daniel a ,
Alexandre Throo a , François Girard a , Andreas Sotiriou b , Akis Tselentis b ,
Christos Skarpzelos b , Christophe Brunet c , François Cornet c
a Institut français du pétrole (IFP), 1 et 4, av. de Bois-Préau, BP 311, 92852 Rueil-Malmaison cedex, France
b Seismological Laboratory, Section of Applied Geology and Geophysics, Geology Department, University of Patras (USPL),
Rio 26110, Greece
c Laboratoire de mécanique des roches, UMR CNRS 7580, département de sismologie, Institut de physique du Globe de Paris, 4,
place Jussieu, 75250 Paris cedex 05, France
Received 17 November 2003; accepted after revision 1 December 2003
Written on invitation of the Editorial Board
Abstract
Pre-drill reflection surface seismic was carried out in the Aigion city area in February 2001. The poor quality of seismic
reflections obtained from standard processing did not allow us to refine the location of the vertical well AIG-10 to be drilled.
Subsequently, a brief study of refracted seismic arrivals was attempted in order to better define the well location, in conjunction
with observations from a shallow well. In 2002, after drilling, an innovative 6-VSP position well seismic survey was success-
fully run, using a four-component downhole sensor tool, i.e., three orthogonal geophones and a hydrophone. Refracted seismic
events and first arrivals from VSP indicated the throw of the Aigion Fault and the fault plane dip; a secondary accident striking
about south–north was detected about 100 m west of the well. No P–P seismic reflection was evidenced from standard VSP
processing. To cite this article: C. Naville et al., C. R. Geoscience 336 (2004).
2004 Académie des sciences. Published by Elsevier SAS. All rights reserved.
Résumé
Sismique de surface avant forage du puits AIG-10, et VSP (Vertical Seismic Profiling) après forage. Une campagne de
sismique réflexion de surface fut tirée dans la zone d’Aigion en février 2001 : les résultats du traitement standard réflexion,
trop pauvres, n’ont pas permis d’affiner le modèle structural pour implanter le puits vertical AIG-10. Une brève étude des ar-
rivées réfractées fut alors tentée, afin de mieux définir la position du forage, combinée à des observations d’un puits à faible
profondeur. À l’automne 2002, après forage, une campagne de sismique de puits innovante, comprenant six VSP, fut conduite
en utilisant un outil de puits à quatre composantes de réception : trois géophones orthogonaux et un hydrophone. Les arrivées
directes et diffractées des VSP ont permis de préciser le rejet vertical de la faille d’Aigion et le pendage du plan de faille, tandis
qu’un accident secondaire sensiblement nord–sud à 100 m à l’ouest du puits a été révélé. Aucune réflexion P–P n’a été mise en
évidence par le traitement VSP. Pour citer cet article : C. Naville et al., C. R. Geoscience 336 (2004).
2004 Académie des sciences. Published by Elsevier SAS. All rights reserved.
* Corresponding author.
E-mail address: charles.naville@ifp.fr (C. Naville).
1631-0713/$ – see front matter 2004 Académie des sciences. Published by Elsevier SAS. All rights reserved.
doi:10.1016/j.crte.2003.12.010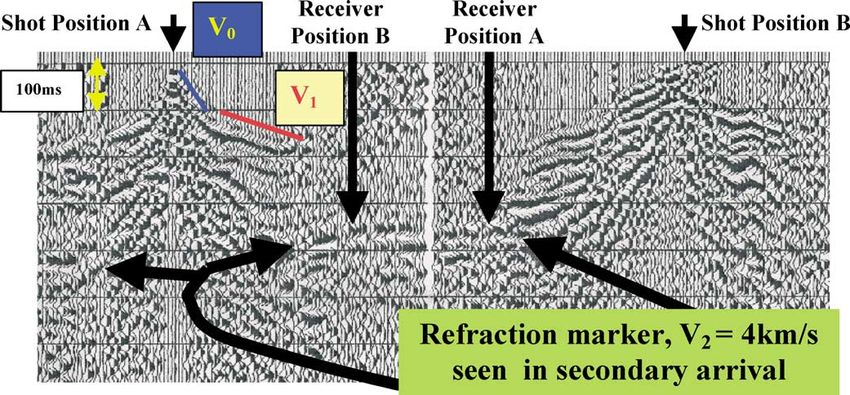
408                                          C. Naville et al. / C. R. Geoscience 336 (2004) 407–414

Keywords: Corinth; seismic; Aigion Fault; AIG-10 well; VSP; refraction; diffraction; hydrophon well sensor

Mots-clés : Corinthe ; sismique ; faille d’Aigion ; puits AIG-10 ; PSV ; réfraction ; diffraction ; capteur de puits

1. Pre-drill surface seismic survey and results                                southern compartment represents a maximum depth
                                                                               value.
    A grid of four surface seismic reflection lines was                           In the northern compartment, the depth of the
recorded by the Patras University (UPSL) in order to                           top carbonate target was derived from the following
image the Aigion area and to refine the location of ver-                       estimation of the Aigion Fault throw: a shallow well
tical well AIG-10 to be drilled in the harbour zone                            previously drilled in the conglomerates encountered in
of the Aigion City. The drilling objectives of AIG-                            the northern compartment around 160 m depth/MSL;
10 well were (A) to cross the Aigion Fault in the                              as the elevation of the outcropping conglomerates in
700–1000 m depth interval, and (B) to encounter the                            the southern compartment is 100 m, a 260 m throw
limestone substratum before intersecting the Aigion                            value was taken.
Fault, so as to enable studying the effects of fracturing
and faulting within the limestone formation: this was
motivated by the importance of carbonates as hydro-                            2. Suggestions for further surface seismic
carbon bearing reservoirs. Unfortunately, the surface                          processing
reflection seismic imaging is poor to null, in spite of
the good quality of the raw seismic records acquired:                             (1) Fig. 1 shows from line L1 a clear diffraction
Fig. 1 shows a correlated field record, using a 50 000-                        pattern associated with the Aigion Fault. Many similar
lbs peak-force vibrator, stack of three sweeps 8–80 Hz,                        patterns have been observed on all lines, and can be
120 traces, 15 m apart. Worse, on the seismic line L2                          used to map the main accidents around Aigion.
across Aigion city, no result could be obtained in the                            (2) Reflection reprocessing with improved mute,
northern compartment of the Aigion Fault, either from                          static and stacking velocities.
reflection or refraction seismic methods, which locally
indicates a high level of heterogeneity.
    Consequently, the southern compartment was                                 3. Post-drill well seismic survey using wireline
briefly studied using the refracted arrivals of a                              VSP (Vertical Seismic Profiling) technique
4 000 m s−1 marker, corresponding possibly to the top
of the carbonate substratum of interest, allowing to es-                           The AIG-10 well successively encountered a slow
timate its depth (Gardner method, 1939, [1]); Fig. 2                           velocity (2500 m s−1 ) shale layer below the conglom-
shows a couple of direct and reverse shot displays from                        erates, at 300 m, a high velocity (3600 m s−1 ) radio-
line L2, in reduced time (T − X/V ), showing a well-                           larite formation around 520 m, and very-high-velocity
defined 4 km s−1 refraction marker in secondary ar-                            carbonates (5500 m s−1 ) at 696 m. The well inter-
rival at intercept time 370 ms, with a critical offset dif-                    sected the Aigion Fault at 760 m, reached then a
ficult to read, about 900 ± 100 m. The three-velocity                          1000 m total depth into 5000 m s−1 carbonates. Af-
layer sketch in Fig. 3 shows the depth estimate of the                         ter drilling and wireline logging, a six-source posi-
refraction markers from ground level; the velocities                           tion VSP survey (Fig. 4) was successfully operated by
are derived from the observed direct and refracted ar-                         UPSL/IPGP/IFP, using the new SSR–CGG VSP tool,
rivals. At the time, the 3150 m s−1 conglomerate for-                          characterized by improved coupling isotropy, with the
mation was assumed to extend down to the 4 km s−1                              following initial aims:
refraction marker assimilated to carbonates, so that
no velocity inversion was expected, and the refraction                         (1) to illuminate the major structural features in the
critical offset had not been used to estimate the over-                            well vicinity: faults, dipping reflectors, etc., and
burden velocity. Therefore, the resulting 660 m depth                              obtain seismic velocity measurements in P and
prediction for the presumed top of carbonates in the                               S modes;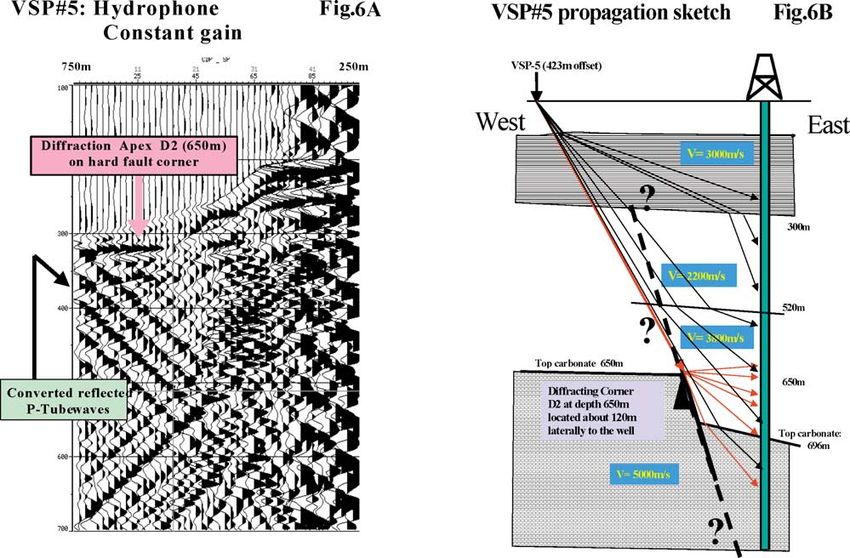
C. Naville et al. / C. R. Geoscience 336 (2004) 407–414                                          409

                           Fig. 1. Raw surface seismic record on line L1: diffraction generated by the Aigion Fault.
                               Fig. 1. Enregistrement sismique brut, ligne L1 : diffraction sur la faille d’Aigion.

Fig. 2. Refraction arrivals on the presumed limestone marker, southern compartment of the Aigion Fault: direct and reverse records, in reduced
time (correction T − X/V ) with V = 4 km s−1 .
Fig. 2. Arrivées réfractées du marqueur présumé du toit des calcaires, côté sud de la faille d’Aigion : tirs directs et inverses, rejeux en temps
réduits (T − X/V ), avec V = 4 km s−1 .

(2) to investigate the reasons for the lack of surface                      reasons. Unfortunately, the well could not be cleaned
    seismic results in the immediate well vicinity;                         when the VSP tool could not be lowered deeper than
(3) to study the additional information brought by the                      755 m. The VSP acquisition is detailed in the EU 3F-
    hydrophone measurements;                                                CORINTH second-year progress report.
(4) eventually, to study the S-wave anisotropy, which
    can be chancy in a faulted geological environment.
                                                                            4. VSP processing results
   VSP parameters: depth sampling, deep part: 10 m,
15 m above; sweep 8–100 Hz; sampling rate: 2 ms.                               Surprisingly, in spite of major velocity contrasts ex-
   The VSP survey took place after removal of the                           pressed by the sonic log and by the interval velocities
drilling machine due to operational and financial                           derived from direct arrival VSP times, the 3C or hy-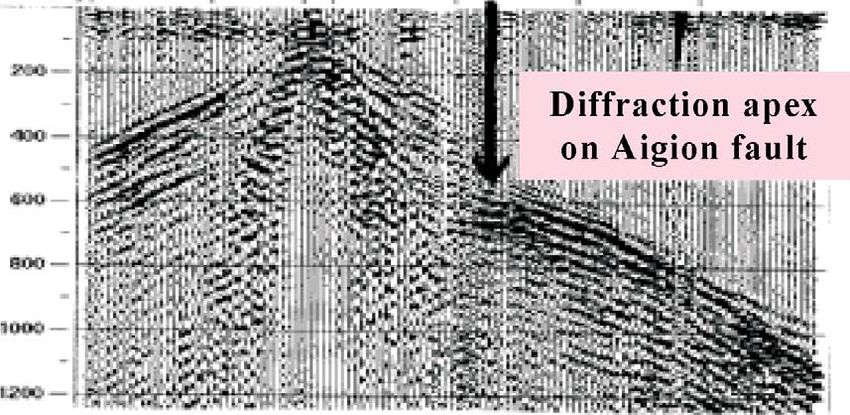
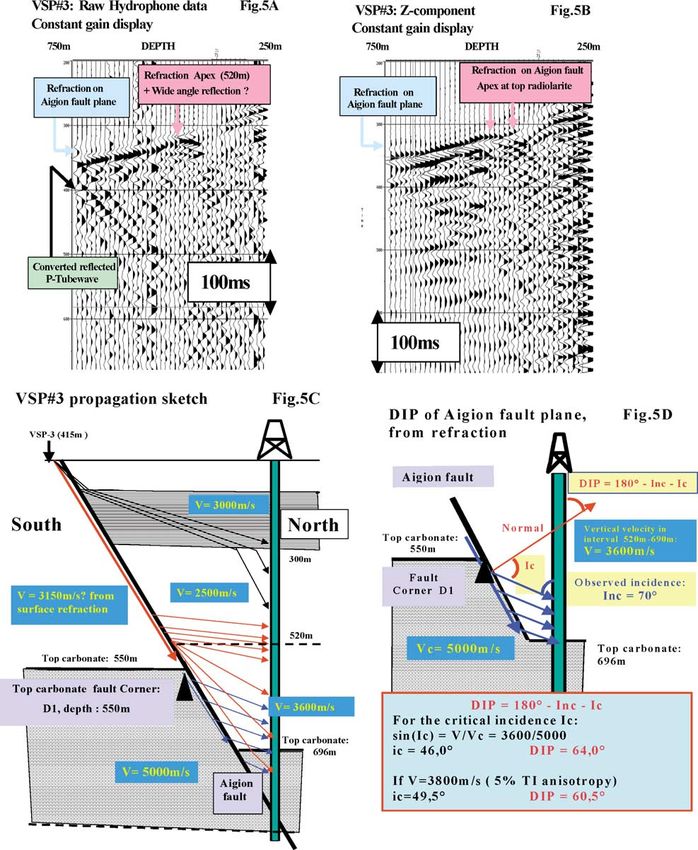
410                                        C. Naville et al. / C. R. Geoscience 336 (2004) 407–414

Fig. 3. Pre-drill structural sketch in AIG-10 well vicinity. The 4 km s−1 refraction Marker depth on the southern side of the Aigion Fault is
estimated at 660 m from the surface. On the north of the Aigion Fault, a shallow well encountered the top of conglomerates at depth 160 m/MSL.
Therefore, the 4 km s−1 refraction Marker was expected on the northern side of the Aigion Fault in the depth range 820–900 m/MSL.
Fig. 3. Schéma structural du voisinage du puits AIG-10, avant forage. La profondeur du marqueur réfraction à 4 km s−1 , du côté sud de la faille
d’Aigion est estimée à 660 m par rapport au sol. Du côté nord, un puits peu profond a rencontré le toit des conglomérats à 160 m par rapport à
la mer. Ainsi, la profondeur minimale du marqueur à 4 km s−1 a-t-elle été estimée à 660 + 160 = 820 m/MSL.

drophone VSP processed results do not evidence clear                       wave propagates along the fault plane, then refracts
P–P reflected events, even on the depth stations lo-                       towards the well whenever the velocity is significantly
cated right above the major impedance contrast lev-                        lower in the northern low compartment of the fault.
els. Only a few coherent P–S-converted reflected line-                     Above depth 520 m, the polarisation observed at the
ups appear after velocity-filter removal of the down-                      well indicates that the velocity in the southern side of
going P-wave train, and call for further analysis. As                      the fault is lower than 5000 m s−1 , meaning that the
the amplitudes of VSP reflection are about one order                       top of the carbonates is lower than 520 m on the south-
of magnitude lower than direct arrivals on raw signals,                    ern side (Fig. 5C).
the high-energy direct, diffracted or refracted arrivals                       Additionally, on the deep part of VSP#3 (leftmost
have been studied and yielded additional structural in-                    traces in Fig. 5A and B), a weak refracted first arrival
formation.                                                                 appears below depth 600 m, with vertical incidence
   On Offset VSP#3, with source located right on the                       at the well measuring 70◦ (Fig. 5D). Given the depth
surface trace of Aigion Fault, the direct arrival at shal-                 at which this weak refracted arrival appears (600 m)
low depth (right side of displays in Fig. 5A and B) is                     and the geometry, the hard carbonate fault corner is ex-
abnormally weaker than in depth, in contrast with all                      pected around 550 m (D1 on sketch in Fig. 5C and D).
other five VSPs (e.g., Fig. 6A). Actually, in the deep                     Knowing the velocity in both fault compartments be-
part, the first-arrival wave train (left half displays in                  tween 660 and 690 m, the dip of the Aigion Fault
Fig. 5A and B) exhibits a high-energy refraction pat-                      plane has been estimated from the incidence angles
tern with apex at 500–520 m, right at the top of a high-                   (see Fig. 5D). The 60◦ dip value obtained closely cor-
velocity radiolarite layer, at 3800 m s−1 (Fig. 5C).                       responds to the dip of a straight line joining the surface
From depth 480 m to 520 m, the direct arrival polari-                      source position VSP#3 to the intersection of the well
sation is near horizontal, but oriented slightly down-                     with the fault at depth 760 m, which is in agreement
wards, indicating that a high-energy downgoing P-                          with the dipmeter log measurements.
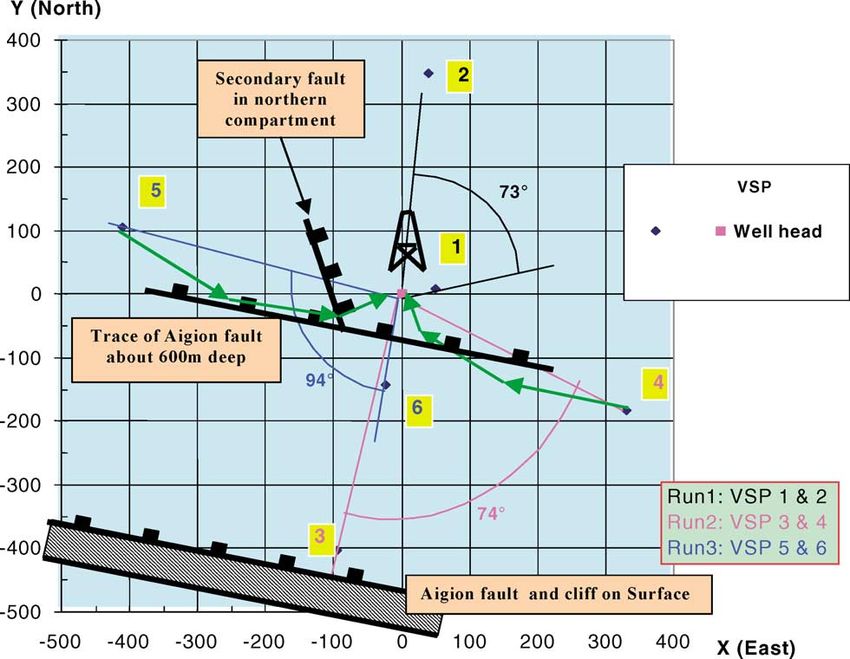
C. Naville et al. / C. R. Geoscience 336 (2004) 407–414                                            411

Fig. 4. Plane view of wellhead and VSP source positions: VSP#3 yields the dip of the Aigion Fault plane (60◦ ), and the vertical throw of
the Aigion Fault (about 150 m). Below depth 600 m, VSP# 5 detected a secondary accident located 100 m west of the well. Conventionally,
the direct arrival azimuths of all VSP’s nearly follow the source to well direction. However, the direct arrival azimuths of VSP#4 and 5 are
deviated below 600 m due to total refraction on the nearby Aigion Fault plane (green rays), confirming the higher velocity in the southern fault
compartment, as the fault plane is associated with a strong lateral velocity contrast.
Fig. 4. Schéma de position de la tête de puits AIG-10 et des sources PSV : PSV#3 donne le pendage de la faille d’Aigion (60◦ ), et le rejet
de faille (environ 150 m). Au-dessous de 600 m, le PSV#5 a détecté un accident secondaire situé à 100 m à l’ouest du puits. Par convention,
l’azimut d’arrivée directe PSV est assimilée à la direction source–récepteur/puits (hypothèse de milieu stratifié horizontal). Dans le cas présent,
les azimuts d’arrivée directe des PSV#4 et 5 sont fortement déviés au-dessous de 600 m par la réfraction totale sur le compartiment sud de faille
d’Aigion toute proche (rais verts), confirmant ainsi l’accroissement brutal de la vitesse dans le compartiment sud, au travers du plan de faille.

   On Offset VSP#5, located west of the well (Fig. 4),                       to-well-receiver radial direction below 600 m, due to
an obvious diffraction pattern appears (see Fig. 6A),                        the close proximity of the high-velocity southern com-
expressing the presence of a secondary accident char-                        partment of the Aigion Fault, generating a partially re-
acterised by a hard rock edge about 650 m deep, with                         fracted propagation along the fault plane, as illustrated
a downthrow looking eastward to the well (Fig. 6B).                          by the green rays in Fig. 4. Although each VSP run
The polarisation from oriented 3C geophones indi-                            was recorded with two sources in different azimuths
cates a P-wave mode diffraction, and a subsequent                            from the well, VSP# 4 and 5 could not be used to ori-
time inversion computation yields a distance of about                        ent the horizontal components.
100–120 m to the well. The strike of this accident
trends toward SSE–NNW, although it could not be
sharply defined since orienting the horizontal compo-                        5. Hydrophone VSP data
nents was delicate.
   As a matter of fact, the direct arrival polarisations                        Strong P-tube upgoing converted arrivals appear on
from VSP#4 and 5 strongly deviate from the source-                           the hydrophone signals (Figs. 5A and 6A), mainly

412                                         C. Naville et al. / C. R. Geoscience 336 (2004) 407–414

Fig. 5. (A,B) P-wave refraction on Aigion Fault plane, actually observed on Offset VSP 3. (C,D) Sketches of Refracted propagation on Aigion
Fault plane. Black rays: weak amplitude, near-vertical polarisation. Red rays: strong amplitude arrivals; above and around the apex depth 520 m,
top of the high-velocity 3800 m s−1 radiolarite layer, the propagation is nearly horizontal: it indicates that the downgoing propagation roughly
follows the Aigion Fault plane, then refracts towards the well. Blue rays: medium amplitude, Refraction on fault plane along high velocity
carbonates, vertical incidence measured: 70◦ , leads to a 60◦ DIP for the Aigion Fault plane (D). It implies that the depth of the hard carbonate
fault corner D1 is about 550 m.
Fig. 5. (A,B) Réfraction en onde-P sur le plan de faille d’Aigion, observé sur PSV#3-offset. (C,D) Schémas de propagation réfractée le long du
plan de faille d’Aigion. Rais noirs : amplitude faible, polarisation proche de la verticale. Rais rouges : arrivées d’amplitude forte : à proximité
de la profondeur d’apex 520 m, correspondant au toit d’un banc de radiolarite de vitesse élevée 3800 m s−1 , la propagation est proche de
l’horizontale : l’onde descendante se propage donc le long de la faille d’Aigion, puis se réfracte vers le puits, impliquant une vitesse plus
élevée dans le compartiment sud. Rais bleus : amplitude moyenne, réfraction sur le plan de faille au droit des carbonates de vitesse très élevée :
l’incidence verticale mesurée à 70◦ conduit à un pendage de faille de 60◦ (Fig. 5D). L’arête D1 du toit des carbonates côté sud se situe à environ
550 m de profondeur.
C. Naville et al. / C. R. Geoscience 336 (2004) 407–414                                            413

Fig. 6. (A,B) Observation from Offset VSP 5 (west): black rays, direct arrival; red rays: strong diffraction on hard rock fault corner with apex
above the carbonates depth at the well; the well is located on the low compartment of the fault (B).
Fig. 6. (A,B) Observations sur le PSV#5-Offset (ouest). Rais noirs : arrivée directe ; rais rouges : diffraction de FORTE amplitude sur une arête
de faille saillante, de roche indurée, avec apex à 650 m, au-dessus de la profondeur des carbonates rencontrés au puits ; le puits est localisé dans
le compartiment abaissé de cet accident, comme indiqué sur la Fig. 6B.

generated right at the depth of a permeable frac-                            7. Preliminary conclusions on the AIG-10 VSP
ture/fault, at 744 m. The amplitude variations of P-tube                     study
arrivals at 744 m versus VSP source azimuth need
to be better understood and geologically interpreted.
                                                                                 The oriented four-component VSP constrained the
Small P-tube conversions appear in the cased part
                                                                             geometry of the Aigion Fault, narrowing the fault dip
right at the level of earth impedance contrasts. The
hydrophone data show none of the strong S-wave                               to 60–64◦ to the NNE, with a throw of 150 m instead
events recorded by the 3C geophones. Many undesired                          of 260 m prior to drilling.
downgoing tube wave arrivals are recorded by the hy-                             The VSP revealed the existence of a secondary
drophone only: they would have been attenuated by                            accident striking about SSE–NNW in the lowered
aerating the mud column if the VSP operation had                             northern compartment of the Aigion Fault, located
been carried out in presence of the drilling machine,                        about to the 100 m west of the well at 650 m
as initially planned.                                                        depth, with an eastward downthrow of about 50 m, as
                                                                             illustrated in the plane view sketch in Fig. 4.
                                                                                 The 4 km s−1 refraction marker observed in the
6. Methods used                                                              southern compartment needs to be identified, its depth
                                                                             remains to be updated from geological constraints,
   Since no reflection were apparent after processing,                       using the velocity model of upper layers from sonic
the first and secondary VSP arrivals of high energy                          log and VSP in replacement of the pre-drill single
have been analysed, inspired by methods described                            3150 m s−1 upper-layer model of Fig. 2.
in references [1–3], related to the recognition and                              Although additional seismic results can be expected
analysis of refraction and diffraction patterns.                             from more extensive data processing, the question
414 C. Naville et al. / C. R. Geoscience 336 (2004) 407–414
raised by the lack of seismic reflection in surface and [2] L.W. Gardner, Seismograph determination of salt dome bound-
well seismic remains to be answered. ary using well detector deep on dome flank, SEG meeting,
Denver, Colorado, 26 April 1948, Geophysics 14 (1) (1949)
29–38.
References [3] Y. Ledoux, Quelques exemples de diffractions en sismique-
réfraction et leur application à la détermination des vitesses
[1] L.W. Gardner, An areal plan of mapping subsurface structure by verticales, EAEG meeting, June 1957, Geophys. Prospect. 5
refraction shooting, Geophysics 4 (1939) 247–359. (1957) 392–406.You can also read