Design Challenges for a fuel cell powered MP3 player
←
→
Page content transcription
If your browser does not render page correctly, please read the page content below
Design Challenges for a fuel cell powered MP3 player
                                           Bas Flipsen*
              Delft University of Technology, faculty of Industrial Design Engineering
          Landbergstraat 15, 2628 CE DELFT, the NETHERLANDS, s.f.j.flipsen@tudelft.nl

Abstract
The main driving force for developments in power sources is longer run times and more functionality
with same battery lifetime. To satisfy the quest for higher energy densities fuel cells seems to be the
power source of the future for portable electronics, especially the Direct Methanol Fuel Cell. In this
paper a short analysis is made into the world of fuel cells and its application field. The opportunities
and disadvantages of fuel-cells have been researched. To test the feasibility of a fuel-cell power-
system a design is made from available components. The fuel-cell power-system should equal the
energy and power characteristics of the lithium polymer battery used in the MP3 player. The final
design shows the energy and power density of the total system is much lower than the battery.
Recommendations are made to increase the energy and power density of the power system, making it
compete with lithium rechargeables.

Keywords: Direct Methanol fuel cell, design, MP3 player, portable power source, design, hybrid fuel
cell system.

1 Introduction
In portable electronics the longing for long run times is the driving force for developments in power
sources. At the moment the lithium ion rechargeable battery is the best option, with long runtimes,
increasingly lesser charging periods and high energy densities. The Sony 383450A8 prismatic lithium-
ion battery already has an energy density of 220 Wh kg-1 (475Wh L-1). The energy density of lithium-
ion batteries has been increasing with 5 to 10% per year [1]. Although Broussely and Archdale [2]
state that the maximum attainable will probably be around 225Wh kg-1 (550Wh L-1). To satisfy the
quest for higher energy densities fuel cells seems to be the power source of the future for portable
electronics, especially the Direct Methanol Fuel Cells (DMFC) [3].

To test the feasibility of DMFC systems in portable electronics a design of a fuel-cell power-system is
made which can power a flash-drive MP3 player, in our case the Samsung YP Z5F. The peak loads of
the MP3 player are very high (880mW) compared to its standby and standard run loads (10-72mW),
making a basic fuel cell system without auxiliaries, the passive system, to bulky. To make the power
source more convenient a fuel cell-battery combination, the hybrid system, is a must. This hybrid
system combines best of both worlds: the high energy density of methanol and the high power density
of batteries.

2 Fuel cells and its application field
In theory the energy density of DMFC power-systems could be a factor 4 to 10 higher than lithium ion
batteries. It is clear that a fuel-cell power-system not only consists of methanol but also a power
converter, the fuel cell, a fuel tank and auxiliary components such as pumps tubing and electronics.
Figure 1 shows a comparison between the DMFC power system and lithium ion batteries in a so-
called Ragone plot. The DMFC system is based on the Motorola Impress charging house [4].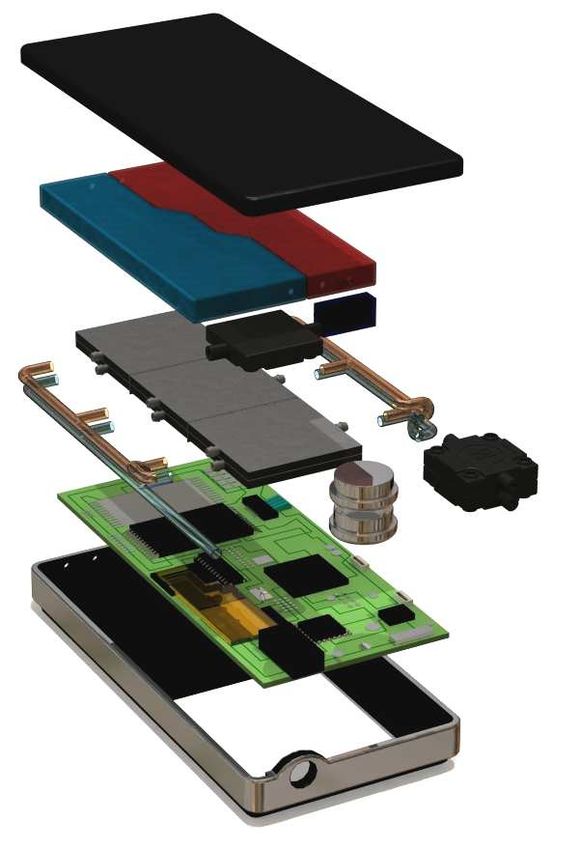
Fields of oppertunity for DMFC (L)
                                                                                                       1C discharge line
                                        10000

                                                                            DMFC
                                                                            Lithium Ion (4,2V, 7Ah)
                                                                            lineair (25%)
                                                                            diminishing empty space      0,1C discharge
                                         1000                               total optimum                     line
                    Peak Power (W L )

                                                      Harddrive MP3
                   -1

                                                     [A]                  [B]
                                                      Laptop computer Flashdrive MP3                     0,01C discharge
                                          100
                                                              PDA     Mobile phone                             line

                                                           Sensors
                                                                          [C]
                                           10

                                                                      Smoke Detector

                                            1
                                                10         100                1000                    10000
                                                                                      -1
                                                       Battery Capacity (Wh L )

                 Figure 1: volumetric comparison of the lithium-ion battery and DMFC systems.

The uninterrupted lines show the two power systems, DMFC and lithium-ion. It shows that the
lithium ion battery is more power dense than the DMFC system. This is mainly caused by the high
volume of the fuel cell at high power output. The fuel-cell system can be optimized by diminishing
empty space (long dotted line) and increasing fuel cell efficiency from 20% to 25% (short dotted line).
The grey line shows the increase in power density when both optimizations are implemented. It shows
that power density can be increased to approximately 60W L-1. This is still very low compared to the
lithium ion battery (>2000W/L). The energy density of the DMFC system is much higher than that of
the lithium battery. Increase in energy density of the DMFC system can be reached when the
efficiency of the cell and system is increased.

2.1 Application field
Different power and energy characteristics of different consumer electronics are added into Figure 1.
Three different application fields can be distinguished. For products in field [A] the graph shows that
the fuel cell system is not going to be an improvement, even when the fuel-cell system is optimized.
On the other hand in field [C] the DMFC system is smaller than the lithium ion battery. This field of
opportunity is especially interesting for actively fueled DMFC systems working in applications
requiring low power and long runtimes. Field [B] shows the opportunity for actively fueled fuel cells
combined with a battery, a so-called hybrid power source. The hybrid power source uses best of both
worlds: high ‘energy density’ of the methanol and high ‘power density’ of the lithium ion battery.
Hybrid system are generally more complex than active fuel-cell systems and definitely more complex
than the lithium ion battery self. The number of components and production cost of fuel cell systems
is in general higher compared to ‘easy’ to produce lithium ion batteries. When looking at innovation
strategies the first DMFC system on the market will probably a low-power product with a long
runtime. Thus the first implementation of DMFC systems in portable electronics will probably be
passive or active fuel-cell systems powering applications such as ad-hoc sensors and the smoke
detector.
For products with variable power load, like the laptop computer, PDA cell phone and MP3 player, the
passive fuel cell system, field [C], is not going to be sufficient. A hybrid option, field [B], can
improve runtime for these products. Because generally the runtime of a flash-drive portable MP3
player is high this product is a good application for hybrid fuel-cell systems.
2.2 Analysis of the MP3 player
For this project a small comparison is made between different flash-drive MP3 players and according
to the specifications sheets the Samsung YP-Z5 has the longest runtime up to 35 hours. The battery
used in this model works at 3,8 Volts and is rated at 820mAh. In Table 1 an overview is given of the
characteristics of the MP3 player and the battery.
MP3 player size 90x42,2x11,4mm3
Battery size 66x33x4mm3
Battery weight 21g
Battery volume percentage 20%v/v
Capacity 3,7Vx820mAh
Battery life 20-35h
Mean power 87-152mW
Energy density 348Wh L-1; 145Wh kg-1
Mean power density 9-17W L-1; 4-7W kg-1
Table 1: overview of the characteristics of the Samsung YP-Z5 MP3 player.
3 Power tests of the MP3 player
To get a more precise impression on the runtimes and power profile of the MP3 player the Samsung
Z5F is tested under different conditions. First a durability test is conducted. Second the different
power modes are measured: (i) standby, (ii) play MP3 (56, 128kbps, etc), (iii) light on/off and (iv)
pictures. These measurements give the nominal, mean and peak power output of the fuel cell system
to be designed.
3.1 Test Setup
The power draw of the battery depends on different aspects of play mode as described in above. All
tests are executed with a Grant SQ800 data logger at a measure rate of 1 second. Figure 2 shows the
test setup. The current is measured over a resistor of 1Ω and the voltage is measured over the MP3
player.Current Ω
1Ω
measurement V
+
3,8V,
820mAh
_
Working
V Voltage
measurement
Figure 2: test setup to measure the current draw and working voltage for the Samsung Z5F MP3 player.
3.2 Durability test
In Figure 3 the durability test results are shown. The test is executed while playing the U2 album “All
that you can't leave behind” at 128kbps and in shuffle mode. After 46,5 hours the MP3 player ended
playing. The mean power draw during this continuous play mode is 70mW. The current draw ranged
in between 17 and 22mA and the voltage ranged from 3,4 to 4,1V. The maximum calculated capacity
of the battery is 864mAh or 3315mWh.
4,5 25 600,0
4
20 500,0
3,5 WMA 128kBs
MP3 128kBs
3 400,0
power use (mW)
15
Current (mA)
Voltage (V)
2,5
300,0
2
10
Voltage (V)
1,5
Current (mA) 200,0
1
5
0,5 100,0
0 0
28-06-06 28-06-06 29-06-06 29-06-06 30-06-06 30-06-06 1-07-06 0,0
0:00 12:00 0:00 12:00 0:00 12:00 0:00 0 50 100 150 200 250
tim e time (sec)
Figure 3: voltage and current use during a full discharge in Figure 4: power draw of two different compression
continuous play mode, without interruption. formats, WMA and MP3, both at 128kBs.
3.3 Bit-rate and file compression test
From test executed with bitrates ranging from 56kbps to 256kbps no difference was found in the
power draw. At every bit-rate the power draw for MP3’s was 72mW (with lights out, 50% loudness).
However a large difference is found when different compression formats are used. In Figure 4 the
power draw is depicted for the same song but differently compressed to either a MP3 or WMA file,
played at 128kbps. When both the backlight and the screen were set to off the power drawn is 72 and
99mW for respectively the MP3 and WMA file. In general the power draw of the system is largely
prescribed by the backlights and the LCD screen (see Table 2).MP3 128kBs WMA 128kBs
Start (everything on) 264 (186-363) mW 321 (245-519) mW
Lights off 236 (156-450) mW 230 (169-428) mW
Screen off 72 (61-92) mW 99 (78-191) mW
Table 2: The difference of in mean, minimum and maximum power draw for the same MP3 and WMA file.
3.4 Display and loudness test
To get a better insight in the power draw of the LED lights and the LCD screen, a luminance test has
been executed. For this test the screen luminance is raised from lights off (0%) to maximum
luminance (100%), when screen was on and the music was set to off. The power draw of the LEDs
seems to be linear to the percentage of luminance and ranges from 146mW at 0% to 381mW at 100%
luminance. From these figures it can be concluded that the power draw of the LCD screen plus
internal components is equal to 146mW and the backlights will take up a mean 235mW at maximum
luminance.
To get an impression of the influence of sound level a loudness test is executed. The song (128kbps,
MP3) is repeated at 5 different sound levels (0%, 25%, 50%, 75% and at 100%). When lights and
screen are set to off, the power consumption of the first four sound levels did not change much,
~73mW. When the sound level was boosted to 100% the power consumption increased to
approximately 114mW, with lights and screen set to off.
3.5 Start up and power down test
Peak powers are very large, and the maximum peak power was measured during power down:
867mW for almost 2 seconds. The startup and the power down of the system are shown in Figure 5.
When the system shuts down it goes into standby mode, still draining approximately 10mW
continuously. After 24 hours of inactivity the system completely shuts down and doesn’t drain the
battery anymore. Startup from standby mode is different and shorter in time than a full start-up.
standby
1.000 coarsened load curve
start up lights on lights off power down
900 5,82mWh 3,17mWh 1,26mWh 1,27mWh
350
Pow er MP3 128kBs
800
300 Pow er WMA 128kBs
700 mean pow er MP3
power use (mW)
250 mean pow er WMA
600
load (mW)
500 200
400
150
300
100
200
100 50
-
0
1 21 41 61 81 101 121
0 30 60 90 120 150 180 210 240
time (sec)
tim e (s)
Figure 5: Start up and power down of the MP3 player. Figure 6: the coarsened load curve.
3.6 Live user scenario’s
When designing a fuel cell system two parameters are very important: the mean and maximum peak
power draw of the load. Based on user profiles these parameters can be chosen. Assuming the powerdrain per function can be summed, the following equation can be used for simulating the dynamic
power draw of the MP3 player:
E = ∫ ( Pstandby + Pscreen + Pbacklight + Pmusic ) dt (1)
Where: Pstandby = 10mW
Pscreen = 136mW (for both on and off)
Pbacklight = 235 ⋅ I light intensity
61 − 104mW for MP3
Pmusic = (at 75% and 100% loudness)
89 − 130mW for WMA
In this case we are going to assume the worst case scenario, namely an “intensive user”, listening to
one song at a time. After listening to it he/she is using the display to skip to the next number or
picture. The load profile of Figure 4 is used and coarsened as visualized in Figure 6. This load curve
has been repeated for at least 2 hours, equaling 30 cycles. Figure 7 shows a pie-chart diagram of the
power breakdown of the MP3 player.
backlight (@100%)
LCD
added when Standby; 10 loudness (@100%)
using WMA; 30 added when using WMA
Standby
loudness
(@100%); 104
backlight
(@100%); 235
LCD; 136
Figure 7: mean power use of different functions in the MP3 player.
As can be seen from the Figure 6 the WMA files are more demanding than the MP3 files. The
nominal power drain for 128kBs WMA files is 150mW and the maximum power draw is 321mW.
Between songs the user is probably playing with the MP3 player for ~10 seconds at maximum power
drain of 321mW. The load characteristic which this standardized user is demanding is quantized in
Table 3.Period PMP3 PWMA EMP3 EWMA
(sec) [mW] [mW] [mWs] [mWs]
Playing 10 264 321 2640 3210
Start 30 264 321 7920 9600
Lights off 30 236 230 7080 6900
Screen off 180 72 99 12960 17820
Total 240 - - 30600 37560
Mean - 122 150 - -
Table 3: The load curve in numbers as visualized in Figure 6.
4 Design of the Fuel cell powered MP3 player
Now that the physical boundaries and the power characteristics of the product are known a design has
to be made to verify if a fuel cell system is feasible. The goal of this design exercise is to test the
feasibility of a fuel-cell power-system which fits into the volume of an existing battery compartment
and fulfills the performance need of an intensive user. The fuel cell system should be as small, have
an energy density which equals or exceeds that of a standard lithium-ion rechargeable battery, and is
made out of commercially available components. The following requirements are the main drivers for
this design:
- The power-system plus the fuel tank must fit in the battery compartment of the Samsung YP-5Z
MP3 player (66x33x4mm) and weighs less than 21g.
- the system peak power has to be at least 868mW, maximum of 900mW
- The power-system should work for an intensive user, requiring a user profile equal to that of
Figure 6, for at least 2 hours or 30 cycles.
- The runtime of the power system should equal or exceed that of the existing lithium-polymer
battery (17h for intensive user, 46,5h maximum).
- The energy available for an intensive user should be equal to 3,1Wh.
- The power and energy density of the system should be equal or exceed 100W L-1 and 348Wh L-1.
- The power system module should be easy to assemble and disassemble
4.1 Fuel cell model
The theoretical reversible open cell voltage (E) can be calculated and is for methanol fueled fuel cells
equal to 1,206V. In practice this value will never be reached and the practical open cell voltage (VOC)
is used more often. The value of the open cell voltage is not constant but depends on the working
temperature, the methanol concentration, cathode loading and other parameters. A multiple regression
analysis is executed taking 47 measured points from 3 different DMFC cases [5-7]. This analysis
resulted in the following function describing the open cell voltage (in mV) as a function of
temperature (in K), methanol concentration (in mol dm-3), and cathode loading (in mg cm-2):
VOC = 457 + 1,58 ⋅ T − 10,8 ⋅ N + 18, 6 ⋅ mcath (2)
Other parameters, like active surface area, fuel flow, cathode anode loading, and air flow, have been
evaluated and have no significant influence on the open cell voltage.The practical working voltage V can be described as the open cell voltage minus the Ohmic losses
∆VΩ, the activation losses ∆Vact, the crossover and internal currents ∆Vcross, and the mass
transportation and concentration losses ∆Vmass, which can be modeled as [8]:
V = VOC − ∆VΩ − ∆ (Vact + Vcross ) − ∆Vmass or:
V = VOC − i ⋅ r − A ⋅ ln ( i + ic ) + m ⋅ exp ( n ⋅ i ) (3)
Where:
i current density variable in mA cm-2
r Area Specific Resistance [9] 0,19kΩ cm2 at 120° C
ic crossover current density ~ 0,25i
A
combined slope of the Tafel line for the anode
and cathode
A= ( 2RTα F )a + ( 2RTα F )c
m Mass-transfer overvoltage constants (based on the 2,11E-2 mV
n Ballard PEMFC [8]) 4,00E-2 cm2 mA-1
αa charge transfer coefficient at the anode [10] 0,239
αc charge transfer coefficient at the cathode [10] 0,875
F Faraday’s constant 96,485 C mol-1
R Molar gas constant 8,314 J K-1 mol-1
The practical V-i curve is shown in Figure 8. With the fuel-cell model described above the size for the
different components can now be set up. This will be described in detail in the following paragraph.
500 50 gaseous flow
p
fluid flow
Load
450 45
electric flow
accumulator
400 40 information flow µC
3,8V
sensors (flow, + -
m
methanol, power Boost
350 35 (Vi), temperature) converter
on/off
Power (mW/cm2)
+ -
300 30 p
Voltage (mV)
Fuel Tank
CH3OH
Methanol feed Clean Air
250 25 Mixing or O2
cathode
chamber m f
anode
H2O (1M)
Water feed fuel mix f
200 20
150 15
fuel mix H2O
+ +
100 10 CO2 Air
H2O condns. Air filter
CO2 filter H2O condns. H2O
50 5 Humidifyer
fuel mix Heat exch.
0 0 CO2 Air
0 50 100 150 200 250
current density (m A/cm 2) CO2 venting Air
Figure 8: V-i characteristics used in the fuel cell model at Figure 9: functional overview of all components in the
T=298K, mcathode=2mg cm-2 and N=1 mol dm-3 (~4%v/v). DMFC system.
4.2 System design
In Figure 9 an overview is given of all components, mass flows and the interconnections. An
intermediate accumulator is needed to take care of peak-power load which probably results in a
decrease of the fuel cell volume, weight and cost. In the following paragraphs the main components
will be discussed and sized. The physical properties of fuel cell are based on the model as described inprevious paragraph. The physical properties of all other components like the pumps and tank are
based on a mass-flow and fuel cell performance model as described by Larminie [8].
In our case the system is a parallel/series hybrid. The fuel cell delivers a constant power output. The
battery is charged when the load is low and delivers power when peak power is needed. In this case
the fuel cell can be sized based on mean power instead of maximum power output.
4.3 Sizing of the fuel-cell flat-pack
The requirement for the fuel cell is a repetitive load-profile as described in Figure 6. The mean output
power of the fuel cell should deliver is at least 150mW. Taking charge efficiency, overall Ohmic
losses (~90%) and power using auxiliaries (-10%) into account the power output of the fuel cell
should be around 185mW. The basic volume requirement and specifically the maximum thickness of
the power system results in a flat pack architecture of the cells. The number of cells needed is at least
three, to acquire a workable voltage of 0,7-1V. Higher number of cells probably will increase costs
and surface area. The fuel cell output voltage will be boosted to a working voltage of 3,8V. In Table 4
an overview is given of the general specifics of the fuel-cells flat-pack needed to fulfill the load.
Every fuel cell membrane is placed in between two endplates made out of injection-molded carbon-
filled polymers (see Figure 10d). The mass flows needed to fulfill to the output power can be found in
Table 5.
Fuel cell membrane Nafion117
Cathode loading mc 2 mg cm-2
Anode loading ma 4 mg cm-2
Active surface area A 3x 14x14mm2
End plates 6 plates 22x22x1,5mm3
Number of cells 3
Nominal output voltage V 0,76V
Open Cell voltage VOC 1,58V
Nominal current density i 125mA cm-2
Cell end temperature T 302K
Methanol concentration N 1 Mol L-1
Fuel cell efficiency 21%
Table 4: General specifics of the fuel-cell flat-pack calculated to deliver a constant power of 185mW.
Anode IN Anode OUT
Total CH3OH 31 µL min -1
CH3OH 28 µL min-1
Total H2O 783 µL min-1 H2O 766 µL min-1
CO2 1679 µL min-1
Cathode IN Cathode OUT
Air flow 26,8 mL min-1 CH3OH x-over 0,6 µL min-1
of which O2 flow 5,07 mL min-1 Air flow 24,0 mL min-1
of which O2 flow 2,54 mL min-1
H2O fluid 4 µL min-1
H2O vapor 1 µL min-1
H2O osmotic 16 µL min-1
Table 5: Calculated in- and outgoing mass flows in the fuel-cell power-system.c) tanks
b) accumulators
e) PCB
a) pumps
d) fuel cell
Figure 10: Overview of the size for the main components From left to right: a) available pumps, b) available
intermediate accumulators, c) the water and methanol tanks, d) the final fuel-cell design, and e) the PCB.
4.4 Sizing the intermediate accumulator
The list of requirements demanded that the power-system should be able to follow the load profile as
described in Figure 6. In the first 10 and the following 60 seconds of this load curve the power needed
will be realized by the fuel cell (150mW) plus power from the added accumulator (171mW). The
following 30 seconds will be powered by the fuel cell (150mW) and the battery (80mW). In the final 3
minutes the fuel cell will power the MP3 player on its own (99mW), and the remainder power
(51mW) will charge the battery to its nominal capacity (80-100% SOC). The minimum capacity of the
battery needed to fulfill the load of this 4 minute song is approximately 2,6mWh. During the 30
seconds startup the system uses 700mW. To deal with the this load a minimum of 6mWh is needed.
Options to accumulate this amount of energy are a Nickel Metal Hydrate (NiMH) button-cell, a
lithium rechargeable button cell, or a capacitor (see Figure 10b). Five important factors will influence
the choice: the technical lifespan, the ability to charge and discharge at high currents (C), the working
voltage, the available capacity and its volume. Both the Lion as the NiMH battery have a short life-
span when discharged to 0-10%SOC. To increase life-span the batteries should be discharged to
90%SOC, resulting in a minimum capacity of 26mWh for both the batteries. Lithium based button-
cells are mostly Lithium Vanadium or Aluminum-Manganese batteries working at a voltage of 3V.
The rated (dis)charge rates (16,7mL of water is dragged through too the cathode during one take. If this water is not recycled a
water tank of at least 18mL is needed. If the water is fully or partially recycled the water tank will take
up less space. To decrease volume we assume water will be recycled as much as possible. The tanks
are made of flexible plastics which is blow-molded in its final shape (Figure 10c).
4.6 Fuel and air pumps
Fuel is introduced into the fuel cell by a pump. The flow rate of the fuel mixture is approximately
0,82mL min-1 (Table 5). Three micro pumps found comply with this requirement, the HNP mzr®-
2521 micro annular gear pump [12], the ThinXXS MDP1304 piezo actuated micro diaphragm pump
[13] and the Bartels Mikrotechnik MP5 piezo actuated micro diaphragm pump [14]. Both the HNP
and ThinXXS pumps are quite bulky compared to the Bartels MP5 (see Figure 10a). The MP5
complies with the required low thickness of 4mm. Further specifics of this pump can be found in
Table 6.
Air supply to the fuel cell can be done passively, semi-active by means of a blower or active by means
of an air pump. To decrease volume and add more control to the cells performance an active air pump
is chosen. One Bartels MP5 pump can only power an air flow of 15mL min-1. To comply with
minimum of 26,8mL min-1 air flow required, two MP5 pumps are needed. For this design two pumps
are linked in parallel.
4.7 Other components
The largest components have been defined above. Other smaller components needed to make the
system work are a methanol sensor, water recycle system and a water-methanol mixer (e.g. from
ISSYS [15]). Furthermore some temperature and flow sensors could be added to improve the
performance of the fuel cell system. The processor used in the MP3 player could be used to control
the system. We assume this is possible in this design.
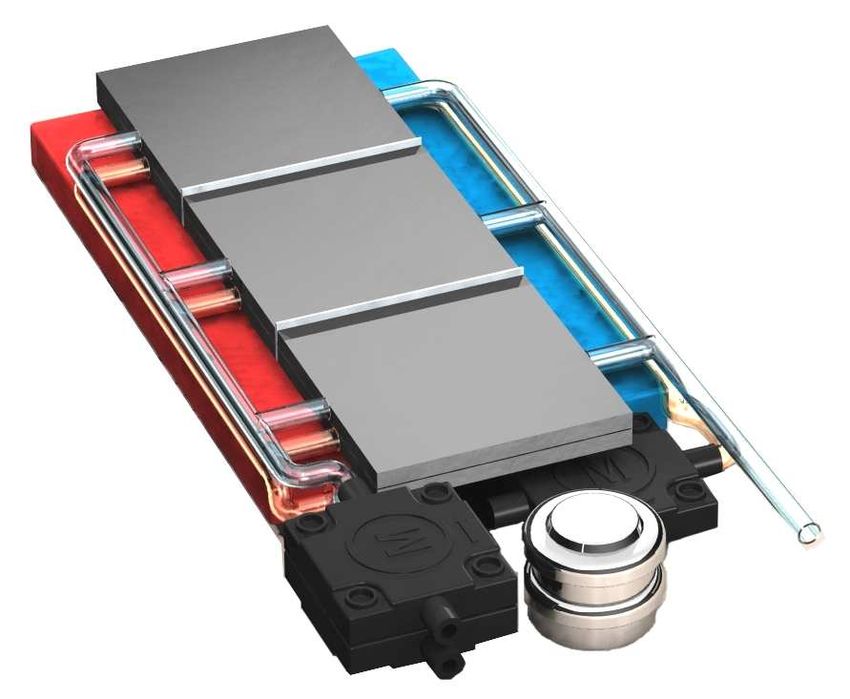
4.8 Final design of the power system in the MP3 player
The specifications of the main components are summarized in Table 6. To get more insight in the size
of all components they are drawn in CAD. Different structural variants have been evaluated and the
final assembly is shown in Figure 11. Electronic interconnections haven’t been modeled.
Component Type specs. volume
Fuel cell membrane Nafion 117 3 x 14 x 14 mm2
Capacitor Varta V40HR NiMH 2x 1,2V; 20mAh Ø11,5 x 5,4 mm3
Methanol tank Blow molded 3,1Wh; ~4mL; 4000 mm3
Water tank t=0,5mm 4000 mm3
Fuel pump Bartels MP5 50 µl/min - 5 ml/min 14 x 14 x 3,5 mm3
Air pump Bartels MP5 50 µl/min -15 ml/min 2 x 14 x 14 x 3,5 mm3
Table 6: Specifications of the main components used in the fuel cell power system.Figure 11: The fuel-cell power-system assembly.
5 Conclusions and discussion
A design of a 128mW fuel cell power system is designed. This fuel cell hybrid system can power a
flash-drive MP3 player. The model of the power system shows the system can fit into the space
available in the Samsung MP3 player. The power systems size is 35x86x8,1mm3 (24,4mL) and the
total volume of all main components is equal to 16,3mL. The volume breakdown of the system
without empty space is shown in Figure 12. The system doesn’t fit in the compartment available for
the battery, but uses up other empty space available in the MP3 player.
water methanol
mixer
1%
varta v40hr Air and fuel
5% pumps
Tubing 11%
6%
Methanol tank Fuel cells
25% 27%
Water tank
25%
Figure 12: Volume breakdown of the fuel-cell power-system at a total volume of 16,3mL (excl. empty space).The list of requirements stated that the total volume should not exceed 8,7mL, at equal specifics. The
total amount of energy the designed power system delivers is equal to that of the used battery,
resulting in a power density of a third of the lithium polymer battery used (Table 7). The energy
density of the system can be increased by the following design changes:
- Reducing empty space in the power system can increase the energy density to 190 Wh L-1 an
improvement of 50%. System architecture is a major contributor to improving the energy density.
- The fuel cells efficiency is still very low (21%). Improvements in membrane efficiency can
improve the total energy density. An efficiency increase of 5% will decrease the amount of
methanol and water needed with 20%. Furthermore the cells active area can be decreased to
12,5x12,5cm2 per cell. These improvements can result in an overall energy-density improvement
of 10-12%.
- Because of osmotic drag a large amount of water is drawn through the membrane. When this
water and the water produced can be fully recycled the water tank can be halved in size. This
option will result in a energy density improvement of 8-9%;
- The pumps needed to drive the different mass flows are still very bulky. The methanol pump is
over dimensioned and smaller pumps or pumps integrated in the PCB can increase the overall
energy density largely. If the DMFC pump is halved in size an overall energy density
improvement of 5% is achievable.
- Increase of the amount of fuel (methanol) would increase the energy density severely. In this
configuration the energy density of only methanol is approximately 1000Wh L-1. By increasing
the amount of fuel with a factor two results in an overall energy density equal to the lithium
battery.
Lithium polymer DMFC power
battery system
Volume 8,7mL 24,4mL
Component volume 16,3mL
Energy density 348 Wh L-1 127 Wh L-1
Peak power density 103 W L-1 37 W L-1
Table 7: Comparison between the lithium polymer battery used and the designed power system.
Besides the energy density the power density is of great importance. The power density of the battery
is near 100W L-1, and the designed DMFC only reaches a peak power density of only 55 W L-1. The
improvements presented above would also increase power density.
Other problems not treated in this paper are usability and produceability. When the MP3 player is in
use the fuel cells extracts oxygen from the outer room. If the player is worn inside a pocket the fuel
cell can not ‘breathe’ anymore and the power output will decrease. A total redesign of portable music
players is recommended when fuel cells are introduced. Furthermore the costs of the system designed
above will be very large compared to the simple and low-priced lithium ion batteries. Integrating
components, for instance in the PCB by means of MEMS technology is greatly recommended.
6 Acknowledgement
The author would like to thank Maarten Kamphuis for making the CAD model and the final
renderings of the fuel-cell power-system. Furthermore special thanks to my colleague Ruben Strijk for
support in the fuel cell model and calculations.7 Literature
[1] M. Ryynanen and S. Tasa, "Optimized Energy for Future Mobile Multimedia Devices," Nokia
010805 Sara Tasa: 2005.
[2] M. Broussely and G. Archdale, "Li-ion batteries and portable power source prospects for the
next 5-10 years," Journal of Power Sources, vol. 136, no. 2, pp. 386-394, Oct.2004.
[3] S. F. J. Flipsen, "Power sources compared: the ultimate truth?," Journal of Power Sources,
Apr.2005.
[4] J. Bostaph, C. Xie, J. Pavio, A. Fisher, B. Mylan, and J. Hallmark, "1 W Direct Methanol Fuel
Cell System as a desktop charger," 2003.
[5] A. K. Shukla, C. L. Jackson, K. Scott, and R. K. Raman, "An improved-performance liquid-
feed solid-polymer-electrolyte direct methanol fuel cell operating at near-ambient conditions,"
Electrochimica Acta, vol. 47, no. 21, pp. 3401-3407, Aug.2002.
[6] N. Nakagawa and Y. Xiu, "Performance of a direct methanol fuel cell operated at atmospheric
pressure," Journal of Power Sources, vol. 118, no. 1-2, pp. 248-255, May2003.
[7] k. Okajima, M. Suetaka, K. Furukawa, and M. Sudoh, "Evaluation of Liquid-feed direct
methanol fuel cell at near-ambient temperature for mobile applications," Electrochemistry, vol.
70, no. 12, pp. 928-930, Sept.2002.
[8] J. Larminie and A. Dicks, Fuel cell systems explained, 2nd ed ed. Chichester: Wiley, 2003, p. -
406.
[9] V. Ramani, H. R. Kunz, and J. M. Fenton, "Effect of particle size reduction on the
conductivity of Nafion[trademark]/phosphotungstic acid composite membranes," Journal of
Membrane Science, vol. In Press, Corrected Proof.
[10] Z. H. Wang and C. Y. Wang, "Mathematical Modeling of Liquid-Feed Direct Methanol Fuel
Cells," Journal of The Electrochemical Society, vol. 150, no. 4, p. A508-A519, Apr.2003.
[11] Varta Microbattery GmbH, "Varta V40H, rechargeable Ni-MH button, data sheet," 2005.
[12] HNP Mikrosysteme GmbH, "Micro annular gear pump mzr®-2521, Dosing pump for
analytical instrumentation," 2006.
[13] ThinXXS GmbH, "MDP1304 micro diaphragm pump," 2006.
[14] Bartels Mikrotechnik GmbH, "The Micropump – A New Heartbeat in Microfluidics," 2006.
[15] D. Sparks, C. Laroche, N. Tran, D. Goetzinger, N. Najafi, K. Kawaguchi, and M. Yasuda, "A
New Methanol Concentration Microsensor for Improved DMFC Performance," in Fuel Cell
Summit 2005 Connecticut, USA: Society of Manufacturing Engineers, 2005.You can also read