Bright Line Eating : A Two-year Follow-up Evaluation of a Commercial Telehealth Weight Loss Program within an Abstinence-Based Food Addiction ...
←
→
Page content transcription
If your browser does not render page correctly, please read the page content below
trition & W
Nu e
of
igh
Journal
Journal of Nutrition & Weight Loss
t Loss
Review Article
Bright Line Eating : A Two-year Follow-up Evaluation of a Commercial
Telehealth Weight Loss Program within an Abstinence-Based Food
Addiction Framework
Susan Peirce Thompson1, Andrew Kurt Thaw2*, Mark G Goetting3, Win Guan4
PhD, University of Rochester, USA; 2PhD, Department of Psychology and Neuroscience, Director of Pre-Health at Millsaps College,
1
USA; 3Departments of Pediatric and Adolescent Medicine and Medicine, Western Michigan University School of Medicine, USA; 4PhD,
Unaffiliated
ABSTRACT
Objective: The current study evaluates two-year weight outcomes for participants of the Bright Line Eating: Boot
Camp program (BLE:BC), a weight management program that teaches participants to abstain from sugar and flour
within a food addiction framework.
Methods: Data come from participants in the BLE:BC Follow-up Research Program. Participants were invited
to complete monthly follow-up surveys. First, we examined primary outcomes of percent weight loss (%WL) and
change in body mass index (BMI) for participants who completed both the BLE:BC program and at least one follow-
up survey. Next, we examined %WL and BMI change only among participants who completed all surveys.
Results: An independent samples analysis showed that, at the time of each follow-up survey (6, 12, 18, and 24
months), participants reported clinically significant weight loss (>5%WL) from baseline. Weight loss at each follow-
up was significantly greater than at the end of the BLE:BC program (>7.9%WL). Among participants who completed
all surveys (n=238), weight loss was higher among participants enrolled in the Bright Lifers continuity program at
12, 18, and 24 months. At the 24-month follow-up, participants enrolled in the Bright Lifers program experienced
an average 15.3%WL and a 5.0 reduction in BMI.
Conclusion: A rigorous evaluation of the efficacy of commercial weight loss programs remains imperative. As
research on the construct of food addiction in humans’ increases, evaluating treatment approaches becomes
increasingly important. Although the generalizability of the current study is limited due to selection bias and sample
homogeneity, this study contributes significant findings to the literature showing sustained, long-term weight loss
among participants in the BLE:BC program.
Keywords: Obesity; Body weight; Overweight; Weight loss; Body mass index; Weight management; Food addiction;
Abstinence; Telehealth; Bright line eating
INTRODUCTION obesity and greater risk of hospitalization, mechanical ventilation,
and mortality [3].
According to the 2017-18 National Health and Nutrition
Examination Survey, more than two in five American adults Research shows that behavioral interventions can produce weight
(42.4%) suffer from obesity (body mass index ≥ 30). Because obesity loss of 8-10 percent of initial weight (%WL) within 6 months [4].
is associated with increased mortality risk [1] and is comorbid with However, those who lose weight often regain much of it within
such diseases as type 2 diabetes, hypertension, and heart disease [2], a year [5]. In-person interventions have been shown to be more
the high obesity rate in the United States represents a significant effective than web-based interventions for weight loss, but the latter
public health concern. This is especially important during the novel are significantly more effective in slowing weight regain, because
coronavirus (COVID-19) pandemic, given the association between of the ongoing support that these programs can provide [5]. As
Correspondence to: Andrew Kurt Thaw, PhD, Department of Psychology and Neuroscience, Director of Pre-Health at Millsaps College, USA, Tel:
5049823237; E-mail: thawak@millsaps.edu
Received: March 05, 2021; Accepted: May 18, 2021; Published: May 25, 2021
Citation: Thompson SP, Thaw AK, Goetting MG, Guan W (2021) Bright Line Eating: A Two-year Follow-up Evaluation of a Commercial Telehealth
Weight Loss Program within an Abstinence-Based Food Addiction Framework. J Nutr Weight Loss. 6:3. 125
Copyright: © 2021 Thompson SP, et al. This is an open-access article distributed under the terms of the Creative Commons Attribution License, which
permits unrestricted use, distribution, and reproduction in any medium, provided the original author and source are credited.
J Nutr Weight Loss, Vol. 6 Iss. 3 No: 125 1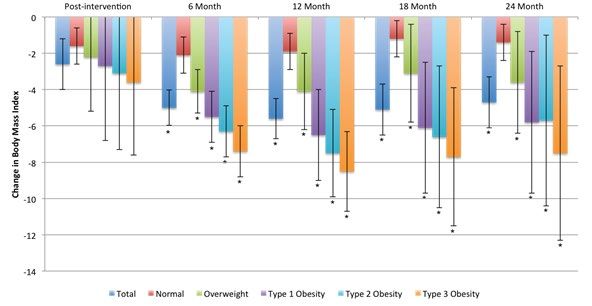
Thompson SP, et al.

a result, web-based approaches have become popular components                confirmed the research did/does not require review because it is
within clinical interventions, and as a result, commercial weight            not considered a clinical investigation as defined by the FDA and
loss programs. This is significant given that commercial weight              the dataset utilized did not include identifiable private information
loss programs represent a $3.7 billion industry that is expected to          Criteria for inclusion in the current study were that individuals
experience an annual 6% growth rate [6].                                     must have completed a BLE:BC prior to June 1, 2017, completed
However, as shown in two systematic reviews [7,8] of intervention            the pre- and post-intervention surveys, and enrolled in the BLE:BC
designs and outcomes of commercial weight loss programs, studies             Follow-up Research Program.
evaluating weight loss success produce inconsistent results given            The current study uses data from the pre- and post-intervention
the variation in program design, intensity, and the inclusion of             surveys and the 6-month, 12-month, 18-month, and 24-month
various nutrition and/or physical activity components. Moreover,             follow-up surveys. Participants were excluded if data were missing
these studies focus largely on short-term weight loss, creating a need
                                                                             or if they represented outliers (z-score > ±3) for the primary
for studies of long-term outcomes [9-11]. To address this gap, the
                                                                             outcome measures. As shown in Figure 1, among those who
present study examines two-year weight loss results of individuals
                                                                             completed the BLE:BC pre- and post-intervention surveys and
participating in the Bright-Line Eating: Boot Camp (BLE:BC)
                                                                             subsequently enrolled in the BLE:BC Follow-up Research Program
program, an 8-week commercial weight loss intervention based on
                                                                             (n=905), 75.8% (686) completed the 6-month follow-up, 56.4%
a food addiction framework.
                                                                             (510) completed the 12-month follow-up, 42.4% (384) completed
LITERATURE REVIEW                                                            the 18-month follow-up, and 32.5% (294) completed the 24-month
                                                                             follow-up. Figure 2 shows the step-wise exclusion of participants
This study builds on a prior evaluation of the BLE:BC program                from the pre-intervention survey, leading to the restricted sample—
that showed significant weight loss results among participants               individuals who completed all seven surveys (n=238).
immediately post-intervention [12].

Bright line eating
Bright Line Eating is grounded in a food addiction framework. The
scientific literature offers little research on the efficacy of non-profit
12-Step programs, such as Overeaters Anonymous, that advocate
an abstinence-based food plan [13]. Bright Line Eating is the first
widespread commercial program grounded in a food addiction
framework. Participants are educated about the neuroscientific
evidence that overeating can be an addiction and about the overlap
between drug addiction and processed food addiction [14,15]. As
a weight loss, weight management, and food addiction treatment
approach, the BLE program employs an abstinence model, similar
to quitting smoking, which promotes strict adherence to four
“Bright Lines”--behavioral boundaries that participants aim not
to cross under any circumstances. The first Bright Line involves
abstinence from added sugar or sweeteners of any kind (no sugar,             Figure 1: Consort table of each follow-up survey (Participants for Analysis 1).
honey, corn syrup, molasses, artificial sweeteners, etc.) and the
second involves abstinence from flour of any kind (white flour,
whole-grain flour, almond flour, coconut flour, etc.). The plan
encourages and builds into the food plan consumption of fructose
found in whole foods, such as fresh fruit. More information on
the structure of the BLE:BC program can be found elsewhere [12].

Participants
The current study evaluates weight loss outcomes among
individuals who completed a Bright Line Eating Boot Camp
(BLE:BC) and enrolled in the BLE:BC Follow-up Research
Program. All BLE:BC participants were invited to complete web-
based pre- and post-intervention surveys. Following completion
of the BLE:BC program, participants were also invited to join the
BLE:BC Follow-up Research Program, which consists of monthly
follow-up surveys to measure the process, outcome, and impact
of the BLE:BC program. Additionally, those who completed the
BLE:BC program could enroll in a continuity program called
Bright Lifers, which provides ongoing support through an online
community, online special interest groups, group coaching calls,
and continued education. All participants provided informed
consent and received a detailed protocol regarding data use,                 Figure 2: Consort table of completion among all surveys (Participants for
security, and management. Upon consultation with the IRB, we                 analysis 2).

J Nutr Weight Loss, Vol. 6 Iss. 3
                                5 No: 125
                                      126                                                                                                               2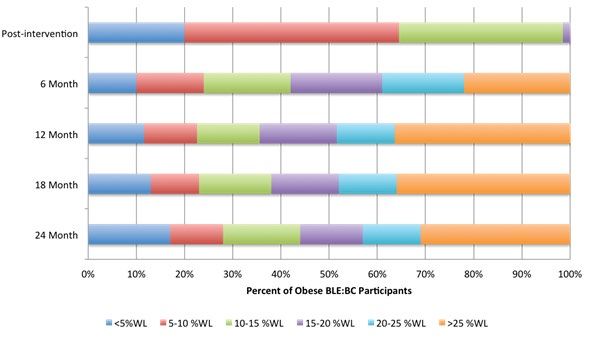
Thompson SP, et al.

Measures                                                                             of the study population at different time points, trend analyses
                                                                                     were not possible. The second analysis accounted for that fact
This study examines two primary outcome measures: weight loss                        by restricting the sample to only participants who participated in
and BMI change. We collected self-reported anthropometric data                       the post-intervention survey and all follow-up surveys; we refer to
in each survey. We calculated percent weight loss (%WL) as the                       this below as the restricted sample (Figure 2). This second analysis
percentage of pre-intervention weight that participants lost. To                     examined the trajectory of %WL and BMI change across all time
calculate body mass index, we used the standard formula (kg/                         points and variation by whether participants enrolled in the Bright
m2). We stratified the primary outcomes by baseline weight status                    Lifers continuity program.
(normal, overweight, type 1 obesity, type 2 obesity, and type 3
obesity). Additionally, we examined differences in weight loss and                   RESULTS
BMI change across follow-ups by whether the participant enrolled
in the Bright Lifers continuity program. We collected baseline                       Baseline characteristics of the total and restricted samples appear in
demographic information from the pre-intervention survey.                            Table 1. The majority of the total and restricted sample members are
                                                                                     female (94.3% and 91.7%, respectively) with an average age of 53.9
Analytic strategy                                                                    in the total sample and 52.2 in the restricted sample. Additionally,
                                                                                     the majority of the participants in both samples identify as white
Using STATA SE 12.0, we conducted the analysis in two parts.                         (91.8% and 95.5%, respectively). The average baseline BMI in both
First, we examined %WL and BMI change among participants                             samples (33.1 and 31.5, respectively) falls above the threshold for
who completed the pre-intervention survey and at least one follow-                   type 1 obesity.
up survey (sample sizes shown in Figure 1). That meant, then,
that participants who did not complete all follow-up surveys were                    Figure 3 presents the percent weight loss, stratified by baseline
included in that analysis. Because that created different samples                    weight status, for each follow-up survey. On average, participants
                                                                                     experienced 7.9%WL (SD=4.1) in the post-intervention survey

                                                       Table 1: Descriptive statistics (Pre-intervention).
                                                         Total Sample                                                   Restricted Sample
           Variables                                       (n=905)                                                           (n=238)
                                            Mean (%)                          SD                             Mean (%)                       SD
         Sex (Female)                        94.3%                             --                             91.7%                          --
              Age                             53.9                            10.6                             52.2                         13.2
         Race (White)                        91.8%                             --                             95.5%                          --
          Height (m)                          1.5                             .09                              1.6                          .08
          Weight (kg)                         87.4                            20.6                             86.7                         18.4
       Body Mass Index                        33.1                            7.6                              31.5                         6.5

Figure 3: Percent weight loss from baseline by weight status. This figure presents average percent weight loss (%WL) by baseline weight status. %WL is
calculated as the percentage of baseline weight that participants lost. An ANOVA test for each time-point was used to examine differences by baseline
weight status. ANOVA tests showed significant differences by baseline weight status at each time-point except post-intervention. Additionally, a means
comparison-t-test was used to examine statistical significance for each baseline weight status between average %WL at post-intervention and each follow-up
time-point. Statistical significance is denoted with an * for a p-value < .05. Error bars denote standard deviation. Sample size inclusion for each follow-up
time point is shown in Figure 1.

J Nutr Weight Loss, Vol. 6 Iss. 3 No: 125                                                                                                                3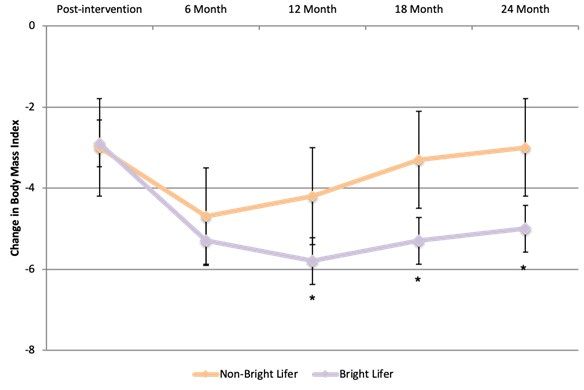
Thompson SP, et al.

following completion of the 8-week BLE:BC program. Among                        (to 37.2%, 35.9%, and 31.6%, respectively). However, the
those who completed each particular follow-up research survey,                  percentage of participants who experienced
Thompson SP, et al.
Figure 5: Change in body mass index from baseline by weight status. This figure presents average in body mass index (BMI) by baseline weight status.
ANOVA tests showed significant differences by baseline weight status at each time-point. Additionally, a means comparison t-test was used to examine
statistical significance for each baseline weight status between average change in BMI at post-invention and each follow-up time-point. Statistical significance
is denoted with an * for a p-value < .05. Error bars standard deviation. Sample size inclusion for each follow-up timepoint is shown in Figure 1.
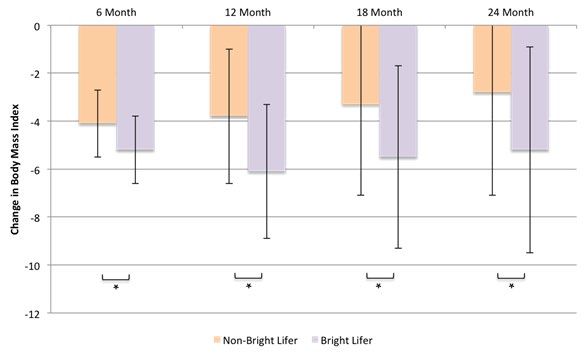
Figure 6: Percent weight loss by Bright Lifer enrolment. This figure compares percent weight loss (%WL) between participants enrolled and not enrolled in
the Bright Lifers Continuity program. A means comparison t-test was used to examine the difference in %WL between the two groups at each timepoint.
Statistical significance is denoted with an * for a p-value < .05. Error bars denote standard deviation. Sample size inclusion for each follow-up timepoint
is shown in Figure 1.
used the restricted sample (which included only participants who decrease at 6 months, 5.6 decrease at 12 months, then 5.1 decrease
completed the pre-intervention survey and all follow-up surveys). As at 18 months, and 4.7 decrease at 24 months.
stated previously and shown in Table 1, demographic characteristics
Figures 8 and 9 present %WL and BMI change in the restricted
of the restricted sample closely mirror the total sample. On average,
sample, stratified by Bright Lifers enrollment. Among the 238
participants in the restricted sample experienced 9.2%WL following
individuals included in the restricted sample, 188 enrolled in
the BLE:BC program. This increased to 16.1%WL at 6 months and
the Bright Lifers program. Repeated measures ANOVA was
17.4%WL at 12 months, then decreased slightly to 15.7%WL at 18
used to examine (a) whether there were any differences across all
months and 14.6%WL at 24 months. Similarly, participants saw an
time points and (b) if there was a significant difference between
average 2.9 decrease in BMI at the end of the BLE:BC program, 5.2
non-Bright Lifers and Bright Lifers at each time point. Results
J Nutr Weight Loss, Vol. 6 Iss. 3 No: 125 5
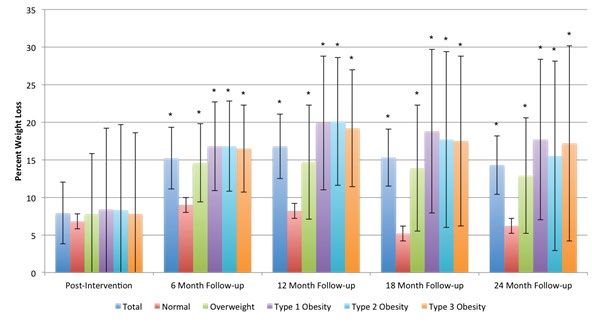
Thompson SP, et al.

Figure 7: Change in Body Mass Index by Bright Lifer Enrolment. This figure compare change in body mass index (BMI) between participants enrolled
and not enrolled in the Bright Lifer Continuity program. A means comparison t-test was used to examine statistical significance between average change in
BMI at post-intervention and each follow-up timepoint. Statistical significance is denoted with an * for p-value < .05. Error bars denote standard deviation.
Sample size inclusion for each follow-up timepoint is shown in Figure 1.

Figure 8: Percent Weight Loss by Bright Lifers Enrolment (Restricted sample; n=238). This figure shows percent weight loss (%WL) by Bright Lifers
enrolment among participants who completed the BLE:BC program and all follow-up surveys. Percent weight loss increased following post-intervention
and was maintained for 2 years. Error bars indicate 95% confidence interval.

show that the change across time for %WL was significant (F(4,                  changes in BMI across time for all participants (F(4, 233)=5.48,
233)=8.23, p
Thompson SP, et al.

Figure 9: Change in Body Mass Index by Bright Lifers Enrolment (Restricted sample; n=238). This Figure shows change in body mass index (BMI) by
Bright Lifers enrolment among participants who completed the BLE:BC program and all follow-up surveys. BMI decreased following post-intervention
and was maintained for 2 years. Error bars indicate 95% confidence interval.

DISCUSSION                                                                Second, the results expand the literature on commercial weight loss
                                                                          programs. Numerous publications document the results of clinical
This study evaluated long-term weight loss and BMI change among           and observational studies of weight loss interventions. However,
participants in the BLE:BC program. The results support the               surprisingly and unfortunately, commercial programs remain
efficacy of the BLE:BC for long-term weight loss and weight loss          understudied. Given the extensive market for commercial weight
maintenance. Study participants in the total and restricted samples
                                                                          loss programs and the number of individuals whom these programs
reported, on average, well beyond clinically-significant weight loss
                                                                          affect, it remains critically important for researchers to fill this gap
(>5%WL) at all time points. Additionally, participants who enrolled
                                                                          in the literature.
in the Bright Lifers continuity program following completion of the
BLE:BC program experienced significantly greater weight loss and          Third, the results of this study showed greater efficacy of the
BMI reduction at 6 months, and at every subsequent time point,            BLE:BC program among individuals who began the program with
than those who opted not to receive ongoing support.                      higher baseline weight status, which suggests a possible treatment
Results of this evaluation study carry important implications for         avenue for individuals with obesity, especially those who don’t
research on commercial telehealth weight loss programs, food              qualify for bariatric surgery.
addiction and abstinence-based treatment, and the Bright Line             Fourth, these results occurred within a food addiction framework,
Eating program. First, no prior study of a commercial telehealth
                                                                          among participants guided to abstain completely from all sugar
weight loss program has shown positive results of long-term weight
                                                                          and flour. Abstinence-based approaches to weight loss and food
loss and weight loss maintenance of this magnitude. For instance,
                                                                          addiction treatment are rare and have not yet been studied
prior evaluations found an average of 0.9%WL at 16 weeks and
                                                                          scientifically [13]. These results encourage further research on the
1.1%WL at 1 year for the eDiets.com program [9], 2.3%WL for
the Biggest Loser Club at 12 weeks, and 3.3%WL for an enhanced            efficacy of abstinence-based interventions within a food addiction
version of the Biggest Loser Club [10]. Additionally, studies             framework.
examining change in body mass index (BMI) found that BMI                  Finally, obesity continues to carry significant public health
decreased by 1.2, on average, among participants in the Lose It!          implications, as it has been routinely shown to be associated with
application at 6 months [11]; by an average of 0.7 for the basic          several leading causes of mortality including heart disease, cancer,
version of the Biggest Loser Club at 12 weeks; and by an average of       and diabetes [1,2]. Moreover, as countries across the globe manage
1.0 for the enhanced version of the Biggest Loser Club at 12 weeks
                                                                          the impact of the COVID-19 pandemic, persons with obesity--
[10]. In contrast, the current study of the BLE:BC program found
                                                                          particularly severe obesity--have been disproportionately affected.
an average of 7.9%WL and 2.6 reduction in BMI immediately
                                                                          As a result, it is paramount to evaluate weight loss programs and
following the 8-week program and, on average, none of that weight
was regained. Rather, participants continued losing weight after          assess novel methods for encouraging weight loss and weight
the Boot Camp and at the end of two years, sustained an average           management. It’s especially important to rigorously evaluate
14.3% WL and 4.7 reduction in BMI, nearly three times the                 commercial weight loss programs, given the fact that they constitute
accepted indicator for clinically significant weight loss.                a $3.7 billion industry.

J Nutr Weight Loss, Vol. 6 Iss. 3 No: 125                                                                                                      7
Thompson SP, et al.
LIMITATIONS mass index categories: A systematic review and meta-analysis. Jama.
2013;309(1):71-82.
Although the results of this evaluation show significant, positive 2. Khaodhiar L, McCowen KC, Blackburn GL. Obesity and its comorbid
weight-loss outcomes for the BLE:BC program, we acknowledge conditions. Clin Cornerstone. 1999;2(3):17-31.
several limitations. First, survey participation was entirely voluntary,
3. Dietz W, Santos-Burgoa C. Obesity and its Implications for COVID-19
introducing selection bias. Specifically, individuals who lost more
Mortality. Obesity. 2020;28(6):1005-1005.
weight and/or who were more motivated to lose weight may have
been more likely to complete follow-up surveys and to continue 4. Jensen MD, Ryan DH, Apovian CM, Ard JD, Comuzzie AG, Donato
KA, et al. AHA/ACC/TOS guideline for the management of
participation in the BLE:BC research program. However, rates of
overweight and obesity in adults: a report of the American College
attrition in this sample, as shown in Figures 1 and 2, mirror that of Cardiology/American Heart Association Task Force on Practice
of long-term observational studies for clinical weight loss programs Guidelines and The Obesity Society. J Am Coll Cardiol. 2014; 63(25
[15-17] and commercial weight loss programs [5,7]. Part B):2985-3023.
Second, the observational case series research design of this study 5. Sarwer DB, Green AVS, Vetter ML, Wadden TA. Behavior therapy
may introduce bias, because of the lack of a control group. Further for obesity: where are we now? Curr Opinion Endocrinol Diabetes
research is needed to control for this bias by rigorously evaluating Obesity. 2009;16(5):347-352.
the impact of the BLE:BC program against a comparison group. 6. https://www.marketresearch.com/Marketdata-Enterprises-Inc-v416/
Although an experimental randomized control trial is the gold Weight-Loss-Diet-Control-12225125/
standard of efficacy research, conducting a randomized control 7. Tsai AG, Wadden TA. Systematic review: An evaluation of major
trial for commercial weight loss programs is not often feasible. commercial weight loss programs in the United States. Ann Intern
Given that fact, results of observational case series designs are still Med. 2005;142(1):56-66.
necessary to assess the impact of commercial program designs on 8. Gudzune KA, Doshi RS, Mehta AK, Chaudhry ZW, Jacobs DK, Vakil
participant weight loss. RM, et al. Efficacy of commercial weight-loss programs: an updated
systematic review. Ann Intern Med. 2015;162(7):501-512.
Third, the homogeneity of the sample—which may occur in part
because of the cost of the BLE program—may produce sample 9. Womble LG, Wadden TA, McGuckin BG, Sargent SL, Rothman RA,
bias and limit the generalizability of results. In other words, Krauthamer-Ewing ES. A randomized controlled trial of a commercial
internet weight loss program. Obes Res. 2014;12(6):1011-1018.
although the BLE:BC program was shown to produce significant
weight loss for participants, the results may be generalizable only 10. Collins CE, Morgan PJ, Jones P, Fletcher K, Martin J, Aguiar EJ, et al.
to participants with the same demographic characteristics as this A 12-week commercial web-based weight-loss program for overweight
and obese adults: randomized controlled trial comparing basic versus
sample (e.g., female, white, high socioeconomic status). However,
enhanced features. JMIR. 2012;14(2):e57.
according to data on the U.S. weight loss market, the demographic
characteristics of this study sample do resemble the demographics 11. Allen JK, Stephens J, Dennison Himmelfarb CR, Stewart KJ, Hauck
S. Randomized controlled pilot study testing use of smartphone
of the broader population of commercial weight loss participants
technology for obesity treatment. J Obes. 2013;2013.
[18]. That increases confidence that the results of this study can
be generalized to the population that typically participates in 12. Guan W, Thaw A, Grondhuis SN, Schaechter A. Evaluation of a
commercial weight loss. Further research is needed to understand commercial telehealth weight loss and management program. J Nutr
Weight Loss. 2018;3(2):1-6.
whether these results hold for other demographic groups.
13. Ifland J, Marcus MT, Preuss HG. Processed food addiction:
CONCLUSION Foundations, assessment, and recovery. CRC Press, USA. 2017.
14. Brownell KD, Gold MS. Food and addiction: A comprehensive
As commercial telehealth weight loss programs proliferate, handbook. Oxford University Press, USA. 2012.
it becomes increasingly important to evaluate their efficacy
scientifically. This study demonstrates the food addiction recovery 15. Cottone P, Moore CF, Sabino V, Koob GF. Compulsive eating
behavior and food addiction: Emerging pathological constructs.
model can be highly effective in long-term weight management.
Academic Press, USA. 2019.
Bright Line Eating offers a stringent but simple program that can
produce substantial weight loss. In fact, it is the only commercial 16. Pirotta S, Joham A, Hochberg L, Moran L, Lim S, Hindle A, et al.
telehealth weight loss program that has been demonstrated Strategies to reduce attrition in weight loss interventions: A systematic
review and meta-analysis. Obesity Rev. 2019;20(10):1400-1412.
empirically to produce clinically significant weight loss, on average,
across time. Confirming the program’s efficacy as a sustainable 17. Moroshko I, Brennan L, O'Brien P. Predictors of dropout in weight
weight loss option will require further analyses of participants’ loss interventions: a systematic review of the literature. Obesity
long-term outcomes. Rev. 2011;12(11):912-934.
18. Infinium Global Research. Global Weight Management and Wellbeing
REFERENCES Products Market: Consumer Behavior Analysis by Countries, Buying
Pattern Analysis, Demographics, Trends Analysis, Survey Findings and
1. Flegal KM, Kit BK, Orpana H, Graubard BI. Association of all- Results, Leading Companies and Their Market Strategies. Infinium
cause mortality with overweight and obesity using standard body Global Research. 2020.
J Nutr Weight Loss, Vol. 6 Iss. 3 No: 125 8You can also read