AND JUICE BABY FOOD Baby Food and Juice Compendium
←
→
Page content transcription
If your browser does not render page correctly, please read the page content below
BABY FOOD
                                 AND JUICE

Baby Food and Juice Compendium
PerkinElmer Baby Food and Juice Compendium

a

        BABY FOOD
                             Table of Contents
                              Baby Food and Juices

        AND JUICE               Analysis of Baby Foods and Juices for Metals to Protect a
                                Sensitive Population .................................................................................. 3
                                Determination of Arsenic in Baby Foods and Fruit Juices by GFASS ............ 9

    2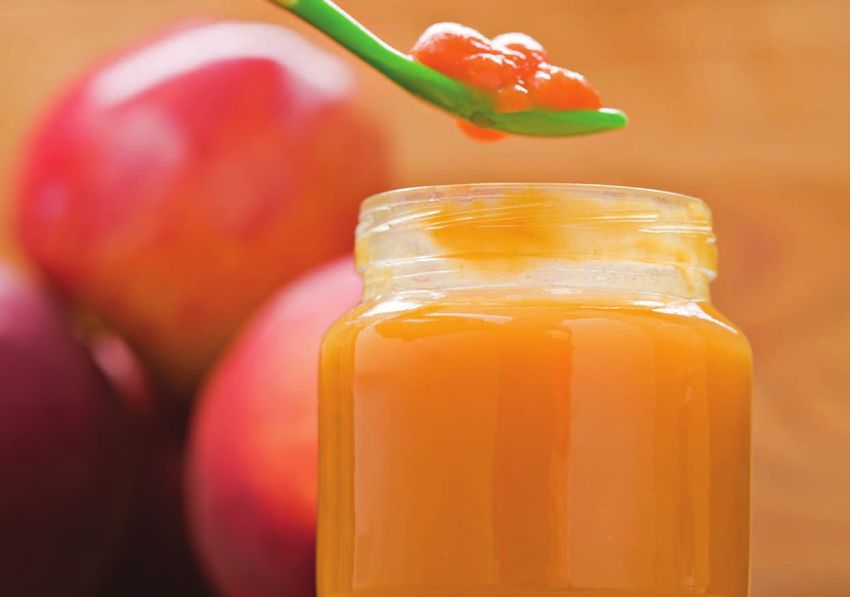
A P P L I C AT I O N N O T E

                                                                      Food Safety

                                                                      Authors
                                                                      Lee Davidowski, PhD
                                                                      Zoe Grosser, PhD
                                                                      Praveen Sarojam, PhD
                                                                      PerkinElmer, Inc.
                                                                      710 Bridgeport Avenue
                                                                      Shelton, CT USA

The Analysis of Baby                        Introduction
                                            Babies and small children are an especially sensitive
Foods and Juices for                        population to exposure to environmental contaminants.
                                            Their small mass and developing systems, including
Metals to Protect a                         brain development may show adverse health effects
                                            from even low levels of contamination on a chronic
Sensitive Population                        or single dose case. Foods, infant formula, milk, and
                                            water provide significant exposure routes for metal
                                            contaminants. The effect of lead exposure at low levels
     has been well established and levels below toxic have been shown to contribute to behavioral
     and learning issues1. Other elements, such as arsenic and cadmium can contribute to cancer,
     neurological effects and diseases.

     Although baby food and juice may contain metals from fruit grown in contaminated soil or
     introduced during the manufacturing process, there is very little guidance on levels considered
     to be safe. In the US, the Food and Drug Administration (FDA) has issued a guidance memo
     on lead in children’s candy lollipops for import, suggesting that lead content above 0.1 ppm
     (mg/kg) would provide an unacceptable risk to children who regularly consume sweets.2
     This is extrapolated to guidance for many food items. Canada has a specific tolerance level
     of 0.1 mg/kg (ppm) for arsenic and of 0.2 ppm for lead in ready-to-serve fruit juices, nectars,
     and beverages3. Europe has examined the problem more carefully and several elements are
     regulated in a variety of foodstuffs through Commission Regulation (EC) No 1881/2006.4
     Lead and cadmium are regulated at low levels in materials such as cereals, fruit, and
     vegetables, although not specifically baby food. Tin is regulated at 50 ppm specifically
     in canned baby food and infant formula.

                                                                                                       3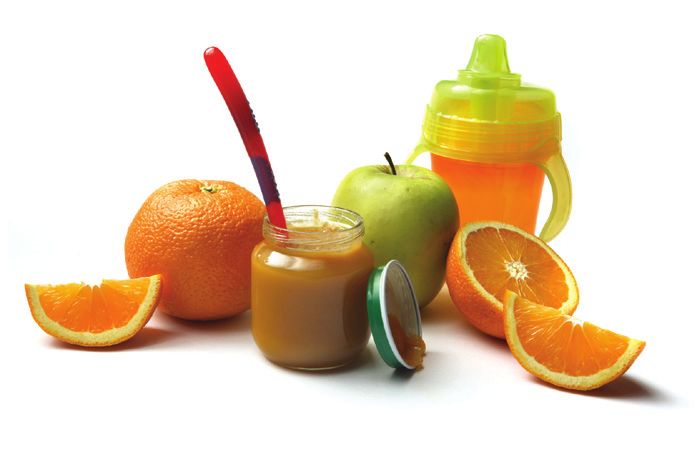
This work will describe measurements of a variety of toxic
                                                                            Table 2. Atomic Absorption Instrumental Conditions for Arsenic
     metals at low concentrations in fruit juices and fruit purees.         Determinations.
     Sample preparation and the effect on detection limits will be
     described. Graphite furnace atomic absorption (GFAA) and               Element                             Arsenic (As)

     inductively coupled plasma mass spectrometry (ICP-MS) will             Wavelength                          193.7 nm
     be compared and an overall approach to analysis described.
                                                                            Slit width                          0.7 nm

     Experimental                                                           Signal mode                         AA-BG Peak Area, 3 replicates
     Samples of a variety of fruit juices and fruit purees of different     Read time                           5 sec
     brands were purchased from a local supermarket. Two milliliters
                                                                            Delay time                          0 sec
     of juice or one gram of puree were taken in duplicate for
     digestion. Microwave digestion was used (Multiwave™ 3000,              BOC                                 2 sec
     PerkinElmer®, Inc. Shelton, CT USA) to obtain clear solutions.         Lamp and current                    Electrodeless Discharge Lamp, 380 mA
     Six mL of nitric and 0.5 mL of hydrochloric acid (GFS Chemical™,
     Columbus, OH USA) were added to PTFE vessels and the                   Autosampler                         AS800
                                                                             Sample volume                      24 µL
     digestion program shown in Table 1 applied. The digestate
                                                                             Matrix modifier volume             6 µL
     solutions were then transferred and diluted to 25 mL with
     ASTM Type I water. The samples were fairly homogeneous                 Matrix modifier                     0.018 mg Pd + 0.012 mg Mg(NO3)2
     and in a form that allowed a representative sample to be
                                                                            Calibration                         2.5, 5.0, and 10.0 µg/L
     easily taken. If the samples were solids, grinding, blending
     or other procedures might be necessary to ensure a more
     homogeneous sample to be measured. Preparing replicate                 Table 3. Graphite Furnace Temperature Program.
     samples will allow us to evaluate if our homogeneity
                                                                            Step      Temperature           Ramp Time               Hold Time   Argon Gas
     assumption is accurate.
                                                                            (˚C)      (sec)                 (sec)                   (mL/min)

     Minimal dilution of the sample was chosen to provide                   1*        120                   1                       30          250
     a more concentrated digestate solution so that a lower
                                                                            2         140                   5                       15          250
     concentration can be measured in the sample. In this case
     dilution factors of 12.5 and 25 were used for juice and                3         1100                  10                      15          250
     puree samples respectively. Dilution factors can be increased          4**       1900                  0                       5           0
     when a lower acid concentration in the extract is desired
     or a higher concentration is expected in the sample.                   5         2450                  1                       3           250

                                                                            * = Injection Temperature = 100 ˚C
       Table 1. Microwave Digestion Program.
                                                                            **= Atomization Step
       Step      Power       Ramp        Hold        Fan

       1         750         10:00       10:00       1                    Additional information on the GFAA methodology can be
                                                                          found in reference 5.
       2         1200        10:00       10:00       1

       3         0                       15:00       3
                                                                          The ELAN® DRC-e ICP-MS (PerkinElmer, Shelton, CT USA)
                                                                          was also used for measurement. The instrumental conditions
                                                                          are shown in Table 4.
     The AAnalyst™ 800 atomic absorption system (PerkinElmer, Inc.,
     Shelton, CT USA) was used for the graphite furnace measure-            Table 4. ICP-MS Instrumental Conditions.
     ments. The AAnalyst 800 uses a transversely heated stabilized
                                                                            Nebulizer                                    Quartz Concentric
     temperature platform system and Zeeman background correc-
     tion to ensure the minimum influence of matrix interferences           Spray chamber                                Quartz Cyclonic
     possible. The instrumental parameters and graphite furnace             RF power                                     1500 W
     heating program are shown in Tables 2 and 3.
                                                                            Integration time                             1000 ms (per analyte)

                                                                            Replicates                                   3

                                                                            Reaction gas for arsenic                     O2 = 0.6 mL/min

                                                                            RPq for arsenic as   91
                                                                                                      AsO                0.5

                                                                            Internal standard                            103
                                                                                                                               Rh

                                                                            Calibration                                  1.0 and 2.0 µg/L

42
The arsenic analysis employed dynamic reaction cell (DRC)
Table 5. GFAA Arsenic Results.
technology to move the arsenic ions using oxygen to mass
91, away from chloride interference at mass 75. Chloride Mean SD %
may be in the sample arising from natural chlorine content, Sample ID (mg/kg) (mg/kg) %RSD RPD Recovery
salt added to a food material or hydrochloric acid used in B Pear Juice 0.010 0.001 12 9.9 93.9
sample preparation, and can degrade the detection limit
G Pear Juice 0.015 0.0006 4.3 3.3 90.0
for arsenic. The DRC is an active additional quadrupole in
the ion path with a rejection parameter q (RPq) of 0.5 for B Grape Juice 0.027 0.002 8.2 0.7 85.0
this work. Detection limits are improved compared to other
B Apple Juice 0.012 0.001 7.8 3.4 92.6
approaches and the precision in varying matrices is more
consistent. An instrument detection limit for arsenic G Apple Juice 0.018 0.0003 1.6 4.7
measured in 1000 mg/L NaCl was shown to be 2.3 ng/L, B Apple/Cherry Juice 0.010 0.0008 7.5 23
comparing favorably to detection limits of 0.6-1.8 ng/L,
B Pear Puree 0.005 0.002 35 55 95.7
measured in 1% nitric acid solution, using this technique.6
G Pear Puree < 0.003
B Apple Sauce < 0.003
HP QC TM-A* 9.995 0.051
(µg/L) (µg/L) 0.51 99.9
High Purity Water Quality Control Standard = 10 ug/L As.
Spike 2.5 ppb
Table 6. ICP-MS Results (mg/kg)*.
Pb
AsO91 Cd111 Sn118 Sb121 Tl205 (sum)
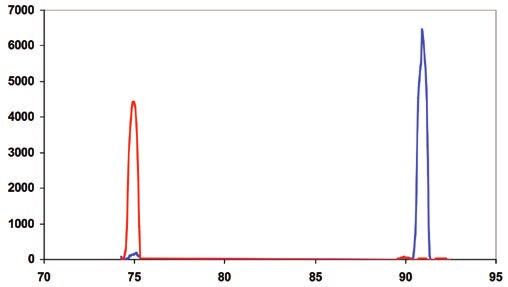
Figure 1. The Dynamic Reaction Cell (DRC ) operates in the PerkinElmer
™
B Pear Juice 0.009 0.002 0.064 0.001 0.001 0.014
ELAN ICP-MS to react and avoid interferences without allowing competing
reactions to add other interferences. Red = As+ signal at mass 75 with no oxygen G Pear Juice 0.014 0.001 < DL 0.001 0.0009 0.009
in reaction cell. Blue =As+ signal with oxygen in reaction cell showing formation
of AsO+ at mass 91. B Grape Juice 0.031 0.001 0.005 0.099 0.0004 0.016
B Apple Juice 0.010 0.0003 0.069 0.001 0.0005 0.016
Results and Discussion
G Apple Juice 0.018 0.0004 < DL < DL 0.0006 0.018
A variety of samples from two manufacturers were prepared B Apple/
in duplicate. Table 5 shows the results obtained using graphite Cherry Juice 0.008 < DL 0.058 0.0004 0.0006 0.006
furnace atomic absorption (GFAA) analysis for a single element, B Pear Puree 0.002 0.001 0.33 0.0001 0.001 0.003
arsenic. RPD is relative percent difference.
G Pear Puree 0.001 0.003 < DL < DL 0.001 0.003
The results show very low levels of arsenic measured in
B Apple Sauce < DL < DL 0.067 < DL 0.0004 0.003
the baby food and juice matrices. The standard deviations
are very low showing good agreement between the three * < DL means the result was less than the detection limit, listed in Table 8.
replicates measured on each sample. The relative percent A variety of elements are measured in the ICP-MS analysis, including toxic elements
differences (RPD) between the duplicate sample preparations as well as tin, which might be introduced through packaging. Comparison with the
show the material is homogeneous. Good agreement is gen- graphite furnace determination for arsenic is compared in the next table.
erally considered to be less than 20% RPD, so the measure-
ment in pear puree is likely due to the increase in variation
generally seen when measuring close to the detection limit.
The results using ICP-MS for measurement of the same
samples is shown in Table 6.
3
5
Table 7. Comparison of Arsenic Measurement by ICP-MS and                     Table 8. Detection Limits for ICP-MS and GFAA for this Method
        GFAA (mg/kg).                                                                (mg/kg).

                                 ICP-MS             GFAA                                                   ICP-MS             GFAA
        B Pear Juice             0.009              0.010
                                                                                     As                    0.001              0.003
        G Pear Juice             0.014              0.015
                                                                                     Cd111                 0.0002
        B Grape Juice            0.031              0.027
                                                                                     Sn118                 0.006
        B Apple Juice            0.010              0.012
                                                                                     Sb121                 0.0008
        G Apple Juice            0.018              0.018
                                                                                     Tl205                 0.0001
        B Apple/Cherry Juice     0.008              0.010
                                                                                     Pb(sum)               0.003
        B Pear Puree             0.002              0.005

        G Pear Puree             0.001              < 0.003                     Agreement between measurements obtained on the two
                                                                                techniques is excellent at these low concentrations.
        B Apple Sauce            < 0.001            < 0.003
                                                                                Detection limits were estimated for the two methods using
                                                                                the calculation 3 times the standard deviation of the blank,
                                                                                which was carried through the sample preparation procedure.

                                                                                The detection limits measured are well below the Canadian
                                                                                limits set for As (0.1 mg/kg) and Pb (0.2 mg/kg), ensuring
                                                                                confidence of measurements made near the compliance
                                                                                concentration.

                                                                                A variety of quality control checks, including spiking, analysis
                                                                                of a reference material and comparison of duplicate sample
                                                                                preparations were done to ensure that the developed ICP-MS
                                                                                method was adequate and under control during measurement
                                                                                of the samples. Table 9 shows agreement between duplicate
                                                                                samples for two juice types and a puree.

                                                                                The results are shown in mg/kg and show good agreement
                                                                                in most cases. As the results approach the detection limit it
                                                                                is more difficult to show good agreement.

        Table 9. Duplicate Agreement ICP-MS (mg/kg).

                        Pear-1      Pear-2    RPD           Grape-1   Grape-2   RPD       Pear Puree-1   Pear Puree-2   RPD

        AsO91           0.011       0.0085    21%           0.031     0.031     2%        0.0017         0.0015         14%

        Cd111           0.0016      0.0016    1%            0.00068   0.00069   1%        0.0014         0.0013         2%

        Sn118           0.067       0.061     10%           0.051     0.049     4%        0.35           0.31           10%

        Sb121           0.0014      0.00095   41%           99.9      97.7      2%        < DL           < DL           –

        Tl205           0.0010      0.0010    1%            0.0004    0.0004    6%        0.0014         0.0013         6%

        Pb(sum)         0.016       0.012     27%           0.016     0.015     6%        0.004          < DL           –

    4

6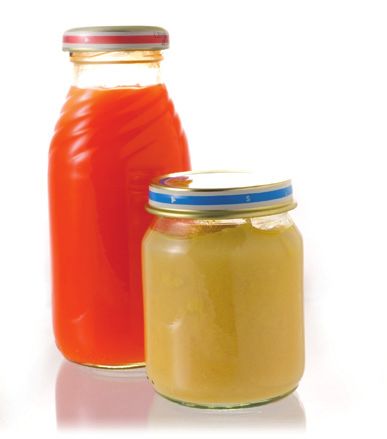
Table 10 shows post-digestion spike recoveries at 2 ppb in             Conclusions
solution. This represents a spike of 50 ppb in the original            Metals, including arsenic can be hazardous to health, especially
juices.                                                                that of a sensitive population, such as children. Therefore
  Table 10. ICP-MS % Spike Recoveries.                                 materials that provide significant exposure, such as food,
                                                                       should be closely monitored to ensure that concentrations
                 AsO91 Cd111      Sn118 Sb121        Tl205 Pb(sum)
                                                                       of elements that might be hazardous should be very low.
  B Pear Juice   104    90.3      97.7       83.4    103       103
                                                                       The results measured in this set of samples were very low
  B Grape Juice 104     84.4      99.6       104     119       108     and did not violate any of the current standards. Additional
  B Apple Juice 110     83.0      120        119     120       115     method quality checks were done to ensure both the GFAA
                                                                       and ICP-MS methods were capable at the concentration
  G Apple Juice 110     86.4      97.5       81.1    115       110
                                                                       levels of interest and under control during sample measurement.
  B Apple/
  Cherry Juice   100    83.4      101        80.1    118       113     Sample preparation should be matched to the analytical
                                                                       requirements and laboratory workload needs. A variety of
  B Pear Puree   95.8   82.1      106        79.2    102       106
                                                                       techniques can be used, but the measurement of lower con-
  G Pear Puree   95.3   87.1      99.8       81.1    100       101     centrations requires that a clean digestion be used so that
  B Apple Sauce 90.1    83.5      98.7       80.5    101       102     additional contamination is not introduced during this step
                                                                       in the analysis process. The amount taken for digestion and
                                                                       the dilution can be varied to accommodate sample homogeneity
The spikes were recovered within 20% of the spiked value,
                                                                       and concentration requirements.
showing excellent recovery.
                                                                       GFAA has detection limit capability well below the level of
A suitable mixed diet food reference material (CRM, High
                                                                       concern and provides an economical choice for smaller labo-
Purity, USA) was measured using the same ICP-MS method.
                                                                       ratories or those with a smaller workload. ICP-MS provides
The results are shown in Table 11. Unfortunately the suite of
                                                                       excellent detection limits and offers efficient multielement
certified metals only included two of the metals of interest here.
                                                                       capability for the detection of other hazardous elements in
  Table 11. Mixed Diet Reference Material (mg/kg).                     the same run, such as lead. As many countries move toward
                                                                       the regulation of additional elements in food materials the
             Concentration   SD         Certified Value    %Recovery
                                                                       list of elements to be measured may increase.
  AsO91      0.019           0.0002     0.020              96.7
                                                                       Based on the requirements of the laboratory, an appropriate
  Cd111      0.0084          0.0001     0.008              105
                                                                       technique can be chosen for regulations of today and
  Sn118      –               –          –                  –           to meet lower limits or additional elements that may be
  Sb121      –               –          –                  –
                                                                       required in the future

  Tl205      –               –          –                  –

  Pb(sum) 0.0001             0.0000     NV                 –

The certified values for arsenic
and cadmium showed excellent
recovery, further validating
the developed method-
ology was operating
properly for this
matrix and
representative
concentrations.

                                                                                                                                          5

                                                                                                                                              7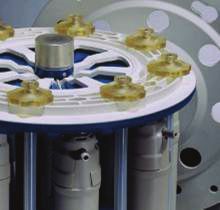
References
1. H.L. Needleman, A. Schell, D. Bellinger, A. Levinton,
   and E.N.Allred, N. England J. Med., 322, 83 (1990).

2. Guidance for lead in candy,
   http://www.cfsan.fda.gov/~dms/fsdup126.html

3. Department of Justice Canada,
   http://laws.justice.gc.ca/en/showdoc/cr/C.R.C.-c.870

4. Metals in foodstuffs,
   http://ec.europa.eu/food/food/chemicalsafety/
   contaminants/cadmium_en.htm

5. Lee Davidowski and Praveen Sarojam, PerkinElmer
   Application Note, As in Baby Food and Juice by GFAA
   (2009).

6. Ruth E. Wolf and Kenneth R Neubauer, Determination
   of Arsenic in Chloride Matrices, PerkinElmer Application
   Note D6357A, 2002.

PerkinElmer, Inc.
940 Winter Street
Waltham, MA 02451 USA
P: (800) 762-4000 or
(+1) 203-925-4602
www.perkinelmer.com

For a complete listing of our global offices, visit www.perkinelmer.com/ContactUs

Copyright ©2009-2012, PerkinElmer, Inc. All rights reserved. PerkinElmer® is a registered trademark of PerkinElmer, Inc. All other trademarks are the property of their respective owners.

008708B_01

   8
A P P L I C AT I O N N O T E

                                                                      Atomic Absorption

                                                                      Authors
                                                                      Lee Davidowski, Ph.D.
                                                                      Praveen Sarojam, Ph.D.
                                                                      PerkinElmer, Inc.
                                                                      Shelton, CT 06484 USA

Determination of                            Introduction
                                            The United States does not have specific
Arsenic in Baby Foods                       regulations specifying the allowable lev-
                                            els of toxic elements in foods, but many
and Fruit Juices by                         other countries do. For example, Canada

GFAAS                                       has a specific tolerance level for arsenic
                                            of 0.1 ppm in ready to serve fruit juices,
                                            nectars, and beverages1. The toxic nature
                                            of arsenic is such that chronic exposure to
     the element can lead to internal cancers of the bladder and kidney, skin cancer,
     neurological effects, and cardiovascular disease.

     Arsenic can find its way into food through a variety of paths. In the recent past,
     various organic arsenicals were used as herbicides and antimicrobial agents in
     growth fields as well as applied directly on fruits and fruit trees. Prior to 2003,
     arsenic was commonly used as a wood preservative. Sawing and/or sanding of
     this wood would yield arsenic contaminated sawdust. In some areas, arsenic is
     naturally found in rock formations and can enter soil and water which is used in
     the growth of food products. Foods can also be contaminated during manufac-
     turing, processing, packaging and transport processes.

                                                                                                     9
There are a few specific analytical challenges that an analyst Experimental
must consider in the determination of arsenic in foods by A Multiwave™ 3000 Microwave Oven (PerkinElmer®, Shelton,
GFAAS. Toxic elements, such as arsenic, which may be CT USA) was used for the microwave-assisted digestion.
present in foods are biologically important at very low This is an industrial-type oven which can be equipped with
concentrations. The U.S. Department of Health and Human various accessories to optimize the sample digestion. In this
Services, Agency for Toxic Substances and Disease Registry case, the foods were digested in the Rotor 8XF100 which is
(ATSDR) defines a minimal risk level for chronic inorganic a rotor with 8 high pressure vessels made of PTFE-TFM and
arsenic exposure to be 0.0003 mg As/kg/day. For a 45 lb. surrounded by a ceramic jacket. TFM is chemically modified
child drinking a liter of fruit juice a day, the minimal risk PTFE that has enhanced mechanical properties at high tem-
level for that juice would then be about 6 µg/L. Therefore, peratures compared to conventional PTFE. This vessel has a
the analytical technique employed for this application must “working” pressure of 60 bar (580 psi) and can operate at
have the capability to accurately measure arsenic in sample temperatures up to 260 ˚C with an internal volume of 100 mL.
digestates at the sub-ppb concentration level. All vessels’ temperatures were monitored with the IR
Temperature Sensor Accessory. This device gives thermal
A complete method has been developed for the determination
protection to the reactions in all of the vessels by measuring
of arsenic (As) in baby foods and baby fruit juices by Graphite
the temperature remotely on the bottom surface of each
Furnace Atomic Absorption Spectroscopy (GFAAS). This
vessel liner during the digestion process. Pressure is continu-
method includes sample preparation steps using microwave
ously monitored in all vessels using load-cell technology in
assisted closed vessel digestion. Foods come in a wide variety
the upper rotor plate.
of complex sample types and matrices, but their fundamental
major components are water and various carbohydrates. In Samples of fruit juices and
this work, the samples were totally digested in a microwave solid fruit purees were weighed
oven so that the samples’ various carbohydrate matrices directly into the PTFE-TFM
were completely destroyed prior to instrumental analysis. digestion vessel liners (Figure 2).
Microwave digestion has several analytical advantages Sample weights were approxi-
for this type of analysis. Because the sample is placed in mately 2 grams for the liquid
a sealed PTFE polymer digestion vessel, contamination is juices and 1 gram for the fruit
minimized and there is no loss of volatile elements during the purees. To each sample, 6 mL
digestion procedure. In a sealed vessel, higher temperatures of of concentrated nitric acid
Figure 2. The Multiwave Rotor.
digestion are reached thereby quickly yielding complete matrix and 0.5 mL of concentrated
decomposition. With the microwave system used here, each hydrochloric acid were added.
sample’s digestion process is thoroughly documented as to A pre-digestion spike of arsenic
time, pressure and temperature. This gives an analytically was added to some of the samples to measure analyte recovery
repeatable and transferable digestion process. through the digestion process. Some vessels contained only
the acids with no sample to act as analytical reagent blanks.
The vessels were sealed and placed into the rotor for the
microwave digestion. The acids used were high purity GFS
Chemical™ (Columbus, OH, USA) which are packaged in
PTFE containers. After the digestion process, the digestates
were transferred to polypropylene 50-mL autosampler vials
(PerkinElmer part number B0193234) and laboratory ASTM
type I water was added to a final total weight of 25 grams.
Table 1. Microwave Digestion Program.
Step Power (Watts) Ramp (min) Hold (min) Fan Speed
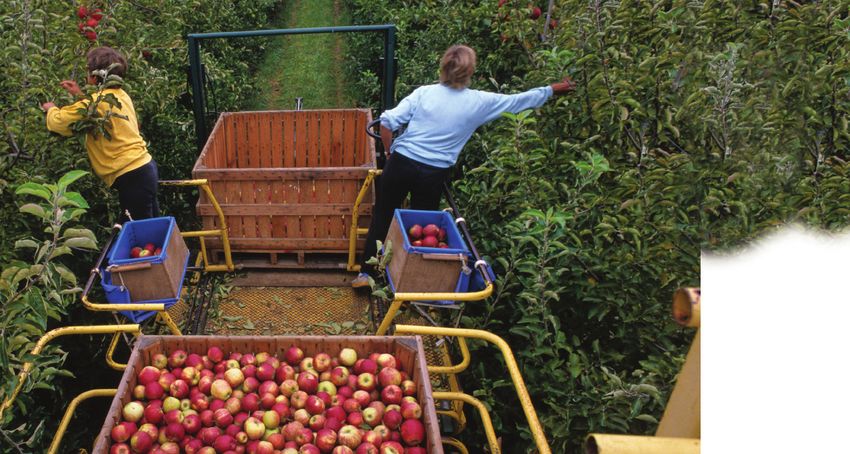
Figure 1. Examples of samples used in this work. 1 750 10 10 1
2 1200 10 10 1
3 0 (cool-down) 0 15 3
10
2Table 1 shows the power/time program used for the sample
Table 3. THGA Heating Program.
digestions. To ensure a safe digestion, the Multiwave 3000’s
IR sensor measures the temperature of each vessel. If a Step Temperature Ramp Time Hold Time Argon Gas
(˚C) (sec) (sec) (mL/min)
vessel nears its maximum operating temperature of 260 ˚C,
then the Multiwave oven will automatically decrease the 1* 120 1 30 250
applied power. Also, the pressure sensor sends data to 2 140 5 15 250
the Multiwave oven controller during the digestion. The 3 1100 10 15 250
Multiwave oven will automatically reduce power if the
4** 1900 0 5 0
maximum pressure of 60 bar is approached.
5 2450 1 3 250
An AAnalyst™ 800 Atomic Absorption Spectrometer * = Injection Temperature = 100 ˚C.
(PerkinElmer) was used for the GFAAS measurements of **= Atomization Step
arsenic in the digested samples. The AAnalyst 800 features
longitudinal Zeeman-effect background correction2 and a
solid-state detector which is highly efficient at low wave-
lengths (arsenics’s primary AA wavelength is 193.7 nm).
The AAnalyst 800 uses a transversely heated graphite atomizer
(THGA) which provides uniform temperature distribution
across the entire length of the graphite tube. The THGA
features an integrated L’vov platform3 which is useful in
overcoming potential chemical interference effects common
to the GFAAS technique.
For instrument calibration, a 10 µg/L As standard was prepared
from serial dilutions of a 1000 mg/L stock standard (PE Pure,
PerkinElmer Part Number N9300102). The AAnalyst 800
autosampler then prepared a calibration curve of 2.5, 5.0
and 10.0 µg/L from that 10 µg/L arsenic standard. A QC
standard was also measured by this method, High Purity
Standards TM-A, (Charleston, SC 29423) and is certified to
be 10 µg/L arsenic. A mixed matrix modifier of palladium
and magnesium nitrate was prepared by diluting and com-
bining individual stock matrix modifier solutions. The mixed
Figure 3. Arsenic calibration curve.
modifier solution is prepared by combining 5 mL of the
stock palladium modifier (1% solution, PerkinElmer Part
Number B0190635) and 0.5 mL of the magnesium nitrate
stock modifier (PerkinElmer Part Number B0190634) and
diluting to 50 mL with ASTM Type I water. Other instrumental
parameters are given in Tables 2 and 3.
A typical calibration curve is shown in Figure 3 and calibration
standard profiles are shown in Figure 4. The curve has good
linearity and the sensitivity is good at low concentrations.
Table 2. AAnalyst 800 Instrumental Parameters.
Wavelength (nm) 193.7
Source Lamp (mA) EDL 380
Slit Width (nm) 0.7
Background Correction Zeeman-effect
Measurement Mode Peak Area, 3 replicates
Calibration Algorithm Linear thru Zero
Integration Time 5.0
Sample Volume 24 Figure 4. Arsenic atomic profile signals for calibration standards and blank.
Matrix Modifier Volume 6
THGA Standard THGA Tube
11
3Results Table 4 shows the mean of the three replicate measurements
The Multiwave 3000 Digestion System with the rotor-8 produced for the food sample corrected for weight used and final
clear, fully digested, sample solutions. No filtration was volume, the standard deviation of those measurements (SD),
necessary. The AAnalyst 800 gave a characteristic mass and the relative standard deviation of the three replicates
(Mo) of 36 pg for arsenic with these conditions which is in (%RSD). Also, the first seven samples shown were digested
good agreement with the manufacturers recommended Mo in duplicate. The difference between the two are shown in
value of 40 pg. Nine different samples of baby juice and the column labeled % Diff. The relatively high percent differ-
puree foods were analyzed by this method. The fruit juices ences in the pear puree samples is due to the fact that the
and one of the puree samples were prepared in duplicate concentration of arsenic is very low in this sample, near the
to check the entire method’s reproducibility. These samples method detection limit for the puree of 3 ng/g.
were also “spiked” prior to digestion with the equivalent
For samples that were split and spiked with arsenic prior to
in the undiluted sample of approximately 240 ng/g arsenic.
digestion, that measure of the spike recovery is shown as
The percent recovery of this spike will be used to check for
the percentage of the recovery in the last column of Table 4.
any losses of arsenic during the digestion and to check for
A recovery value of near 100% shows that there is little or no
the presence of any matrix interferences. All of those data
loss of analyte during the digestion process and that there are
are given in Table 4.
no unresolved matrix interferences with the analytical method.
Table 4. Results for the Analyses of Baby Foods by GFAAS.
Conclusion
Sample ID Mean SD %RSD % DIFF %Recovery
(ng/g) (ng/g) of Spike* It has been shown that this method can be successfully
applied to the determination of arsenic in these types of
B_Pear Juice 10.2 1.2 12 9.9 93.9
foods. The Multiwave 3000 Digestion System gave completely
G_Pear Juice 15.1 0.65 4.3 3.3 90.0 digested, clear samples with no loss of arsenic during the
B_Grape Juice 27.4 2.2 8.2 0.70 85.0 high temperature, high pressure process. The AAnalyst 800
B_Apple Juice 12.4 0.96 7.8 3.4 92.6 with longitudinal Zeeman-effect background correction and
THGA tube containing the L’vov platform, gave good spike
G_Apple Juice 18.2 0.29 1.6 4.7
recoveries with no matrix interference. The detection limit
B_Cherry Juice 10.3 0.77 7.5 23
estimated to be 3 ng/g was well below the Canadian limit of
B_Pear Puree 5.00 2.0 35 55 95.7 100 ng/g in the original juice or puree and offers room for
G_Pear PureePerkinElmer, Inc. 940 Winter Street Waltham, MA 02451 USA P: (800) 762-4000 or (+1) 203-925-4602 www.perkinelmer.com For a complete listing of our global offices, visit www.perkinelmer.com/ContactUs Copyright ©2015, PerkinElmer, Inc. All rights reserved. PerkinElmer® is a registered trademark of PerkinElmer, Inc. All other trademarks are the property of their respective owners. 012254_01 PKI
You can also read