Bivalve abundance in relation to sediment properties across northern North Island - New Zealand Fisheries Assessment Report 2021/49 P. Neubauer ...
←
→
Page content transcription
If your browser does not render page correctly, please read the page content below
Bivalve abundance in relation to
sediment properties across northern
North Island
New Zealand Fisheries Assessment Report 2021/49
        P. Neubauer,
        D. Damodaran,
        K. Berkenbusch
ISSN 1179-5352 (online)
ISBN 978-1-99-100989-0 (online)
September 2021
Requests for further copies should be directed to:

Publications Logistics Officer
Ministry for Primary Industries
PO Box 2526
WELLINGTON 6140

Email: brand@mpi.govt.nz
Telephone: 0800 00 83 33
Facsimile: 04-894 0300

This publication is also available on the Ministry for Primary Industries websites at:
http://www.mpi.govt.nz/news-and-resources/publications
http://fs.fish.govt.nz go to Document library/Research reports

© Crown Copyright - Fisheries New Zealand
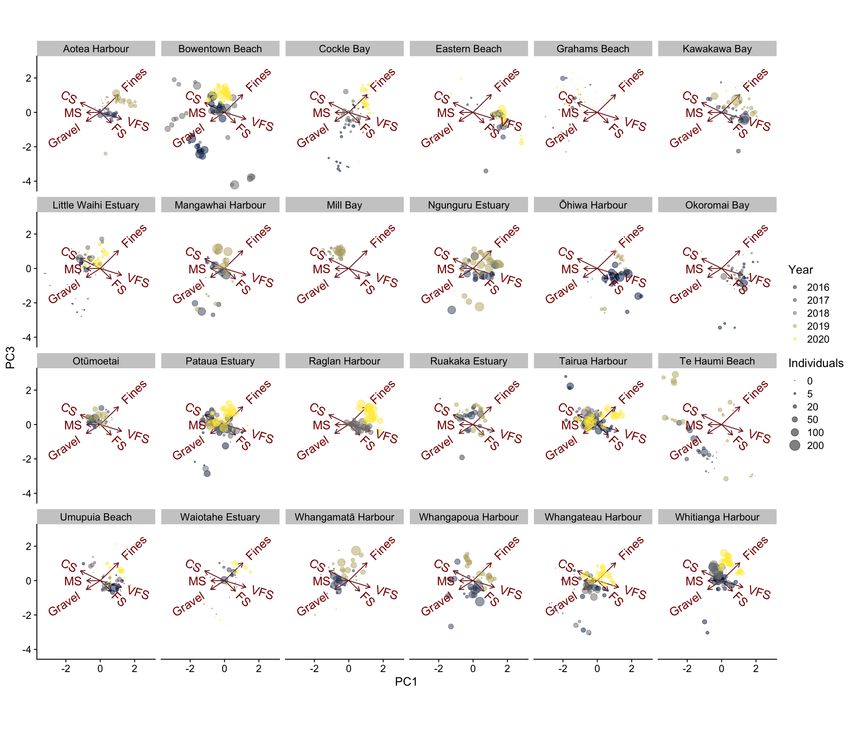
TABLE OF CONTENTS

   EXECUTIVE SUMMARY                                                                                                             1

1 INTRODUCTION                                                                                                                   2

2 METHODS                                                                                                                        3
  2.1 Field sampling of cockles . . . . . . . . . . . . . . . . . . . . .   .   .   .   .   .   .   .   .   .   .   .   .   .    3
  2.2 Sediment sampling . . . . . . . . . . . . . . . . . . . . . . . .     .   .   .   .   .   .   .   .   .   .   .   .   .    3
  2.3 Exploratory data analysis . . . . . . . . . . . . . . . . . . . . .   .   .   .   .   .   .   .   .   .   .   .   .   .    4
  2.4 Modelling cockle density in relation to sediment characteristics .    .   .   .   .   .   .   .   .   .   .   .   .   .    4

3 RESULTS                                                                                                                        5

4 DISCUSSION                                                                                                                    14

5 ACKNOWLEDGMENTS                                                                                                               15

6 REFERENCES                                                                                                                    15
EXECUTIVE SUMMARY

Neubauer, P.1 ; Damodaran, D.1 ; Berkenbusch, K.1 (2021). Bivalve abundance in relation to
sediment properties across northern North Island.
New Zealand Fisheries Assessment Report 2021/49. 17 p.
Intertidal cockles (tuangi, or littleneck clam, Austrovenus stutchburyi) are an important target species
for customary and recreational fisheries throughout New Zealand. Their presence in coastal habitats,
including sheltered bays and estuaries, makes these intertidal populations vulnerable to human impacts,
including overexploitation and habitat degradation. The latter include runoff of terrigenous sediment
and increased concentrations of suspended sediment, which have been linked to decreases in cockle
abundance.
Across northern North Island, regular population surveys have focused on the spatial distribution,
abundance and size structure of cockle populations targeted by non-commercial fishing. In view of the
importance of sediment properties and their value as potential indicators of habitat quality, a sediment
sampling component was added to the northern surveys in 2013–14; subsequent improvements to the
sampling design have allowed formal analyses of cockle populations in relation to sediment
characteristics.
The present study provides an investigation of the relationship between cockles and sediment grain size
across northern North Island survey sites, based on data from five years of monitoring. The initial
exploration of data was a principal component analysis, followed by the modelling of cockle population
abundances as a function of different grain size fractions; a quantile regression was used to examine
sediment-mediated effects on higher quantiles (>0.5) of observed abundances. To investigate which
part of the cockle distribution responds to sediment grain size distributions, quantiles between 0.50 and
0.95 were modelled. The modelling was conducted for total cockle abundance and also for individuals
in the large size class (i.e., individuals >30 mm shell length). The sediment grain size fractions
included in the analysis were sediment fines (>63 µm grain size), very fine sand (>125 µm), fine sand
(>250 µm), medium sand (>500 µm) and gravel (>2000 µm).
The findings from the analysis documented relatively small changes in sediment properties across sites
over time: there was a small reduction in samples containing gravel, and there was also a small increase
in medium to fine sands. Neither of these changes were sufficient to notably affect cockle abundance;
the latter was highest in fine to medium sands. With most of the sediment consistently dominated by
sand fractions, observed declines in cockle populations at some sites are likely related to factors other
than sediment grain size characteristics. In general, the sediment habitat in the cockle strata appeared
stable throughout the study period, and there were no marked increases in fines or gravel.
Overall, the proportion of sediment fines was generally below the threshold of about 10% that has been
identified to limit cockle populations. Nevertheless, there was considerable variability in this grain size
fraction at some sites, evident in individual samples where fines exceeded 20% of the sediment. In
addition, some sites exhibited recent changes in sediment composition, with discernible increases in
fine sand and sediment fines, even though these increases did not markedly affect cockle abundances;
however, the abundance of the large individuals was low when the proportion of sediment fines exceeded
20%.
With multiple pressures potentially impacting intertidal cockle populations, information of sediment
properties allowed the elucidation of this potential stressor in relation to population changes. With the
current analysis indicating relatively few changes in sediment grain size composition over the study
period, the findings indicate that changes in cockle populations are determined by other factors at the
survey sites.

   1
       Dragonfly Data Science, New Zealand.

Fisheries New Zealand                                                Sediment influence on cockle abundance • 1
1. INTRODUCTION Intertidal marine invertebrates such as infaunal bivalves frequently include species that are important resources for recreational, customary and commercial fisheries (Caddy & Defeo 2003). Their presence in coastal waters, including sheltered bays and estuaries, makes these intertidal populations vulnerable to human impacts, including overexploitation and habitat degradation. Adverse impacts can result in direct population declines, and also affect longer-term processes such as recruitment, growth rates and overall mortality, leading to a reduction in productivity. In addition, these impacts may generate spatial gradients in the structure of populations that are already characterised by naturally patchy distributions and highly variable population dynamics. New Zealand’s coastal, sedimentary habitats support a number of infaunal bivalve species, including cockles (tuangi, or littleneck clam, Austrovenus stutchburyi) that are a valued resource for recreational and customary fisheries. Cockles are found in sheltered and semi-enclosed marine habitats such as embayments, estuaries and harbours throughout New Zealand (Morton & Miller 1973). In northern North Island, cockles are one of the principal target species in sheltered coastal environments open to recreational and customary fishing (Grant & Hay 2003). Close proximity to urban and metropolitan areas (e.g., Auckland) and their prevalence in the intertidal zone make many northern cockle populations easily accessible and, therefore, vulnerable to overexploitation. Concerns about potential population declines in the northern region have led to the implementation of a bivalve monitoring programme in the early 1990s; these surveys have been commissioned by Fisheries New Zealand (and its predecessors), and include a number of northern sites in the Auckland metropolitan area, wider Auckland, Northland, Coromandel, west coast Waikato and Bay of Plenty (see recent surveys by Pawley & Smith 2014, Berkenbusch et al. 2015, Berkenbusch & Neubauer 2015, 2016). Since the late 1990s, the survey design has remained consistent, with a sampling focus on cockles and pipi (Paphies australis). Population information from the surveys supports Fisheries New Zealand’s management strategies to ensure sustainable recreational and customary fisheries in the northern region. In addition to fishing pressure, human activities such as coastal development and land use have also been shown to adversely affect cockle (and other bivalve) populations. Negative population impacts have been associated with the runoff of terrigenous sediment, increased suspended sediment concentrations, and the transfer of contaminants and disease vectors to coastal habitats (Grant & Hay 2003). Increased sedimentation and terrestrial runoff have been linked to decreases in cockle abundance. Although cockles generally exhibit a relatively wide tolerance to sediment mud content (silt and clay,
2. METHODS
2.1 Field sampling of cockles
The field sampling of cockles and sediment was part of the northern North Island bivalve monitoring
surveys (in Fisheries Management Areas 1 and 9), conducted between 2015–16 and 2019–20 (see details
in Berkenbusch & Neubauer 2016, 2017, 2018, 2019, 2020).
The field surveys were based on a combination of a systematic design and two-phase random-stratified
sampling. Strata were chosen based on cockle densities ascertained in preceding surveys, with a focus
on retaining the overall sampling extent throughout the survey series (i.e., since 1999–2000).
For each stratum, a regular grid was generated, with the size and shape of the grid cells reflecting the
desired sampling density and the orientation of the stratum. This step included ascertaining the
intersection of the grid with the boundary of the stratum. For strata with odd shapes, the number of grid
cells did not necessarily reflect the number of desired cockle samples; if there were more grid cells than
sampling points, not all cells had sampling points allocated to them. Instead, cockle sampling points
were allocated across all cells with a probability proportional to the area of the cells.
The position of the point within a cell was randomly allocated. All sampling points were pre-calculated
for two phases before the sampling began. All phase-1 points were sampled, whereas sampling of phase-2
points was only carried out when the coefficient of variation (CV) of the total cockle abundance estimate
after first-phase sampling exceeded the target value of 20%. The number of required phase-2 samples
was calculated using the method of Francis (1984).
At each site, sampling points within each stratum were located using Global Positioning System (GPS)
units. Bivalves were sampled using a pair of benthic cores that were 15-cm diameter each; the
combined cores sampled a surface area of 0.035 m2 . The cores were sampled to a sediment depth of
15 cm, and all sediment within the cores was subsequently sieved on 5-mm mesh. All cockles retained
on the mesh were counted and measured (length of the maximum dimension, to the nearest millimetre),
before returning them to the benthos. When the number of individuals in both cores exceeded 70
(equating to 2000 individuals per m2 ) and there were at least 50 individuals in the first core, the
recording of shell length measurements was based on subsampling. The subsampling consisted of
recording shell length measurements for all individuals in the first core, whereas bivalves in the second
core were not measured. When there were fewer than 50 individuals in the first core, all bivalves were
measured in both cores. Length measurements were used to determine the number of individuals in
different size classes, with cut-off lengths defined as ≤15 mm for recruits, ≥30 mm for large
individuals, and medium-sized individuals at sizes between these two size classes.

2.2 Sediment sampling
Since 2013–14, the surveys have also collected information on sediment properties, i.e., organic content
and sediment grain size data (Berkenbusch et al. 2015, Berkenbusch & Neubauer 2015). Following
the initial two years of baseline information, the sampling design was refined in 2015–16 to allow the
formal analysis of sediment properties; the latter was focused on spatial patterns in sediment variables,
and on assessing gradients in cockle abundance in relation to sediment properties (Neubauer et al. 2015,
Berkenbusch & Neubauer 2016).
The sediment sampling was based on the collection of a subset of 24 sediment cores (5-cm diameter,
sampled to a depth of 10 cm) that were collected within existing cockle strata at each site. Subsequent
sample analyses determined the organic content and grain size distribution of the sediment.
The grain size analysis was based on wet sieving to ascertain the proportion of six different size classes:
sediment fines (silt and clay; 63-µm grain size), fine sand
(FS; >125-µm grain size), medium sand (MS; 500-µm grain
size), and gravel (>2000 µm grain size) (Eleftheriou & McIntyre 2005). Each sample was homogenised

Fisheries New Zealand                                                Sediment influence on cockle abundance • 3
before processing through a stack of sieves to determine the proportion in each sediment grain size
fraction (i.e., 63, >125, >250, >500, and >2000 µm). Sediment retained on each sieve was
subsequently dried to constant weight at 60 ◦ C before weighing it (accuracy ± 0.0001 g).
Descriptive sediment data from these analyses include the proportions of sediment in the different grain
size fractions for each sample.
For the current study, sediment grain size data were included from 24 northern survey sites where
sediment had been sampled in at least two surveys (Table 1).

Table 1: Number of sediment samples taken at northern North Island bivalve survey sites by year.

                                                                       Survey year
                           Survey site
                                                  2016   2017   2018   2019   2020
                           Aotea Harbour                   24            24
                           Bowentown Beach         24             24            24
                           Cockle Bay              24             23            24
                           Eastern Beach                   24                   24
                           Grahams Beach                   24                   24
                           Kawakawa Bay                    24            24
                           Little Waihi Estuary     24            24            24
                           Mangawhai Harbour               22            24
                           Mill Bay                               24     24
                           Ngunguru Estuary                23            24
                           Ōhiwa Harbour           22                    24
                           Okoromai Bay            24             24
                           Otūmoetai                       24            23
                           Pataua Estuary          23             24            24
                           Raglan Harbour                         24            24
                           Ruakaka Estuary                 24            24
                           Tairua Harbour          24             24            24
                           Te Haumi Beach                  24            24
                           Umupuia Beach           24             24            24
                           Waiotahe Estuary                24                   24
                           Whangamatā Harbour              24            24
                           Whangapoua Harbour              24            24
                           Whangateau Harbour      24            24            24
                           Whitianga Harbour       24            24            24
                           Total                  237    285    263    263    288

2.3 Exploratory data analysis
The initial exploration of data applied a principal component analysis (PCA) to data on the sediment
composition (proportions of fines, very fine sand, fine sand, medium sand, coarse sand, and gravel) across
sites and years. Zero values for sediment composition were replaced with minimum values contained
within the data and re-normalised to sum to 1; subsequently, compositions were central-log-ratio (CLR)
transformed, where CLR(pi ) = log(pi )/log¯(p), placing the composition on the axis of real numbers.
All analyses were carried out in R statistical software (R Core Team 2019).

2.4 Modelling cockle density in relation to sediment characteristics
To gain an understanding of cockle density in relation to sediment grain size composition across sites,
the current modelling distinguished between the total number of individuals and abundance of
individuals in the different size classes. Cockle population abundances were modelled as a function of
the principal component axes (i.e., as a function of the relative proportion of fines, and coarse sand

4 • Sediment influence on cockle abundance                                            Fisheries New Zealand
relative to fine sand). Because a number of factors are likely to influence cockle abundance (e.g.,
fishing, habitat degradation), a quantile regression was used to gain insights into sediment-mediated
effects on higher quantiles (>0.5) of observed abundances. This approach was also chosen, because
mean abundance may be influenced by other factors, such as fishing and recruitment (Thrush et al.
2003, Anderson 2008). To investigate which part of the cockle distribution responds to sediment grain
size distributions, quantiles between 0.50 and 0.95 were modelled here.
3. RESULTS
The sediment composition across sites remained relatively stable over time (Figure 1). Nevertheless,
there was an increase in samples that did not contain gravel in recent years, and there was a slight increase
in samples with medium to fine sediment. Samples with high total cockle abundance (i.e., across all size
classes) were mostly in medium to very fine sands. At the same time, high individual cockle counts
were rare in samples with a high proportion of sediment fines or coarse sand and gravel (Figure 2). A
similar pattern was evident for cockles in the large size class (Figure 3). Nevertheless, for both population
measures, most of the samples were characterised by relatively low cockle abundance.
Gravel CS MS
200
100
Year
No. of samples
0 2016
2017
FS VFS Fines
2018
2019
2020
200
100
0
0 25 50 75 0 25 50 75 0 25 50 75
Sediment (%)
Figure 1: Proportion of sediment (%) in different grain size fractions in samples collected across 24 northern
North Island survey sites between 2015–16 and 2019–20. Sediment grain size fractions were fines (silt and
clay, 63 µm), fine sand (FS, >125 µm), medium sand (MS, >250 µm); coarse
sand (CS, >500 µm), and gravel (>2000 µm).
Fisheries New Zealand Sediment influence on cockle abundance • 5Gravel CS MS
200
150
100
50 Samples
Abundance
0 200
FS VFS Fines 50
20
200 5
1
150
100
50
0
0 25 50 75 0 25 50 75 0 25 50 75
Sediment (%)
Figure 2: Abundance of cockles (total number of individuals per sample, all sizes) as a function of sediment
composition for samples collected across 24 northern North Island survey sites between 2015–16 and
2019–20. Sediment grain size fractions were fines (silt and clay, 63 µm),
fine sand (FS, >125 µm), medium sand (MS, >250 µm), coarse sand (CS, >500 µm), and gravel (>2000 µm).
Gravel CS MS
25
20
15
10
5 Samples
Abundance
0
200
FS VFS Fines 50
25 20
5
20 1
15
10
5
0
0 25 50 75 0 25 50 75 0 25 50 75
Sediment (%)
Figure 3: Abundance of large cockles (number of individuals per sample, ≥30 mm shell length) as a function
of sediment composition for samples collected across 24 northern North Island survey sites between 2015–16
and 2019–20. Sediment grain size fractions were fines (silt and clay, 63 µm),
fine sand (FS, >125 µm), medium sand (MS, >250 µm), coarse sand (CS, >500 µm), and gravel (>2000 µm).
The first three principal components explained 86.6% of the variance in sediment composition (Figure 4).
The first PC axis distinguished between samples characterised by large grain size fractions and fine grain
sizes, whereas the second axis distinguished samples with a high proportion of gravel from samples
dominated by fine to coarse sands (Figure 5). The third axis distinguished samples characterised by
fines from other sediment types (although samples with fines co-varied with coarse sand). PC axes four
and five did not show a clear pattern by sediment grain size fraction.
6 • Sediment influence on cockle abundance Fisheries New Zealand0.4
0.3
Variance (%)
0.2
0.1
0.0
PC1 PC2 PC3 PC4 PC5
Component
Figure 4: Scree plot of the proportion of variance in sediment composition explained by principal component.
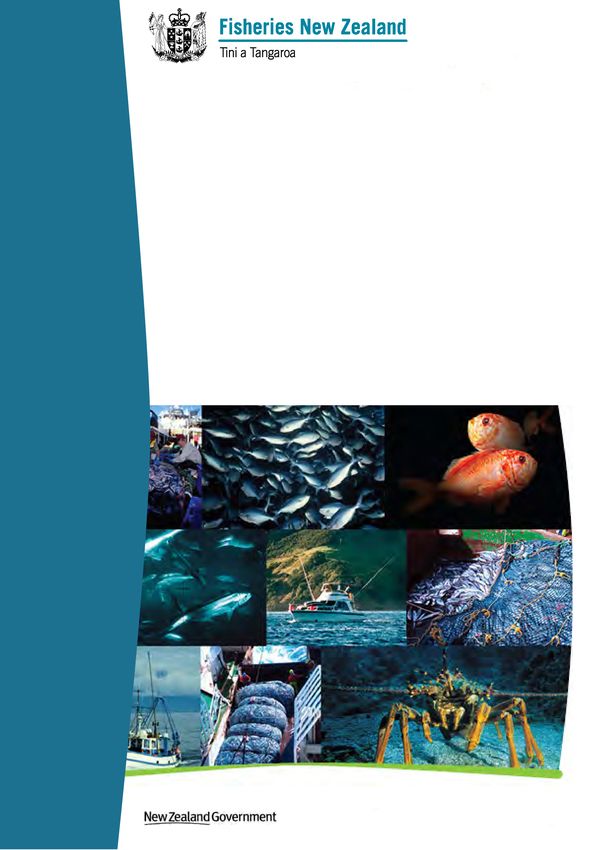
For each size class, overlaying cockle abundance by year onto principal components did not reveal a
clear pattern of abundance in relation to fine compared with coarse sediment fractions (PC1) or sediment
fines (PC3; Figure 6). Nevertheless, changes in sediment composition across years were evident for a
number of sites (e.g., Cockle Bay, Bowentown Beach, Raglan and Whitianga harbours), which showed
a shift towards higher fractions of fine sand and fines in recent surveys (Figures 7 and 8). The recent
shift in sediment grain size did not seem to be associated with a change in total cockle abundance or in
the abundance of large cockles.
Using principal components one and three as predictors for quantile regressions, there were distinct
patterns between effects of sediment for quantiles of total cockle abundance and also of the abundance
of large cockles (Figure 9). For all size classes, the effect of fine sand fractions and of sediment fines
declined towards higher quantiles. This finding suggested a higher median cockle abundance in
finer-sized sediment, but little effect on abundance peaks. For large cockles, however, there was an
opposing effect for sediment fines (PC3) and fine versus coarse sediments (PC1), with higher peaks of
large individuals in finer sand, but an increasingly negative effect of fines on higher quantiles of large
cockle abundance. The latter negative effect suggested that the peak abundance of large cockles is
lower when the proportion of sediment fines exceeded 20% (Figure 10).
Fisheries New Zealand Sediment influence on cockle abundance • 70.4
PC1
0.0
−0.4
0.4
PC2
0.0
−0.4
0.4
Loading
PC3
0.0
−0.4
0.4
PC4
0.0
−0.4
0.4 PC5
0.0
−0.4
Gravel CS MS FS VFS Fines
Sediment fraction
Figure 5: Correlation (loading) of principal components (PCs) with sediment granulometry. Sediment grain
size fractions were fines (silt and clay, 63 µm), fine sand (FS, >125 µm),
medium sand (MS, >250 µm), coarse sand (CS, >500 µm), and gravel (>2000 µm).
8 • Sediment influence on cockle abundance Fisheries New ZealandAll Large
2 s s
ne ne
Fi Fi
CS CS
0 MS MS
FS VFS FS VFS
el el
rav rav Year
G G
−2 2016
2017
2018
2019
−4 2020
PC3
Medium Recruits Individuals
0
5
2
n es ne
s
Fi F i 20
CS CS 50
100
0 MS MS 200
el FS VFS el FS VFS
Grav G rav
−2
−4
−2 0 2 −2 0 2
PC1
Figure 6: Cockle abundance along two principal components (standardised PCs) of sediment granulometry
for all cockle size classes (all), large (≥30 mm shell length) and medium-sized (≥10 mm andFigure 7: Total cockle abundance by site along two principal components (standardised PCs) of sediment granulometry. PC1 explained 40.5% of the variance and distinguished fine (≤250 µm) and coarse (>250 µm) sediment sand fractions; PC3 explained 15.6.% of the variance and was mainly associated with sediment fines (silt and clay;
Figure 8: Abundance of large cockles (≥30 mm shell length) by site along two principal components
(standardised PCs) of sediment granulometry. PC1 explained 40.5% of the variance and distinguished fine
(≤250 µm) and coarse (>250 µm) sediment sand fractions; PC3 explained 15.6.% of the variance and was
mainly associated with sediment fines (silt and clay;
All                                          Large

             1.20

             1.15

                                                                                                           PC1
             1.10

             1.05
 Abundance

             1.00

              1.6

              1.4

                                                                                                           PC3
              1.2

              1.0

              0.8

                    0.5   0.6   0.7       0.8    0.9       0.5      0.6       0.7       0.8      0.9
                                                       Quantile

Figure 9: Quantile process plot (coefficients and associated standard error for quantiles from 0.50 to 0.95),
showing multiplicative effects per standardised principal component (PC), for all cockle size classes and large
(≥30 mm) cockles. PC1 distinguished fine (≤250 µm) and coarse (>250 µm) sediment fractions, whereas PC3
was mainly associated with sediment fines (silt and clay;
All Large
25
200
20
150 Samples
Abundance
15
30
20
100
10 10
50 5
0 0
0 10 20 30 0 10 20 30
Sediment fines (%) Sediment fines (%)
Figure 10: Fitted quantile regression line at q = 0.9 and associated standard error, for all cockle size classes
and large (≥30 mm) cockles as a function of the proportion of sediment fines (%) along principal component
3 (PC3), which was mainly associated with sediment fines (silt and clay;4. DISCUSSION Intertidal cockle populations in northern New Zealand are vulnerable to human-induced stressors, such as overfishing, increased sediment loading, pollution and nutrient enrichment (Grant & Hay 2003). The magnitude and repercussions of these factors are often difficult to assess. For example, the general lack of information pertaining to recreational and customary take of intertidal bivalves precludes a direct assessment of fishing impacts on cockle populations. Similarly, data pertaining to changes in coastal environments are often scarce, particularly when these changes are not associated with an acute event or point source and occur over time. In the context of habitat quality, recognition of the importance of sediment characteristics, particularly increased concentrations of sediment fines (silt and clay, 25%) within all estuaries should not expand, and that the sediment mud content should not exceed 10% in 95% of exposed intertidal areas within the marine park by 2050 (Sea Change – Tai Timu Tai Pari 2017). In the wider Auckland region, several experimental studies have focused on assessing the direct impact of sediment runoff on benthic communities, including cockles (Hewitt et al. 2001, Norkko et al. 2002a, Anderson et al. 2004, Lohrer et al. 2004). In addition, two separate modelling studies examined the habitat preference of cockles and other macrofaunal species in relation to sediment grain size (i.e., mud content) across northern North Island estuaries, based on data from a number of monitoring sites (Thrush et al. 2003, Anderson 2008). Their findings revealed that the optimum proportion of fines (
In general, the sediment habitat in the cockle strata appeared stable throughout the study period, i.e.,
without marked increases in fines or gravel. Part of this outcome may be related to the sampling depth of
the sediment cores: both sediment grain size and organic content were determined for the top 10 cm of the
sediment, instead of surficial sediment only. For this reason, the current sediment data reflect the overall
characteristics of the habitat which may influence cockle abundance (e.g., through burrowing ability,
and other physical and biogeochemical characteristics that affect cockles); however, this sampling depth
also means that changes at only the sediment surface are less likely to be detected because they are less
pronounced in relation to the entire sampling depth. Although changes at the sediment surface may be
more pronounced, they are likely to be short-term, unless the impacts are significant, such as through
catastrophic sediment runoff events (Norkko et al. 2002b).
Overall, the proportion of sediment fines was generally below the threshold of about 10% that may limit
cockle populations. Nevertheless, there was considerable variability in this grain size fraction at some
sites, evident in individual samples where fines exceeded 20% of the sediment. Examples included
Umpuia Beach in 2019–20 (individual samples with 35 and 69% of fines; Berkenbusch & Neubauer
2020) and Kawakawa Bay (West) in 2018–19 (43%; Berkenbusch & Neubauer 2019).
In addition, some sites exhibited recent changes in sediment composition, with discernible increases in
fine sand and sediment fines, even though these increases did not affect abundance of all cockles or of
individuals in the large size class. Nevertheless, the abundance of large-sized individuals was low when
the proportion of sediment fines exceeded 20%.
With sediment properties playing an significant role in determining intertidal cockle populations, the
sampling of the northern bivalve populations allows the monitoring of these habitat characteristics across
different survey sites and over time. With multiple pressures potentially impacting resident cockles,
information of sediment properties allows the elucidation of this potential stressor in relation to changes
in cockle populations. The current analysis indicated relatively few changes in sediment over the study
period, highlighting the role of other factors in relation to cockle populations at the survey sites.

5. ACKNOWLEDGMENTS
Funding for this study was provided by Fisheries New Zealand project AKI2018-01.

6. REFERENCES
Anderson, M.J. (2008). Animal-sediment relationships re-visited: Characterising species’ distributions
     along an environmental gradient using canonical analysis and quantile regression splines. Journal
     of Experimental Marine Biology and Ecology 366 (1): 16–27.
Anderson, M.J.; Ford, R.B.; Feary, D.A.; Honeywill, C. (2004). Quantitative measures of sedimentation
     in an estuarine system and its relationship with intertidal soft-sediment infauna. Marine Ecology
     Progress Series 272: 33–48.
Berkenbusch, K.; Abraham, E.; Neubauer, P. (2015). Intertidal shellfish monitoring in the northern North
     Island region, 2013–14. New Zealand Fisheries Assessment Report 2015/15. 83 p. Retrieved from
     https://fs.fish.govt.nz/Page.aspx?pk=113&dk=23774.
Berkenbusch, K.; Neubauer, P. (2015). Intertidal shellfish monitoring in the northern North Island region,
     2014–15. New Zealand Fisheries Assessment Report 2015/59. 110 p. Retrieved from https://fs.
     fish.govt.nz/Doc/23960/FAR_2015_59_2933_AKI%202014-01.pdf.ashx.
Berkenbusch, K.; Neubauer, P. (2016). Intertidal shellfish monitoring in the northern North Island region,
     2015–16. New Zealand Fisheries Assessment Report 2016/49. 108 p. Retrieved from https://fs.
     fish.govt.nz/Page.aspx?pk=113&dk=24186.
Berkenbusch, K.; Neubauer, P. (2017). Intertidal shellfish monitoring in the northern North Island region,
     2016–17. New Zealand Fisheries Assessment Report 2017/51. 103 p. Retrieved from https://fs.
     fish.govt.nz/Page.aspx?pk=113&dk=24505.

Fisheries New Zealand                                               Sediment influence on cockle abundance • 15
Berkenbusch, K.; Neubauer, P. (2018). Intertidal shellfish monitoring in the northern North Island region,
2017–18. New Zealand Fisheries Assessment Report 2018/28. 99 p. Retrieved from https://fs.fish.
govt.nz/Page.aspx?pk=113&dk=24620.
Berkenbusch, K.; Neubauer, P. (2019). Intertidal shellfish monitoring in the northern North Island region,
2018–19. New Zealand Fisheries Assessment Report 2019/32. 106 p. Retrieved from https://fs.
fish.govt.nz/Page.aspx?pk=113&dk=24738.
Berkenbusch, K.; Neubauer, P. (2020). Intertidal shellfish monitoring in the northern North Island region,
2019–20. New Zealand Fisheries Assessment Report 2020/38. 103 p. Retrieved from https://fs.
fish.govt.nz/Page.aspx?pk=113&dk=24836.
Caddy, J.F.; Defeo, O. (2003). Enhancing or restoring the productivity of natural populations of shellfish
and other marine invertebrate resources. Food and Agriculture Organization of the United Nations,
FAO Fisheries and Aquaculture Technical Paper No. 448. 159 p.
Eleftheriou, A.; McIntyre, A. (2005). Methods for the study of marine benthos. 418 p. Blackwell Science,
Oxford, United Kingdom.
Francis, R.I.C.C. (1984). An adaptive strategy for stratified random trawl surveys. New Zealand Journal
of Marine and Freshwater Research 18: 59–71.
Grant, C.M.; Hay, B.E. (2003). A review of issues related to depletion of populations of selected infaunal
bivalve species in the Hauraki Gulf Marine Park. A report prepared for the Hauraki Gulf Marine
Park Forum by AquaBio Consultants Limited. (Unpublished report held by Auckland Regional
Council, Auckland.)
Hewitt, J.; Hatton, S.; Safi, K.; Craggs, R. (2001). Effects of suspended sediment levels on suspension-
feeding shellfish in the whitford embayment. Auckland Regional Council, Technical Publication
No. 159.
Hunt, S.; Jones, H.F. (2019). Sediment grain size measurements are affected by site-specific sediment
characteristics and analysis methods: Implications for environmental monitoring. New Zealand
Journal of Marine and Freshwater Research 53 (2): 244–257.
Lohrer, A.M.; Thrush, S.F.; Hewitt, J.E.; Berkenbusch, K.; Ahrens, M.; Cummings, V.J. (2004).
Terrestrially derived sediment: response of marine macrobenthic communities to thin terrigenous
deposits. Marine Ecology Progress Series 273: 121–138. doi:10.3354/meps273121.
Morton, J.E.; Miller, M.C. (1973). The New Zealand sea shore. 653 p. Collins, London.
Neubauer, P.; Abraham, E.R.; Berkenbusch, K. (2015). Predictability of cockle (Austrovenus stutchburyi)
population trends in New Zealand’s northern North Island. PeerJ PrePrints 3: e1772. doi:10.7287/
peerj.preprints.1422v1.
Norkko, A.; Talman, S.; Ellis, J.; Nicholls, P.; Thrush, S. (2002a). Macrofaunal sensitivity to fine
sediments in the Whitford embayment. Auckland Regional Council. Technical Publication No.
158.
Norkko, A.; Thrush, S.F.; Hewitt, J.; Cummings, V.; Norkko, J.; Ellis, J.I.; Funnell, G.; Schultz, D.;
MacDonald, I. (2002b). Smothering of estuarine sandflats by terrigenous clay: the role of
wind-wave disturbance and bioturbation in site-dependent macrofaunal recovery. Marine
Ecology Progress Series 234: 23–42.
Pawley, M.D.M.; Smith, A.N.H. (2014). The distribution and abundance of pipis and cockles in the
Northland, Auckland and Bay of Plenty regions, 2013. New Zealand Fisheries Assessment Report
2014/29. 75 p.
R Core Team (2019). R: A language and environment for statistical computing. R Foundation for
Statistical Computing. Vienna, Austria.
Robertson, B.; Gillespie, P.; Asher, R.; Frisk, S.; Keely, N.; Hopkins, G.; Thompson, S.; Tuckey, B.
(2002). Estuarine environmental assessment and monitoring: A national protocol. Part C:
application of the estuarine monitoring protocol. (Unpublished report prepared by Cawthron
Institute for supporting councils and the Ministry for the Environment.)
Robertson, B.; Robertson, B. (2018). Fortrose Estuary fine scale monitoring 2017/18. (Wriggle Ltd.
Unpublished report prepared for Environment Southland.)
Sea Change – Tai Timu Tai Pari (2017). Hauraki Gulf Marine Spatial Plan.
https://www.seachange.org.nz/read-the-plan. Sea Change – Tai Timu Tai Pari, Hauraki Gulf.
16 • Sediment influence on cockle abundance Fisheries New ZealandThrush, S.F.; Hewitt, J.E.; Norkko, A.; Nicholls, P.E.; Funnell, G.A.; Ellis, J.I. (2003). Habitat change
in estuaries: Predicting broad-scale responses of intertidal macrofauna to sediment mud content.
Marine Ecology Progress Series 263: 101–112.
Fisheries New Zealand Sediment influence on cockle abundance • 17You can also read