Reproducing Fine Textures on Touch Displays Using Band-Limited White Noise Vibrations - ThinkMind
←
→
Page content transcription
If your browser does not render page correctly, please read the page content below
COGNITIVE 2020 : The Twelfth International Conference on Advanced Cognitive Technologies and Applications

      Reproducing Fine Textures on Touch Displays Using Band-Limited White Noise
                                      Vibrations

                          Ugur Alican Alma                                                 Ercan Altinsoy

                     Centre for Tactile Internet                                     Centre for Tactile Internet
                  with Human in the Loop (CeTI)                                   with Human in the Loop (CeTI)
             Chair of Acoustic and Haptic Engineering                        Chair of Acoustic and Haptic Engineering
                     Dresden, Germany 01069                                          Dresden, Germany 01069
          Email: ugur_alican.alma@tu-dresden.de                            Email: ercan_altinsoy@tu-dresden.de

Abstract—In this paper, perceived roughness of different band-         and vibrotactile feedback [8]-[10]. On the other hand, in recent
limited white noise vibrations was evaluated on a tactile dis-         years, some of the researchers introduced significant studies
play. In the previous study, white noise vibrations without a          on measurement-based rendering techniques which enabled
specific cut-off frequency were found suitable while rendering         creating realistic haptic textures [9]. However, since such
fine textures. In that study, some participants reported that low      methods simply plays back the captured immense data from
frequency content of the noise vibrations were not plausible when
                                                                       the surfaces, limited capabilities of tactile receptors [11] is
they were touching the fine textures to rate the similarity between
them. Therefore, the motivation of this work is to improve the         unavoidably ignored [12]. Besides that, perception mechanisms
perceptual capacity of white noise vibrations by adjusting its         of fine and coarse textures are different from each other as
character according to the surface roughness of fine textures.         explained in the duplex theory of tactile texture perception
Two essential factors can be used to adjust the character of noise     [13]. Based on this theory, vibrations occurring from the spatial
vibrations: Frequency content and intensity level. In this study, a    pattern of a surface can be only perceived when texture is not
perceptual test is conveyed to scale the congruence between fine       too fine. For fine textures, the effect of induced vibrations on
textures and band-limited noise vibrations with different high         the perception is not clear, but vibrotactile encoding ability
pass filters and intensities. In total, four cut-off frequencies (30   of sensory receptors take place to perceive them [14], [15].
Hz, 60 Hz, 90 Hz and 120 Hz) and three intensity levels were           Based on the study of Tiest [16], it was reported that complex
tested to seek their best combination with respect to three fine
                                                                       vibrations induced when a finger moves over fine textures
textures with the grit sizes of 0.05 mm, 0.1 mm and 0.2 mm. Based
on the analysis of the collected data, cut-off frequency is found      are not identical to surface roughness while it is identical for
as a primary factor to create plausible fine texture sensation on a    coarse textures. In the seventies, the studies of Lederman [17]-
display. On the other hand, vibration intensity has no significant     [20] and Johnson [21]-[23] brought significant contributions to
effect on perceived similarity when the vibration intensity changes    texture perception. According to their studies, spatial cues can
less than 3 dB.                                                        contribute to roughness perception if the spatial size of bumps
    Keywords–Haptic; Texture; Rendering.                               are larger than 0.1/0.2 mm. Afterwards, Bensmaia and Hollins
                                                                       asserted that waveform variations on complex vibrotaction can
                      I. I NTRODUCTION                                 change the perception of texture, and vibrotactile encoding is
    The field of haptic augmented reality has experienced              sufficient itself to perceive fine textures [24]. Furthermore,
rapid growth using touch displays recently. Touch displays are         another study claimed that active surface exploration with
rapidly emerging apparatus since they are programmable input           finger with varying speed can activate different tactile receptors
devices. Besides their programmability, integration of haptic          with different selective frequencies [13].
feedback to touch displays made them indispensable devices                  As mentioned, the data-driven approach (playing back
for users. With the enhancement of haptic feedback, not only           captured surface data) proposes tactile vibration for fine and
blind [1], but also old or young people can have easier control        coarse textures with similar complexity resolution. Moreover,
on touch surfaces [2]. In the last decade, haptic touch devices        played back recorded vibrations can contain non-perceivable
have been already prototyped using different surface actuation         frequency components, which are below the human vibration
mechanisms [3], [4], and there is even a commercialized touch          detection threshold. According to the former study [12], it was
product [5]. Thanks to haptic feedback, humans can experience          observed that recorded texture vibrations were too complex for
cues, such as texture, shape and stiffness [6]-[9]. Particularly,      coarse textures while fine textures were simulated best with
texture cues provide fundamental haptic information about              complex vibrations. However, actual physical representation
the objects on 2-D space. Hence, texture rendering has been            was not necessary to render fine textures since white noise
considered as the first step on enhancing haptic dimension of          vibrations were found as efficient as recorded vibrations. So
touch devices.                                                         far, not enough researches have been done on perception-based
    So far, immense amount of researches have been conducted           texture modelling [25], [26]. Accordingly, the aim of this study
to produce texture sensation on displays by reproducing differ-        is to propose a simple and perceptually efficient fine texture
ent texture dimensions, such as roughness and friction. These          rendering strategy. Therefore, white noise vibrations will be
two cues have been simulated on touch displays using different         elaborated based on perceived roughness of fine textures which
approaches, such as electrostatic force, ultrasonic vibrations         have different spatial densities. This elaboration procedure

Copyright (c) IARIA, 2020.   ISBN: 978-1-61208-780-1                                                                                  50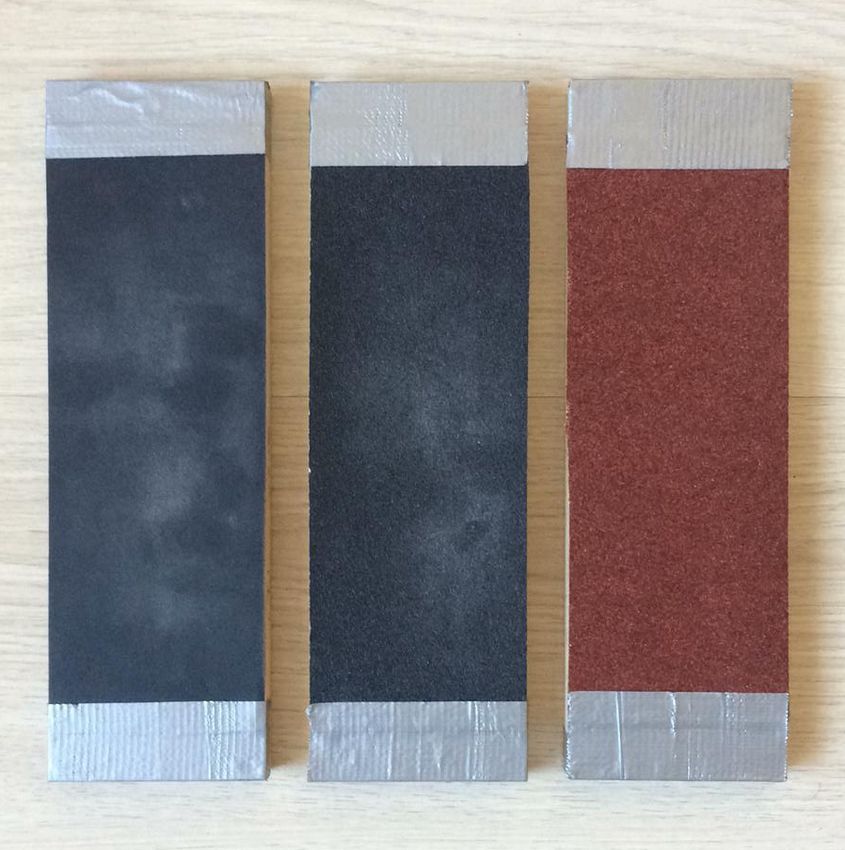
COGNITIVE 2020 : The Twelfth International Conference on Advanced Cognitive Technologies and Applications
will be explained in section 2. With the proposed strategy, magnitude difference between the signals are explicitly illus-
capturing surface data process, which is cumbersome and trated in Figure 1. After equalizing the perceived intensities of
time consuming process, can be eliminated. This aim will the vibrations, four types of vibrations were also produced at
be investigated by assessing the congruence between several reduced (-3 dB) and increased (+3 dB) intensity levels.
sand papers and band noise vibrations with different cut-off
frequencies and intensities. The fine sand papers are selected B. Test Setup
so as to have grit sizes of 0.05 mm, 0.1 mm and 0.2 mm.
For the perceptual investigation, four cut-off frequencies and To carry out a similarity evaluation on a display, an experi-
three intensity levels (reference, -3 dB reduced and +3 dB mental apparatus was built as seen in Figure 2. A touch display
increased levels) were tested. Investigation process will be monitor (Gechic HD 1102H) was assembled on top of an
described in detail in Section 3. Before the main experiment electrodynamic shaker (RFT Messelektronik), and the control
session, perceived intensities of the band noise vibrations were interface was designed to contain scaling bar and play button
equalized via a preliminary test to investigate the effect of for driving the vibrotactile stimuli. The tactile feedback was
the frequency clearly. Based on the results of the evaluation, played for 5 seconds after the subjects clicked the play button
cut-off frequency is found as a significant factor to have an on the interface, and a closed-back headphone (beyerdynamics
effect on perceived roughness. On the other hand, changing the DT-770) was used to prevent the potential interference of the
intensity level as much 3 dB is not found as a significant factor sound of the electrodynamic shaker.
on the suitability of the band-limited white noise vibrations.
In the following section, creation process of tactile stimuli,
experimental setup and experimental method are explained.
II. E XPERIMENTAL S ETUP
A. Creation of Vibrotactile Feedback
The band-limited white noise vibrations were produced at
MATLAB with the sampling frequency of 44100 Hz. In total,
4 different high pass filters were applied to the white noise
signals with the order of 6. The cut-off frequencies are 30 Hz,
60 Hz, 90 Hz and 120 Hz. In addition, a low pass filter with
1000 Hz cut-off frequency was applied to the band-limited
noise signals to eliminate non-perceivable high frequencies.
Note that the cut-off frequencies were selected considering
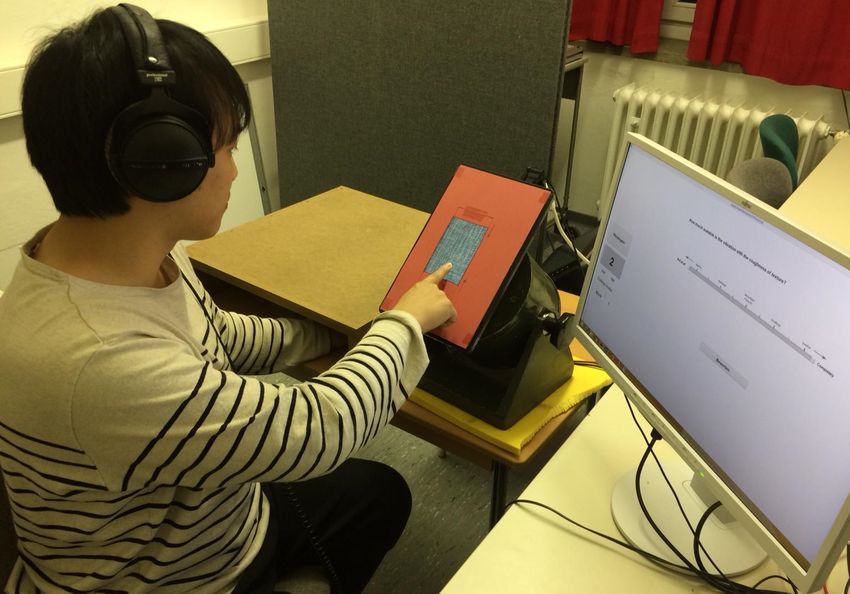
the just noticeable difference of frequency [11]. During the Figure 2. The experimental setup and the evaluation interface are seen
preliminary research phase, 150 Hz cut-off frequency was also above. During the evaluation, the participants touched the sand papers under
the wood cover.
tested, but it was found similar with the vibration with Fc
120 Hz. The profiles of four types of band noise signals are
schematically illustrated in Figure 1. As shown in Figure 3, three sand papers with different
grit sizes were utilized in the perceptual study to examine the
relation between the spatial density of fine textures and the
frequency content of white noise. The image demonstrates the
sand papers from left to right with increasing grit sizes. Note
that the sand papers have regular spatial distributions.
Figure 1. In the figure, frequency spectrum of prepared band-limited white
noise signals are illustrated to show the spectral characteristics of each band
noise vibrations.
Furthermore, intensity levels of the vibrations with different
Fc values were equalized based on perceived vibration inten-
sity. This process was done by conducting a preliminary test Figure 3. From left to right, the sand papers have 0.05 mm, 0.1 mm and 0.2
in which 5 subjects tuned the power amplifier until 4 types mm grit sizes.
of vibrations have same perceived intensity. Thus, the peak
Copyright (c) IARIA, 2020. ISBN: 978-1-61208-780-1 51COGNITIVE 2020 : The Twelfth International Conference on Advanced Cognitive Technologies and Applications
Before the experiment started, tactile feedback genera- respectively. This shows that the participants well-tuned the
tion system was validated as follows: Intensity level of the perceived intensity of the vibrations according to 0.1 mm sand
band noise vibrations at actual intensity on the display was paper. To analyze the effect of each factor (Cut-off frequency,
perceptually set to be similar with the perceived roughness intensity and texture) on the perceived roughness similarity, a
magnitude of 0.1 mm sand paper by tuning the power amplifier. three-way ANOVA test was performed. This test was carried
This process was repeated for each participant. Therefore, the on for 432 values (4 types of vibrations x 3 intensity levels
effect of altering the intensity level on the perceived roughness x 3 sand papers x 12 subjects) using all similarity ratings as
similarity can be examined. Moreover, the subjects were told the dependent value. In conclusion, the cut-off frequency (F(3,
to move their fingers in the central area of the display where 431) = 19.351, p = .0001) and the grit sizes of the fine textures
the characteristic of vibrations was calibrated. In addition, the (F(3, 431) = 5.268, p = .005) were found to have significant
participants were requested to slide their fingers gently over effects on the perceived similarity.
the touch screen to avoid changing vibration intensity on the
display considerably.
III. E XPERIMENTAL M ETHOD
In the evaluation, similarity tests were conducted based on
Rohrmann scaling method [27] since it is a practical approach
to evaluate similarity of a stimuli on linear one dimensional
scale. In total, four band-limited white noise vibrations with
cut-off frequencies of 30 Hz, 60 Hz, 90 Hz, and 120 Hz were
judged in three different intensity levels. It means that there are
36 stimulation cases (4 vibrations x 3 intensity levels x 3 sand
papers) when the subjects evaluate the vibrotactile stimuli for
each texture. In total, 12 subjects, 9 male and 3 female aged
between 24 and 39 years, participated in the experiment.
The evaluation consists of two consequent steps which are
exploring the vibrations and textures, and the rating process.
When the participants clicked the play button from the eval-
uation interface, the vibrations were driven one by one on
the touch display. Then, the participants were requested to
move their fingers on the display at a constant speed during
the stimuli inspection. Also, the participants were allowed to
repeat each vibrotactile stimulus until they are ready for the
rating process. Afterwards, the subjects scaled the similarity
of the each vibrotactile feedback with respect to each sand
paper using verbal labels. The verbal labels are “not at all”,
“little bit”, “middle”, “very much” and “fully”, placed on the
continuous equal interval scale from 0 to 100 at the experiment
interface. Also, the participants were allowed to rate anywhere
in between two labels using the slider. Furthermore, before
the main rating process, training session took place so that
the subjects were trained to be familiar with the evaluation
procedure and the types of vibrotactile stimuli before the main
experiment. The data of the training session were not used
for analysis of the test. The main test aimed to collect the
subjective evaluation data with respect to all combinations
of the vibrotactile stimuli and the textures. All participants
completed the evaluation including the training session below
30 minutes.
IV. R ESULTS Figure 4. Similarity ratings of three texture vibrations are concluded as
above. On the top, the ratings of fc = 30 Hz and fc = 60 Hz, on the bottom,
In the perceptual test, the similarity of the vibrotactile fc = 90 Hz and fc = 120 Hz cases are plotted.
stimuli were judged by the subjects. The collected data for each
vibrotactile stimulus were normally distributed. To begin with
the investigation of the experimental data, similarity ratings of Apart from individual analysis of the independent factors,
the vibrotactile stimuli were plotted for each texture as seen significant interaction effects were found between the factors
in Figure 4. In the figure, it is observed that there is a distinct of cut-off frequency and texture (F(3, 431) = 5.346, p = .0001),
differences between the ratings of the vibrations with different the intensity and the texture (F(3, 431) = 20.079, p = .0001),
cut-off frequencies. In addition, when intensity level of the and all three together (F(3, 431) = 1.691, p = .045). The
vibrotactile stimuli was reduced and increased, the ratings of interaction among the three factors demonstrates that creating
the vibrations increased for 0.05 mm and 0.2 mm textures, plausible band noise vibrations for fine textures depends on
Copyright (c) IARIA, 2020. ISBN: 978-1-61208-780-1 52COGNITIVE 2020 : The Twelfth International Conference on Advanced Cognitive Technologies and Applications
all three factors together, but primarily frequency content. On for 0.2 mm texture compared to 0.05 mm and 0.1 mm textures.
the other hand, although intensity was not found to have a This outcome agrees with the previous studies conducted by
significant effect on the ratings, it might have been significant Lederman and Johnson arguing that spatial cues can contribute
if intensity level would have been altered more than 3 dB. to roughness perception if the spatial size of a surface is more
Furthermore, Post-hoc t-tests with a Bonferroni procedure was than 0.1/0.2 mm.
performed to make pairwise comparisons for each factor. As The perceived intensity of four band-limited noise vibra-
a result, significant differences were found for 5 pairwise tions were equalized at the preliminary test. It is because the
comparisons out of 12 comparisons: “ fc = 30 Hz - fc = 60 human vibration detection threshold depends on the frequency
Hz”, “fc = 30 Hz - fc = 90 Hz”, “fc = 30 Hz - fc = 120 Hz”, of the vibration. Balancing the perceived intensity allowed
“0.05 mm texture - 0.2 mm texture” and “0.1 mm texture - to perform a reliable judgment on the effect of the cut-off
0.2 mm texture”. frequency. Furthermore, the reason why the grit sizes of the
sand papers were chosen as 0.05 mm, 0.1 mm and 0.2 mm is
V. D ISCUSSION to analyze relation between the roughness of fine textures and
In this study, the suitability of the band-limited white the the factors comprehensively.
noise vibrations are evaluated according to three different The maximum ratings of the vibrotactile feedback, which
fine textures. The goal of this evaluation was to detect the are resembling the roughness, were clustered between 70%
most plausible frequency band and the vibration intensity and 80%. The reason why the ratings did not reach 100% is
level according to grit sizes of the fine textures. Therefore, a because the tactile texture perception consists of four main
perception-based fine texture rendering model can be attained dimensions, and roughness is one of the dimension in texture
as an alternative to data driven method. With this method, perception. Therefore, lacking of other dimensions (hardness,
data capturing process can be discarded, and texture rendering friction and heat capacity) might have limited the subjective
process can be simplified. This idea was developed after testing evaluation.
the suitability of white noise vibrations, recorded vibrations
and simple sinusoids with respect to the fabric textures in the
VI. C ONCLUSION
previous study. Since suitability ratings of white noise were
found similar with the recorded vibrations for fine textures, With the results of this study, the effect of frequency and
it was considered that plausibility of white noise can be vibration intensity on the perceived magnitude of roughness is
augmented by removing redundant frequency components. In investigated. Hence, the primary and second factors affecting
addition, different vibration intensity levels were tested in the the suitability of created texture vibrations is figured out.
evaluation so that the roles of both cut-off frequency and On the other hand, the state of art for reproducing textures
vibration intensity on perceived similarity can be figured out has been measurement-based approaches, but perception-based
in one test. According to the results, the cut-off frequency rendering algorithms will likely draw more attention in near
was found as a primary factor to create congruent texture future. It is because perception-based methods can provide
vibrations. However, it is likely that vibration intensity could plausible texture sensation on displays with simpler vibrations
have had more impact on the similarity ratings if the intensity and rendering processes, as observed in the previous study
level would be increased or decreased more than 3 dB. [12]. These advantages can be particularly crucial for tactile in-
ternet technology, which aims rapid data transmission between
According to the collected similarity ratings, the band noise
smart haptic devices for extremely low latency [28]. Namely,
vibrations with 30 Hz cut-off frequency was found as the
texture rendering approaches which drive only perceptually
most unsuitable vibrotactile stimuli for the fine textures, as
perceivable amount of data with high perceptual capacity can
expected. Even altering the vibration intensity did not increase
be the most useful technique. As a future work, an extended
the ratings considerably. However, when the cut-off frequency
study will be conducted to compare the perceptual capacities
was 60 Hz, the similarity ratings for the finest and the mid-
of perception-based and data-driven approaches, and this test
fine textures increased with the confidence interval of 95%.
will be carried out with more participants for more reliable
This event demonstrates the effect of cut-off frequency on
statistical analysis.
the suitability of the white noise vibrations. When the cut-off
frequency of the tactile stimuli became 90 Hz, the mean ratings
were maximum for 0.1 mm and 0.2 mm textures (at increased ACKNOWLEDGMENT
intensity level) with the confidence interval of 80%. For 0.05 Funded by the German Research Foundation (DFG,
mm texture, The maximum mean rating was attained when the Deutsche Forschungsgemeinschaft) as part of Germany’s Ex-
cut-off frequency became 120 Hz (at reduced intensity level). cellence Strategy - EXC 2050/1 - Project ID 390696704 -
For the Fc 90 and 120 Hz cases, altering vibration intensity Cluster of Excellence ”Centre for Tactile Internet with Human-
changed the means of the ratings with the confidence interval in-the-Loop” (CeTI) of Dresden Technical University.
of 95%. This demonstrates that the effect of vibration intensity
on perceived roughness can be only observed if frequency R EFERENCES
content of the vibration is set to be congruent with respect [1] A. Bateman, O. K. Zhao, A. V. Bajcsy, and M. C. Jennings, “A user-
to a reference texture. centered design and analysis of an electrostatic haptic touchscreen system
Another point attained from the statistical analysis is for students with visual impairments”, International Journal of Human-
Computer Studies, 109, 102-111, 2018.
that 0.05 mm and 0.1 mm textures were found significantly
[2] D. Cingel and A. M. Piper, “How parents engage children in tablet-based
different than the 0.2 mm texture, but they were not found reading experiences: An exploration of haptic feedback”, In Proceedings
significantly different from each other. Possibly, it shows that of the 2017 ACM Conference on Computer Supported Cooperative Work
different cutaneous perception processing might have occurred and Social Computing, pp. 505-510. 2017.
Copyright (c) IARIA, 2020. ISBN: 978-1-61208-780-1 53COGNITIVE 2020 : The Twelfth International Conference on Advanced Cognitive Technologies and Applications
[3] O. Bau, I. Poupyrev, A. Israr, and C. Harrison, “TeslaTouch: electrovi- pitch perception of multi-frequency textures”, In Haptics Symposium
bration for touch surfaces”, In Proceedings of the 23nd annual ACM (HAPTICS), pp. 290-295, IEEE, 2018.
symposium on User interface software and technology, pp. 283-292. [26] S. Okamoto and Y. Yamada, “Lossy data compression of vibrotactile
2010. material-like textures”, IEEE transactions on haptics, pp. 69-80, 2013.
[4] J. Mullenbach, C. Shultz, A. M. Piper, M. Peshkin, and J. E. Colgate, [27] B. Rohrmann, “Verbal qualifiers for rating scales: Sociolinguistic con-
“Surface haptic interactions with a TPad tablet”, In Proceedings of siderations and psychometric data”, Project report, p.68, 2007.
the adjunct publication of the 26th annual ACM symposium on User
[28] E. Steinbach, M. Strese, M. Eid, X. Liu, A. Bhardwaj, and Q. Liu,
interface software and technology, pp. 7-8. 2013.
“Haptic codecs for the tactile internet”, Proceedings of the IEEE 107,
[5] M. Cherif, E. J. Colgate, M. A. Peshkin, M. F. Olley, and G. Topel, no. 2, pp. 447-470, 2018.
“Materials and structures for haptic displays with simultaneous sensing
and actuation”, U.S. Patent Application 14/931,209, filed May 5, 2016.
[6] S. C. Kim, A. Israr, and I. Poupyrev, “Tactile rendering of 3D features
on touch surfaces”, In Proceedings of the 26th annual ACM symposium
on User interface software and technology pp. 531-538. ACM, 2013.
[7] S. Saga and R. Raskar, “Simultaneous geometry and texture display based
on lateral force for touchscreen”, In World Haptics Conference (WHC),
pp. 437-442, IEEE, 2013.
[8] G. Ilkhani, M. Aziziaghdam, and E. Samur, “Data-driven texture render-
ing with electrostatic attraction”, In International Conference on Human
Haptic Sensing and Touch Enabled Computer Applications, pp. 496-504,
Springer, Berlin, Heidelberg, 2014.
[9] H. Culbertson, J. Unwin, and K. J. Kuchenbecker, “Modeling and
rendering realistic textures from unconstrained tool-surface interactions”,
IEEE transactions on haptics, pp. 1-1, 2014.
[10] L. Winfield, J. Glassmire, J. E. Colgate, and M. Peshkin, “T-pad: Tactile
pattern display through variable friction reduction”, In EuroHaptics
Conference, 2007 and Symposium on Haptic Interfaces for Virtual
Environment and Teleoperator Systems, World Haptics 2007, Second
Joint pp. 421-426, IEEE, 2007.
[11] M. Rothenberg, R. T. Verrillo, S. A. Zahorian, M. L. Brachman, and S. J.
Bolanowski Jr, “Vibrotactile frequency for encoding a speech parameter”,
The Journal of the Acoustical Society of America, pp. 1003-1012, 1977.
[12] U. A. Alma and E. Altinsoy, “Perceived Roughness of Band-Limited
Noise, Single, and Multiple Sinusoids Compared to Recorded Vibration”,
In IEEE World Haptics Conference (WHC), pp. 337-342, IEEE, 2019.
[13] D. Katz, “The world of touch”, Psychology press, 2013.
[14] M. Hollins, S. J. Bensmaa, and R. Risner, “The duplex theory of tactile
texture perception”, In Proceedings of the 14th annual meeting of the
international society for psychophysics, pp. 115-121, the International
Society for Psychophysics Quebec, Canada, 1998.
[15] M. Hollins and S. R. Risner, “Evidence for the duplex theory of
tactile texture perception”, perception & psychophysics, 62(4), pp.695-
705, 2000.
[16] W. M. B. Tiest and A. M. Kappers, “Haptic and visual perception of
roughness”, Acta psychologica, 124(2), pp.177-189, 2007.
[17] S. J. Lederman, “Tactile roughness of grooved surfaces: The touching
process and effects of macro-and microsurface structure”, Perception &
Psychophysics, 16(2), pp. 385-395, 1974.
[18] S. J. Lederman, “The callus-thenics of touching”, Canadian Journal of
Psychology, 30(2), p. 82, 1976.
[19] S. J. Lederman and M. M. Taylor, “Fingertip force, surface geometry,
and the perception of roughness by active touch”, Perception & Psy-
chophysics, 12(5), pp. 401-408, 1972.
[20] S. J. Lederman, “Tactile roughness of grooved surfaces: The touching
process and effects of macro-and microsurface structure”, Perception &
Psychophysics, 16(2), pp. 385-395, 1974.
[21] C. E. Connor and K. O. Johnson, “Neural coding of tactile texture: com-
parison of spatial and temporal mechanisms for roughness perception”,
Journal of Neuroscience, 12(9), pp. 3414-3426, 1992.
[22] K. O. Johnson and G. D. Lamb, “Neural mechanisms of spatial tactile
discrimination: neural patterns evoked by braille like dot patterns in the
monkey”, The Journal of physiology, 310(1), pp. 117-144, 1981.
[23] J. R. Phillips and K. O. Johnson, “Tactile spatial resolution. II. Neural
representation of bars, edges, and gratings in monkey primary afferents”,
Journal of neurophysiology, 46(6), pp. 1192-1203, 1981.
[24] S. J. BensmaIa and M. Hollins, “The vibrations of texture”, Somatosen-
sory & motor research, 20(1), pp. 33-43, 2003.
[25] R. F. Friesen, R. L. Klatzky, M. A. Peshkin, and J. E. Colgate, “Single
Copyright (c) IARIA, 2020. ISBN: 978-1-61208-780-1 54You can also read