An acoustic system for EOL engines diagnoses in hot test cells - IOPscience
←
→
Page content transcription
If your browser does not render page correctly, please read the page content below
Journal of Physics: Conference Series

PAPER • OPEN ACCESS

An acoustic system for EOL engines diagnoses in hot test cells
To cite this article: M Masullo et al 2020 J. Phys.: Conf. Ser. 1589 012008

View the article online for updates and enhancements.

                                This content was downloaded from IP address 46.4.80.155 on 14/12/2020 at 02:31
AIVELA XXVII Annual National Meeting                                                                            IOP Publishing
Journal of Physics: Conference Series                         1589 (2020) 012008          doi:10.1088/1742-6596/1589/1/012008

An acoustic system for EOL engines diagnoses in hot test cells

                     M Masullo1, L Maffei1, B Bianco2, V Ambrosio2, S Ricciardi2
                     1
                         Università degli Studi della Campania “Luigi Vanvitelli”, Aversa (CE), Italia
                     2
                         ASSING SpA, Monterotondo (Roma), Italia

                     massimiliano.masullo@unicampania.it

                     Abstract. End of Line tests have a crucial role in industrial processes to validate the products’
                     quality. In automotive industry, engines at the end of assembling process are fully tested within
                     hot test cells at different working conditions by mean specific test cycles. Vibration monitoring
                     is widely used in order to identify potential faults in the assembly process. This contact
                     technique leads to several disadvantages, mainly due to the accessibility and the characteristics
                     of surfaces for accelerometers mounting (e.g. rotating parts, geometries complexes, high
                     temperatures) and to the time-consuming setup procedures. These limitations can be overcome
                     by using microphone sensors. This paper describes the development phases of an acoustic
                     based fault diagnosis system, its integration on hot test cells and the results obtained over large
                     number of engines tested. By mean some specific technical solutions the acoustics approach in
                     the EOL fault diagnosis of combustion engines has showed itself to be compatible with the
                     characteristics of the production industry environment, providing reliable and repeatable
                     results. The latter has been demonstrated also by comparison with the traditional accelerometer
                     technique.

1. Introduction
The End Of Line (EOL) testing is one of the most important stage of industrial production processes.
It is mainly used to assess the performances and the quality levels of products, or of their components,
by monitoring and analysing electro-mechanical, thermo and fluid-dynamic sets of parameters, and of
their comparison with (national, international or internal) standards or reference values. EOL data also
provides the control the stability and yield of the production process [1,2].
    Although EOL testing is a common stage of different industries sectors of mass production, such as
for loudspeakers of cellular phones, entertainments and professional [1], or in semiconductor
manufacturing [3], its role is more and more crucial as the complexity of the Unit Under Test (UUT)
increases. For the most part of engine manufacturers, EOL tests is essential to ascertain the system
functioning. They are carried out in special rooms or benches (test cells), after they have been fully
assembled. In these cells the functioning of Internal Combustion Engines (ICE) is tested under
different vehicle conditions, simulating crankshaft rotation and / or applied loads, with (Hot Test) or
without (Cold Test) engine combustion.
    A comparison between Hot and Cold Test on diesel engines production is presented by Fogaça et
al. in [4]. The authors reach the conclusion that the two processes are complementary. In facts, despite
the benefits of the Cold Test related to the reduction of the number of persons involved, the
administrative processes and cycle time [5,6], the Hot Test allows to test several fundamental critical
aspects that cannot be tested in the Cold Test, i.e. the leaks of diesel, water, oil, exhaust and intake
systems; the pressure and temperature of the water and of the turbine; the engine power over all the

              Content from this work may be used under the terms of the Creative Commons Attribution 3.0 licence. Any further distribution
              of this work must maintain attribution to the author(s) and the title of the work, journal citation and DOI.
Published under licence by IOP Publishing Ltd                          1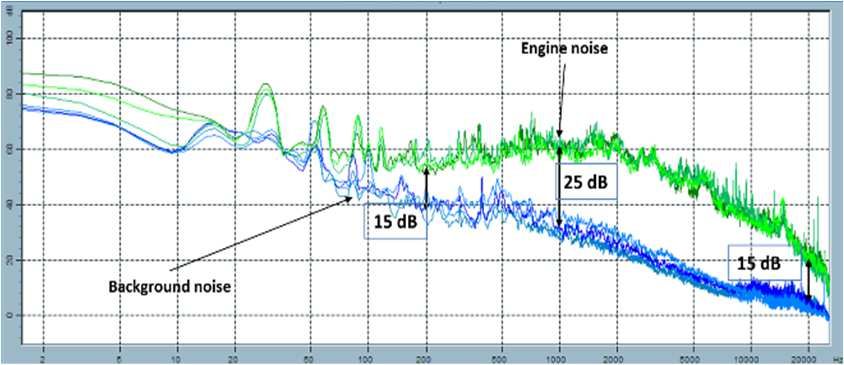
AIVELA XXVII Annual National Meeting                                                         IOP Publishing
Journal of Physics: Conference Series           1589 (2020) 012008     doi:10.1088/1742-6596/1589/1/012008

rpm functioning range; the vacuum pressure, the internal pressure (Blow By) and the smokes
measurement [2]. Due to these peculiarities of the Cold and Hot Test, for small-sized engines it is
common the passage of 100% of the production in a Cold Test process and for a small percentage in
the Hot Test [7]. Besides the monitoring of electro-mechanical, thermo and fluid-dynamic parameters
of engines, also from vibro-acoustic signatures important information on the engine state of health
(condition monitoring) or to detect faults (fault detection) can be extracted. Moreover, as the vibro-
acoustic acquisition technique is a non-intrusive technique and it can detect a wide range of
mechanical faults, it is well considered among engine manufacturers.
    Vibration monitoring techniques is the most commonly employed technique. It is done by means of
accelerometers that must be mounted on different part of the bench or of the engine. Apart the
selection of acquisition parameters and digital filtering [8], one of the most critical aspect that limits
the application of the vibration monitoring in EOLs is the mounting of sensor on the engines. This
arise two main issues: the first is that the mounting time is often incompatible with high production
volumes; the second is the responsibility of the operators that must mount external objects on engine,
when it has already passed several quality controls. For these reasons the vibration monitoring is
mostly used in the design phase of engine, or in engine durability testing or other special tests [9]
where both the previous limitation can be overcome. In EOL test cabins, the use of microphone
sensors has been less diffuse for several reasons: the variability of the noise field inside the test cabins,
the high background noise, the weakness of microphones inside so hard environment.
    This paper describes the application and development phases of an acoustic based fault diagnosis
system, its integration inside hot test cabins, the main issues and limitation emerged, and results
obtained with the application of a fault diagnosis over many diesel engines in EOL. Using specific
technical solutions, the acoustics approach has showed to be sufficiently compatible with the
peculiarities of the industrial environment, providing reliable and repeatable results. These latter have
been demonstrated also by comparison with the traditional accelerometer technique. All the activities
described in the paper have been carried out in an industrial plant that produces engines for
automotive.

2. Hot Tests cabins
The industrial plant, where the acoustic system for EOL engines diagnosis has been implemented,
produces Internal Combustion Engines (ICE) for the automotive sector, and it has both, cold and hot
test cells or cabins. Due to the limits of the cold tests, there was a strong interest to implement further
NVH diagnoses simulating the real functioning conditions of the engines, along all the RPM and
Torque ranges, as the hot tests. In particular, the different hot tests on engines are carried out in two
different cabins: the QM (Motor Quality check) and ST (Special Tests) cabins. While the QM cabins
provide relatively fast tests (30-60 min) to verify the engine quality, the ST cabins are used to perform
very long tests, lasting also several hours. Once the production of the engines has reached the fully
operational level, only part of the production volume is tested in these cells. To investigate the faults
of engine's components or of their assembling (e.g. gear and bearing defects, unbalancing of rotating
parts, pulleys, belts drive, mismatching pistons-cylinders) [10], most part of the engines which pass
through the ST cabins are undergo to diagnostic accelerometric measurements. In these cabins, thanks
the long tests time, it is possible to dedicate specialists that mount the accelerometers, fix the wires
and supervises the test, to monitor the vibration signatures on different parts of the engine. On the
other way, this modality is incompatible with the QM cabins.
    In order to extend the possibility to apply the NVH technique to a higher number of engines at the
end of the assembly line, several preliminary measurements have been carried out during the regular
production both, in the ST cabins and then in the QM. The measurements aimed to verify if thanks to
the microphonic NVH technique was possible to increase the number of engines tested in Hot Test
cabins during the production.

                                                      2
AIVELA XXVII Annual National Meeting                                                     IOP Publishing
Journal of Physics: Conference Series         1589 (2020) 012008   doi:10.1088/1742-6596/1589/1/012008

    For this aim, the possibility to adopt a microphonic monitoring system in Hot Test cabins, has been
preliminary verified in ST cabin, through the analysis of the detection capability. Then the system has
been implemented and integrated in the QM cabins. At the end, the monitoring system has processed
all engines during the production giving back information about the validation of the final product.

3. Analysis of the Signal Noise Ratio inside the ST cabin
In this phase the background noise levels generated by the different noise sources, inside or outside,
the cabin has been measured and compared with that measured in proximity of different parts of the
engine. All this allowed to estimate the expected Signal Noise Ratio (SNR) during the fault diagnosis
inside the plant.

3.1. Movable measurement equipment
A movable trolley in metal bars with 3 sliding arms and hinged endings to position the microphones
near the desired zone, has been built (Fig. 1). The endings have been equipped with special guides
hosting a microphone and a laser (Fig. 1). The latter pointed the target position on the engine. To
reproducibility of the measurement position has been ensured by the measurement of the distance
between the microphone and the target point. The trolley was equipped with a laptop containing an
acoustic elaboration software. The laptop was connected to a sound and vibration USB device (NI-
4432) and 1/2'' CCP Free-field microphones (GRAS 46AE) and a high-frequency industrial and
ceramic shear ICP accelerometer (623C01 PCB). The calibration of the measurement chains has been
guaranteed using a sound level calibrator that emits 1 kHz pure tone at 94 dB and a handheld shaker of
1g at 159.2 Hz (394C06 PCB). To synchronize the acoustic and vibrational measurements with the
engine RPM a multifunction Tachometer (PLT 200 Monarch ROS) has been mounted on the bench of
the cabin pointing a rotating element of the engine. An accelerometer was also mounted on the engine
basement through a double threaded screw.

    Figure 1 – Movable measurement system. From left to right: the sliding arms with endings; the
trolley with laptop; the scheme and the photos of the special guide for microphone and laser.

3.2. Background noise from the plant’s activities inside the ST cabin.
   The measurements of background noise were carried out at one of the ST cabins of the plant,
during the full production. Two measurements points were positioned outside, at the two entrances of
the cabin (Figures 2 (left): orange FFT; (right): violet FFT), and inside the cabin, in two more
measurement position.

   Figure 2 – Comparison between outside and inside background noise in ST cabin (opposite sides).

                                                   3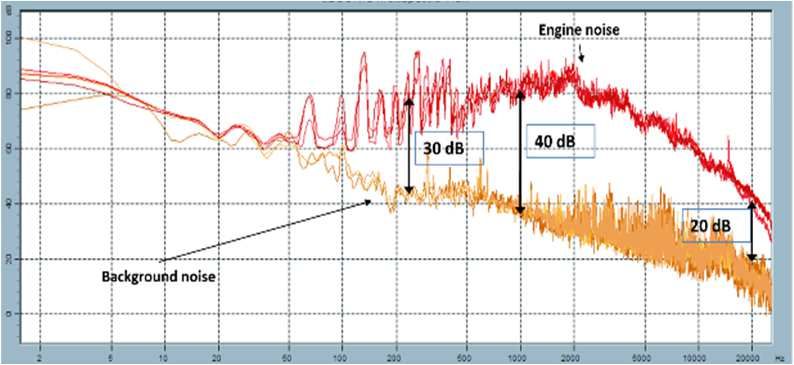
AIVELA XXVII Annual National Meeting                                                    IOP Publishing
Journal of Physics: Conference Series        1589 (2020) 012008   doi:10.1088/1742-6596/1589/1/012008

   In the frequency range 50 Hz - 9 kHz, the noise inside the cabin resulted significantly lower than
the outside (> 15 dB). This made neglectable the influence of the activities of the plant on the
measurements inside the cabin.

3.3. Background noise of the auxiliaries installed inside ST cabin.
    To verify the compatibility of the acoustic monitoring usage inside ST cabin, the background noise
engendered by the auxiliaries systems of the cabin (ventilation system for exhaust, water pump, oil
pump, diesel pump) has been measured at three different working conditions, called "Condition", and
in 5 positions around the bench of the ST cabin. A fourth condition has been added when also the air
jets for turbocharger cooling were activated. The sound levels at the four conditions have been
compared with those produced by a 140 hp diesel engine mounted on the bench (Figure 3).

             Figure 3 – ST cabin scheme with the 5 microphone positions around the bench.

   Below the synthetic descriptions of the noise sources actives at the different conditions:
      - Condition 0: All the noise sources of the cabin are off and the noise is only due to the
          activities outside the cabin;
      - Condition: The ventilation system was set to the minimum; the water and diesel pump was
          on. This condition is representative of the test up to about 2000 engine rpm;
      - Condition 2: the same of Condition1 but with the ventilation system set to the maximum.
          This condition is representative of tests with the engine above 2000 rpm. At this level the
          air jets for turbocharger cooling were forcibly kept off;
      - Condition 3: the same of Condition2 but with the air jets for turbocharger cooling on.

    Results of measurements of the background noise level of auxiliaries showed that noise levels
increase slightly passing from Condition 0 (69-73 dB), to Condition 1 (72-76 dB), up to Condition 2
(77-87 dB), while they increase dramatically and at wideband, when the air jets for turbocharger
cooling are activated (97 dB). The latter condition is the only one incompatible with the detection of
the engine noise signature. This resulted by the measurements of the engine noise. Figure 4 shows:
left) the engine noise levels at 800 rpm compared with the background noise at Condition 1; and right)
the engine noise levels at 4000 rpm compared with the background noise at Condition 2. For both the
configuration the SNR was higher than 15 dB in all the range 100 to 20 kHz.

   Figure 4 –Comparison between the engine noise and the background noise of auxiliaries. left)
engine at 8 krpm and background noise at Condition 1; right) engine at 4 krpm and background noise
at Condition 2.

                                                   4
AIVELA XXVII Annual National Meeting IOP Publishing
Journal of Physics: Conference Series 1589 (2020) 012008 doi:10.1088/1742-6596/1589/1/012008
4. Preliminary of faults in ST and QM cabins.
4.1. Fault, test conditions and main results
Four different defects have been produced by the plant engineers in coordination with the
management, to simulate potential faults at the EOL of the production. The defects were selected
among the most recurrent of four categories: Gears, Balancing, Power Transmission and
Turbocharger. For each defect, three different engines were prepared and tested. Further three
“reference” engines were used to represent the engine without defects. A simple working cycle has
been prepared to test the engines in ST cabin at different operative conditions (i.e. rpm, torque). It
consisted of different phases which were used to investigate individually the different defects: 1)
Idling, at about 800 rpm; 2) Run up, 800 to 4000 rpm; 3) Stationary condition at 4000 rpm; 4) Descent
ramp, 4000 to 800 rpm; 5) Idling, at about 800 rpm. The measurements have been analyzed in terms of
FFT (phases 1, 3 and 5) and Orders (phases 2 and 4) in post processing, by means of the software dB
SONIC.
The comparisons between the results obtained with the “reference” engines and those with defects,
have showed that for three of the four defects (B, PT and T), the acoustic signatures allowed to
distinguish clearly among good (reference) and bad (faulty) engines. For two of them the differences
(B and PT) at specific frequency, or order, were greater than 10 dB.
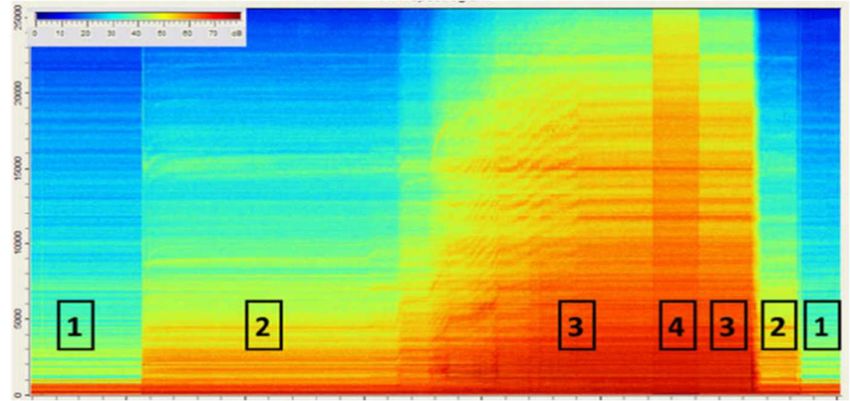
The same equipment was used to repeat the above preliminary measurements also in one of the QM
cabin of the plant. Figure 5 shows the spectrogram of 4 different operative conditions in the QM
cabins: 1) Auxiliaries on and the ventilation system at the minimum; 2) Auxiliaries on, ventilation
system at the minimum and engine in idle; 3) Auxiliaries on, ventilation system at the maximum and
engine run up; 4) same of 3 but with air jets for turbocharger cooling activated.
Figure 5 –Spectrogram of the noise at different phase of the cycle.
The results confirmed that, also in QM cabins, the influence of the background noise of auxiliaries
is neglectable. The background noise level was 10 dB less than the engine noise, in almost all the
spectrum. The use of air jets for turbocharger cooling has confirmed to be completely incompatible
with the microphonic NVH technique.
5. Integration in the QM cabins
To apply the microphonic NVH technique to a higher number of engines during their production,
the above system has been integrated in the QM cabins. Integration concern, mainly, in the following
aspects:
- Positioning of the microphones in the cabin;
- Connection to the acquisition system;
- Definition of special NVH sub-test cycle;
- Software communication and synchronization with test cycle in cabin.
5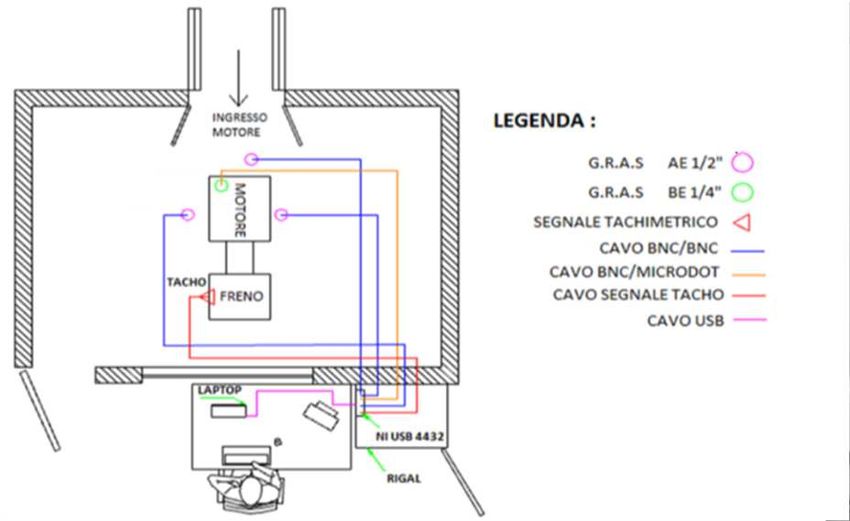
AIVELA XXVII Annual National Meeting                                                      IOP Publishing
Journal of Physics: Conference Series         1589 (2020) 012008    doi:10.1088/1742-6596/1589/1/012008

    The microphones were installed in fixed positions around the bench. The positions were defined in
such a manner to be close as possible to specific parts of the engine (targets) to optimize fault
detectability. The chosen positions had to avoid any interference with: i) the automatic systems used to
position the engine on the bench; ii) with the engine handling, rigging, clamping, filling, draining
activities. Additionally, they must guarantee the effectiveness of the ventilation systems.
    As, during the test, the microphones can be exposed to risky conditions: hot temperature, spay or
jets (water, oil, or diesel), vibrations and hits, and they need of a continuous calibration of the
measurement chain, a special cylindric shield has been designed to protect the microphonic membrane
and to execute a quick and accurate calibration (Fig. 6). A rough version of the cylindric shields was
mounted by collars and fixed to dedicate brackets on the bench, after having compared different
options (Tab. 1).

                   Figure 6 – Special cylindric shield. left) 3d model; right) prototype.

                       Table 1. Qualitative assessment of the different supports.

   Type of support       Repeatability        Robustness       Distance from         Interference
                                                               measuring point      with operators
    Magnetic                   **                  *                   **                    *
    Collars fixed to         ***                  ***                  *                    **
    the frame
    Collars fixed to          ***                 **                  ***                   ***
    brackets
                         * insufficient      ** sufficient         *** good

   The acquisition device (NI USB 4432), was installed inside a cabinet of the QM cabin (Fig. 7). It
was connected to the microphones positions through cables installed along protected paths under the
floor of the cabin. The speed rotation of the engine shaft was derived by the signal coming from the
dynamometric brake in the cabin.

                             Figure 7 – Integration of the acquisition system

                                                    6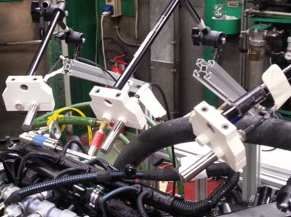
AIVELA XXVII Annual National Meeting                                                        IOP Publishing
Journal of Physics: Conference Series           1589 (2020) 012008    doi:10.1088/1742-6596/1589/1/012008

    Traditionally, the tests in QM cabins consist of several stages and ramps that engine follows in
different working conditions (e.g. torque, rpm) to analyze specific aspects of the engine functioning.
Customized combinations of these phases (test cycles) are prepared to analyze the engine
performances and to monitor electro-mechanical and thermo-fluid-dynamic variables (for about one
hour). To avoid interferences between traditional test cycles and to answer to the needs introduced by
the (microphonic) NVH test, further phases (for about 5 min) were added. As during the NVH cycle
the air jets for turbocharger cooling must be kept off, the run-up ramps’ slope and the interval between
them were selected to preserve turbocharger from overheating.
    The NVH cycle has been implemented in a Labview based software (AS SMART). The software
was configured to analyze (FFT Spectrum and Order analysis) specific faults belonging to the
categories: Gears, Balancing, Power Transmission and Turbocharger. After a first period, the collected
data were reviewed and statistically analyzed. Then, thresholds and observation windows were defined
to provide simple outputs to operators (Pass, Warning, Fail, Out Of Range).

6. Main result during the production
    The integration of the systems has been completed on 8 different QM cabins. The operators were
trained to make maintenance to the equipment to preserve its efficiency and integration. None of them
complained serious interferences due the presence of the microphonic NVH system in the cabins.
    During the first months of production, the QM cabins at the end of the production line received
about 3700 diesel engines. They were tested the engines with traditional test cycle, plus NVH cycle.
To confirm the “Fail” obtained at the first stage, faulty engines were moved to a second QM cabin to
repeat the test. Some of them were tested once more in the ST cabin, using the accelerometric NVH
test.
    The results of this period have showed that:
- 52 defects, type “Gear”, were detected after double microphonic NVH test. All of 8 engines were
confirmed Fault when tested in ST cabins;
- 2 defects, type “Balancing”, were detected as Fault and confirmed by visual inspection.
- 1 defect, type “Power Transmission”, was detected as Fault. It wasn’t tested in ST cabin.
- 1 defect, type “Turbine”, was detected as Fault. It was confirmed by the accelerometric NVH test in
ST cabins.

7. Conclusions
    The paper has presented the development phases and the results of the industrial experimentation of
an EOL system which use the microphonic NVH to extend to a larger number of engines the NVH
tests in Hot Test cabins. The results have confirmed the compatibility of that technique with the
industrial production. It has been verified analyzing the engines with the Fail alert, by visual
inspections and by a further accelerometric NVH test in ST cabins.
    The industrial experimentation, which continued up to 7000 engines, has also showed that the
training and the care of the cabins' operators is crucial to guarantee the efficiency of the results and the
preservation of the acquisition system. Low attention of operators can lead to an increasing number of
alerts and to an increase of the costs for the replacement of microphones.
    Automatic controls could help to verify at the beginning of each test the integrity and efficiency of
the sensors.

References
[1] Klippel K. (2011). End-of-line testing. In: Assembly Line - Theory and Practice, Ed. by
        Waldemar G., Rijeka (Croazia): InTech;
[2] Ferguson C.R. and Kirkpatrick A.T. (2016). Internal Combustion Engines - Applied
        Thermosciences, Chichester (United Kingdom): John Wiley & Sons Ltd;
[3] Chong K.E. and Lim K.S. (2013). CONWIP Based Control of a Semiconductor End of Line
        Assembly, Procedia Engineering, 53, 607-615;

                                                      7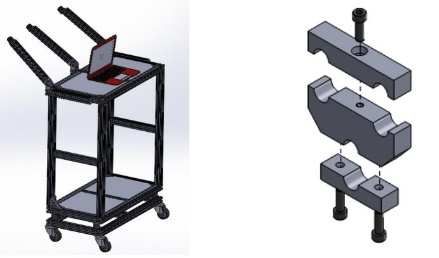
AIVELA XXVII Annual National Meeting                                                    IOP Publishing
Journal of Physics: Conference Series        1589 (2020) 012008   doi:10.1088/1742-6596/1589/1/012008

[4]  Fogaça P., de Souza D.L. and Manéa F. (2018). Comparison between cold and hot test
        procedures in a company manufacturer of diesel engines. Gestao & Producao, 25(2), 343-
        353;
[5] Delvecchio, S., Dalpiaz, G., Niculita, O., and Rivola, A. (2007). Condition monitoring in diesel
        engines for cold test applications. Part I: vibration analysis for pass/ fail decision. In:
        Proceedings of the 20th International Congress & Exhibition on Condition Monitoring and
        Diagnostic Engineering Management. Portugal;
[6] Martyr, A.J. and Plint, M.A. (2012). Engine testing the design, building, modification and use of
        powertrain test facilities. Elsevier: Boston (USA);
[7] Gagneur, J. (1999). Improving diesel engine cold testing diagnostic capabilities. Michigan:
        Diesel Progress North American Edition, Diesel and Gas Turbine Publications, Gale Group;
[8] Delvecchio, S. (2012). On the use of wavelet transform for practical condition monitoring.
        advances in wavelet theory and their applications in engineering, physics and technology.
        Ed. by Baleanu D. InTech, Rijeka, Croatia
[9] Atkins, R.D. (2009). An introduction to engine testing and development. Warrendale: SAE
        International;
[10] Xin, Q. (2011). Diesel engine system design. Woodhead Publishing Limited,

                                                  8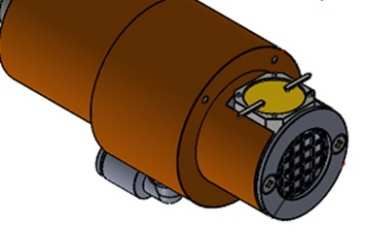
You can also read