Oxygenated Fuels in Compression Ignition Engines

Page created by Daniel Simpson
 
CONTINUE READING
Oxygenated Fuels in Compression Ignition Engines
C OVER STORY      Fuel s

Oxygenated Fuels in
Compression Ignition Engines
Internal combustion engine technology can also be applied in order to meet future greenhouse
gas and pollutant emission targets, if the fuel characteristics are included as free parameters within
the optimization of the powertrain. Therefore, a BMWi-funded consortium investigated oxygenated
low-carbon fuels for the application in compression ignition engines, in order to study their combustion
and pollutant formation properties on the engine and within a vehicle application.

                                                                                                           © Ford

26
Oxygenated Fuels in Compression Ignition Engines
MOTIVATION                                  powered by synthetic fuels from renew­
                                                                         able sources are promising in addition
                             The reduction and avoidance of Green­       to disruptive concepts such as battery
                             house Gases (GHG) has become one of         electric vehicles.
                             the most important technology drivers
                             for industrial applications worldwide
                                                                         REQUIREMENTS FOR
                             to limit global warming. In particular
                                                                         SUSTAINABLE SYNTHETIC FUELS
                             the transport sector, which is one of the
                             major contributors to GHG emissions,        Renewable synthetic fuels have become
                             is in the focus of political and social     an important subject to powertrain
                             debates. Additional efforts are required    research in recent years. However,
                             in order to reduce CO2 concentration        selection the most promising fuel can­
                             in the atmosphere and thus limit glo­       didates for future vehicle applications
                             bal warming. Evolutionary approaches        requires specific criteria to bundle
                             based on internal combustion engines        research and development resources.
                                                                         Those are:
                                                                         –– Actual CO2 reduction: Synthetic fuels
                                                  AUTHORS                   must show CO2 reduction on the vehi­
                                                                            cle usage for short-term introduction,
                                                                            as CO2 legislation is currently tank-
                                                                            to-wheel-based. Applications of syn­
                                                                            thetic fuels should therefore not
                                                                            exceed the CO2 emission of current
                                                                            fossil fuels (diesel as benchmark).
                                        Dr.-Ing. Werner Willems
                                                                         –– Reduction of pollutants: New fuels
                              is Technical Spezialist Sustainable           should not only avoid CO2 emission,
                                     Fuels Research at the Ford             but also pollutants.
                                 Research and Innovation Center          –– Availability and costs: CO2 avoidance
                                           in Aachen (Germany).
                                                                            is a problem which requires immidiate
                                                                            action. The development of standards
                                                                            for new fuels and the introduction into
                                                                            type approval regulations require time
                                                                            and effort. Therefore, standardized
                                                                            fuels, which are available globally and
                                                                            at reasonable costs, should be favored.
                                     Dipl.-Ing. Marcel Pannwitz
                                 is Development Engineer in the
                                                                         Hence, dimethyl ether (DME, CH3-O-CH3)
                                     division Thermodynamics &           and oxymethylene ether (OME1, CH3-O-
                                          Powertrain Concepts of         CH2-O-CH3) were identified as suitable
                                 IAV GmbH in Berlin (Germany).           and promising fuels for applications in
                                                                         diesel engines. Thus, they were selected
                                                                         for the investigations.

                                                                         DME AS AN ALTERNATIVE FUEL FOR
                                                                         COMPRESSION IGNITION ENGINES
                                            Marius Zubel, M. Sc.         DME was investigated from fundamen­
                                    is Research Assistant at the
                                                                         tal high-pressure chamber tests over
                                   Chair of Internal Combustion
                                  Engines of the RWTH Aachen             single/multi-cylinder engine tests up to
                                University in Aachen (Germany).          vehicle demonstration in order to assess
                                                                         its potential as diesel fuel replacement
                                                                         within the framework of the project.
                                                                         In the following, the physical and chemi­
                                                                         cal properties of DME as the most pro­
                                                                         mising methyl ether will be discussed.

                                            Dr.-Ing. Jost Weber
                                                                         PHYSICAL AND CHEMICAL
                                     is Department Head diesel
                                System at the Denso Automotive           PROPERTIES OF DME
                                      Deutschland GmbH in the
                                     Aachen Engineering Center           It should be noted that due to the
                                         in Wegberg (Germany).           high oxygen content (34.8 % m/m)
MTZ worldwide   03|2020                                                                                         27
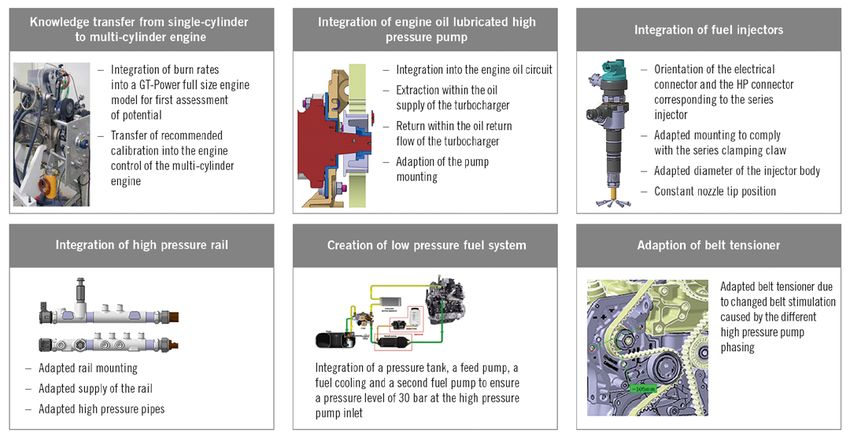
Oxygenated Fuels in Compression Ignition Engines
C OVER STORY                 Fuel s

and the absence of C-C bonds for DME,                    –                                                Unit      EN590 diesel          DME
an almost soot-free combustion can be
                                                         Boiling point                                     °C         180–350            -24.8
achieved. Consequently, higher Exhaust
Gas Recirculation rates (EGR) can be                     Cetane number                                      -           51–54            55–60
utilized in order to reduce NOx emis­                    Density (15 °C)                                 kg/m³           830              671
sion simultaneously. TABLE 1 shows
                                                         Oxygen content                                  % m/m
Oxygenated Fuels in Compression Ignition Engines
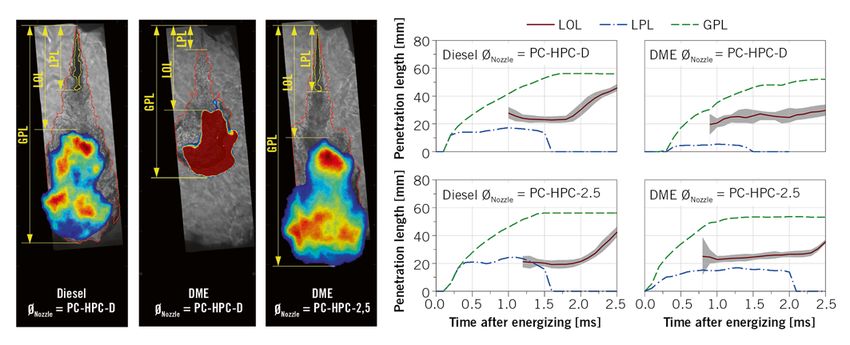
FIGURE 1 Optical investigations of the mixture preparation in the high-pressure chamber [2] (© RWTH Aachen University)

 The ac­t uation duration of the injector                            to the stronger cooling effect of the                                      fuels and nozzle configurations. The
 was ten = 1000 µs and the rail pressure                             ­eva­porating jet.                                                         start of actuation and duration of the
 was set to 1000 bar. Diesel fuel shows a                                                                                                       injector as well as the EGR rate were
 significantly longer liquid jet than DME                                                                                                       adapted depending on the fuel and
                                                                     SINGLE-CYLINDER
 when comparing the LPL using the ref­                                                                                                          nozzle size in order to keep the center
                                                                     ENGINE INVESTIGATIONS
 erence nozzle (PC-HPC-D). This can be                                                                                                          of heat release constant. Only a single
 related to the lower boiling point and                              For the experimental combustion                                            main injection was applied for the tests
 vapor pressure of DME. Here, the vapor                              inves­t igations, a single-cylinder                                        on the single-cylinder engine, in con­
 pressure is very close to the ambient                               engine was derived from the corre­                                         trast to the standard mapping of the
 pressure in the chamber. The phase                                  sponding multi-cylinder engine. It                                         multi-cylinder engine. FIGURE 2 shows
 change of DME from liquid to gaseous                                was equipped with the adapted injec­                                       the comparison between the diesel refer­
 occurs almost immediately, resulting                                tion system components. Characteris­                                       ence measurement and DME with two
 in a shortened LPL. A significant influ­                            tic load points based on mapping data                                      different nozzle hole diameters. The die­
 ence on the LPL at DME was observed                                 from the series diesel engine were                                         sel baseline was measured with the ref­
 for the nozzle with the larger hole dia­                            selected. In the following, an operat­                                     erence nozzle (PC-D) of the series con­
 meter (PC-HPC-2.5). While the penetra­                              ing point at medium load for diesel                                        figuration. The adapted nozzles for com­
 tion depth of the liquid diesel jet showed                          and DME will be analyzed in detail.                                        pensation of the physical properties and
 only a small increase, significant differ­                          The engine boundary conditions                                             injection pressure (PC-1.8 and PC-2.5)
 ences could be observed for DME due                                 were not changed for the different                                         were investigated for DME. The EGR rate

                                                  Diesel (PC-D)          DME (PC-1.8)                       DME (PC-2.5)
          4                                       2,0                                      8                                       12                         FIGURE 2 EGR variation
                                                                            ISCO [g/kWh]

                                                                                                                    ∆p [bar/°CA]

                                                                                                                                                              (n = 1750 rpm; IMEP = 8.6 bar)
                                   ISHC [g/kWh]

          3                                       1,5                                      6                                       10
FSN [-]

                                                                                                                                                              of diesel baseline (PC-D),
          2                                       1,0                                      4                                        8                         DME with scaled nozzle
                                                                                                                                                              (PC-1.8 und PC-2.5)
          1                                       0,5                                      2                                        6                         (© RWTH Aachen University)
           0                                      0,0                                       0                                        4
          45                                      2,5                                      65                                      550
                                                                            BD5-90 [°CA]

          43                                      2,0                                      50                                      500
                                                                                                                    Texh [°C]
ηi [%]

                                   λ spindt

          41                                      1,5                                      35                                      450
          39                                      1,0                                      20                                      400
          37                                      0,5                                      5                                       350
               0     1 2 3 4                            0     1 2 3 4                           0     1 2 3 4                            0     1 2 3 4
                   ISNOx [g/kWh]                            ISNOx [g/kWh]                           ISNOx [g/kWh]                            ISNOx [g/kWh]

 MTZ worldwide            03|2020                                                                                                                                                        29
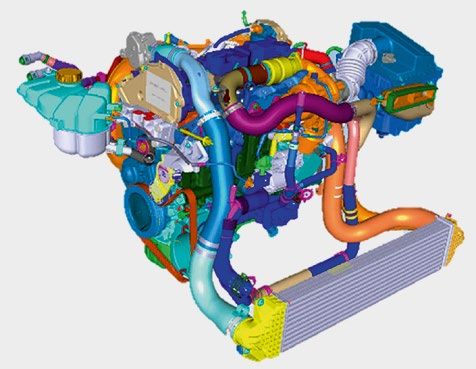
Oxygenated Fuels in Compression Ignition Engines
C OVER STORY                 Fuel s

 Engine specification               Unit            Ford 1.5-l I4 88 kW TDCi

                                                      Compression ignition,
 Combustion system                   –
                                                          four-stroke

 Engine displacement                cm³                       1499

 Rated power                     kW at rpm                 88 at 3600

 Maximum torque                  Nm at rpm             270 at 1500–2500

 Compression ratio                   –                        16.0

 Stroke                             mm                        88.3

 Bore                               mm                        73.5

 Boosting system                     –                 VTG (single-stage)

 Exhaust gas recirculation
                                     –               High-pressure, cooled
 system

TABLE 3 Specification of the test engine (© Ford)

was adjusted to achieve different specific              in case of high-temperature pyrolysis [3].   a lower pressure rise. This behavior
NOx emission levels (ISNOX).                               The specific HC (ISHC) and CO emis­       can be explained by the shorter burn­
   No soot emission corresponding to                    sions (ISCO) are of similar magnitude        ing duration (BD5-90). However, the
the Filter Smoke Number (FSN) could be                  for all three cases. The HC emission of      smaller nozzle (PC-1.8) showed higher
detected even at minimal NOx emission                   DME is lower compared to diesel fuel         EGR tolerances compared to the larger
level for both nozzle configurations with               only at low EGR rates. However, the          one (PC-2.5). Thus, it appears more
DME, FIGURE 2. This behavior is due to                  maximum pressure rise rate shows dif­        advantageous for usage. Another big
the fast mixture formation, the high oxy­               ferences between the three configura­        difference between DME and diesel lies
gen content and the missing C-C bonds                   tions. The measurements with DME             in the difference regarding indicated effi­
[1]. The missing C-C bonds lead to the for­             show higher values despite the higher        ciency (ηi), FIGURE 2. DME has a higher
mation of CO instead of soot precursors                 cetane number, which usually leads to        efficiency relative to diesel, due to the

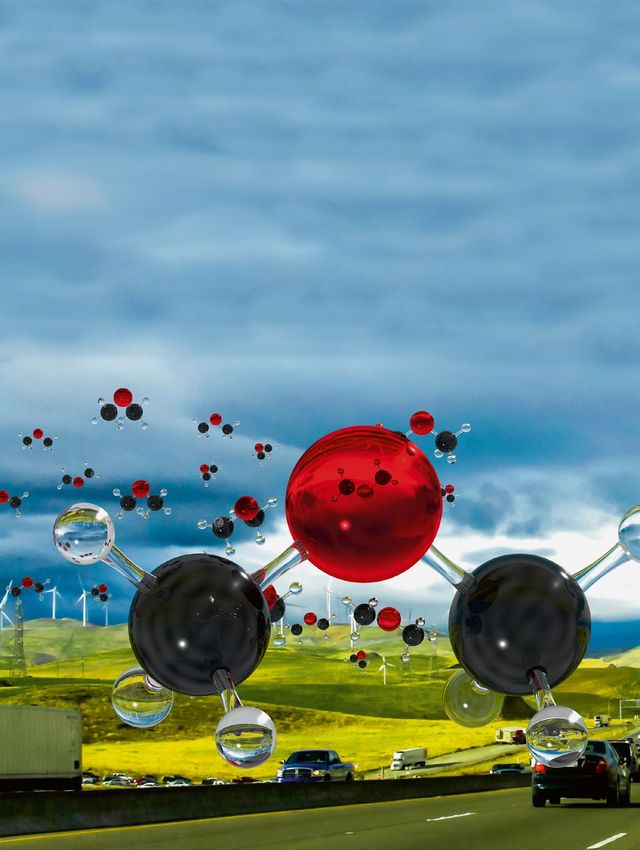
FIGURE 3 Required modifications of the engine hardware (© IAV)

30
shorter burning duration and lower                         ing duration and the resulting lower                                               smaller than 350 bar did not result in
exhaust gas temperature (Texh).                            exhaust gas temperature of DME rela­                                               further benefits. A similar trend could
                                                           tive to diesel fuel. Therefore, the opti­                                          be observed for the variation of the cen­
                                                           mization had to be performed at a                                                  ter of heat release, as an advanced timing
MULTI-CYLINDER ENGINE INVES­
                                                           relatively high specific NOx emission                                              helped to increase the efficiency at simi­
TIGATIONS FOR THE PASSENGER
                                                           (2.0 g/kWh) in order to ensure enough                                              lar CO emission level. The variation of
CAR DME APPLICATION
                                                           flexibility regarding the VTG position.                                            the air-to-fuel ratio showed that lean
A Ford 1.5-l diesel engine was used for                       A rail pressure reduction to 350 bar                                            combustion should take place at least
the engine tests on the dyno and within                    with simultaneous adjustment of start                                              at λ = 1.5. Stoichiometric combustion
the vehicle. The technical specifications                  of injection showed advantages in                                                  comparable to gasoline engines could
of the multi-cylinder engine are shown                     terms of CO and efficiency. The indi­                                              not be achieved, due to the decrease in
in TABLE 3. The engine hardware had to                     cated high-pressure cycle efficiency                                               efficiency and the significantly increased
be adapted to the DME injection compo­                     decreased with reduced rail pressure                                               CO emission. The latter was well above
nents, FIGURE 3. The greatest challenge                    as expected, but the effective engine effi­                                        the value of modern DI gasoline engines.
was the integration of the high-pressure                   ciency increased. This can be explained                                            Additional exhaust gas com­ponents were
pump. The pump was lubricated by the                       on the one hand by reduced friction                                                measured with a particle counter and a
engine oil due to the lack of lubricity of                 losses due to lower drive power demand                                             Fourier Transform Infrared Spectrometer
DME. The belt drive had to be adapted                      of the high pressure pump. On the other                                            (FTIR). The CH4 emission downstream
due to the different phasing position of                   hand, the combustion duration increased                                            of the diesel oxidation catalyst was not
the pump. Moreover, new sensors and                        in comparison to the base measurement                                              affected by the variation of rail pressure
actuators for controlling the high-pres­                   with 720 bar. Consequently, the exhaust                                            and center of heat release. However, it
sure fuel system had to be integrated                      enthalpy increased enabling a higher                                               increased with decreasing air-to-fuel
into the engine control system to enable                   turbocharger efficiency. Thus, the gas                                             ratio and found its maximum of about
engine operation under steady-state and                    exchange losses decreased. A further                                               140 ppm at λ = 1.1. The further reduc­
transient conditions. The engine control                   reduction in rail pressure to values                                               tion of the air-fuel ratio to λ = 1.0 led to a
system, except for the injection parame­
ters, remained in the serial engine con­
trol unit whereas a separate second
                                                                                                Diesel             DME              n = 2000 rpm, BMEP = 7.0 bar, NOx = 2.0 g/kWh = constant, soot = 0.0 FSN
unit controlled the DME injection sys­
tem. The communication between both                                                       Rail pressure variation                    αh50Variation                                   λ Variation
                                                                                          Base rail pressure: 720 bar                Base α                                          Base λ: 1.74
control units is ensured by a specific                                                                                                      h50
                                                                                                                                                : 18 ° CA
CAN interface.                                                                            λ:             1.74                        λ:             1.74                             λ:             varied
                                                                                          αh50 :         18 ° CA                     αh50 :         varied                           αh50 :         14 ° CA
   The measurements on the multi-
                                                                                          Rail pressure: varied                      Rail pressure: 350 bar                          Rail pressure: 350 bar
cylinder engine were conducted at
ten part load and three full load operat­                                             4                                         4                                              4
                                                raw emission
                                                 CO [g/kWh]

ing points. A representative operating
point (n = 2000 rpm, BMEP = 7 bar)                                                    2                                         2                                              2
will be discussed for DME operation to
show exemplarily the approach for cali­                                              0                                         0                                              0
                                                                                    45                                        45                                             45
bration optimization, FIGURE 4. Varia­
tions of the rail pressure, the center of
                                                              ηe [%]

                                                                                    35                                        35                                             35
heat release and the combustion air-to-
fuel ratio at constant NOx emission have                                            25                                        25                                            25
been conducted, while roughly main­                                                 105                                       105                                           105
                                                raw emission

taining the diesel reference calibration
                                                 PN [#/cm3]

and boundary conditions. The tests                                                  104                                       104                                           104
with DME have been done without the
use of a pilot injection in contrast to the                                         103                                       103                                           103
                                              tailpipe emission tailpipe emission

base measurement with diesel fuel, as                                               200                                       200                                           200
                                                                    CH4 [ppm]

the single-cylinder engine test results
                                                                                    100                                       100                                           100
showed promising trends from an
engine noise point of view by applying
                                                                                     0                                         0                                              0
low rail pressure in combination with
                                                                                    40                                        40                                             40
high EGR rates, when using the smaller
                                                  NH3 [ppm]

nozzle hole diameter.                                                                20                                        20                                            20
   The aim of the individual variations
was to achieve a maximum possible                                                     0                                         0                                              0
efficiency with lowest CO emission.                                                    200    350     500    650        800         5      10        15     20       25            1.0    1.5     2.0     2.5   3.0
                                                                                                Rail pressure [bar]                             αh50 [° CA]                                         λ
The turbocharger was one of the limit­
ing factors because of the shorter burn­                   FIGURE 4 Optimization for n = 2000 rpm, BMEP = 7.0 bar at constant NOx emission (© IAV)

MTZ worldwide    03|2020                                                                                                                                                                                31
C OVER STORY                               Fuel s

                              DME optimized                                    Diesel                       n = 2000 rpm, BMEP = 7.0 bar
                4                                                      8                                                            20                                                           20
  FSN [-]

                2

                                                                                                                                                                               dp/dα [bar/°CA]
                                                                       6                                                            15                                                           15

                                                          CO [g/kWh]

                                                                                                                     CO2 [%]
       0/2                                                             4                                                            10                                                           10
  HC [g/kWh]

                1                                                      2                                                             5                                                            5

                0                                                      0                                                             0                                                            0

               50                                              2.5                                                                  65                                                     550

               45                                              2.0                                                                  50                                                     500

                                                                                                                     BD5-90 [°CA]

                                                                                                                                                                           Texh [°C]
 ηe [%]

               40                                              1.5                                                                  35                                                     450
                                                         λ

               35                                              1.0                                                                  20                                                     400

               30                                              0.5                                                                   5                                                     350
                    0     1        2         3       4                     0        1          2            3    4                       0         1        2     3    4                               0       1      2    3       4
                             NOx [g/kWh]                                                NOx [g/kWh]                                                  NOx [g/kWh]                                                 NOx [g/kWh]

 FIGURE 5 EGR-variation after optimization for n = 2000 rpm, BMEP = 7.0 bar (© IAV)

 reduction of CH4 to an emission level                                                  modern DI gasoline engines but tended                                         relative to diesel fuel. The CO emission
 near the detection limit. Here, the                                                    to be of same magnitude or even higher                                        was still high. The map-wide calibra­
 exhaust gas temperature increased                                                      at other operating points, FIGURE 4.                                          tion based on the optimization of the
 substantially (approximately 550 °C)                                                      The final EGR variation was carried                                        steady-state operating points, which
 so that the threshold value for CH4 con­                                               out based on the findings of the optimi­                                      implies the use of a deNOx system
 version in the catalyst was exceeded.                                                  zation, FIGURE 5. The effective engine                                        and a diesel particulate filter, is shown
 However, this threshold value could not                                                efficiency with optimized calibration                                         in FIGURE 6.
 be reached at low loads, due to the over­                                              was almost the same as that of the die­                                          A demonstrator vehicle based on a
 all lower exhaust gas temperature level.                                               sel-powered counterpart. DME offered                                          Ford Mondeo with adapted engine hard­
 The raw emission of the Particulate                                                    an advantage in terms of CO2 emission                                         ware and tank system was developed
 Number (PN) remained well below of                                                     due to the more favorable H/C-ratio                                           for the final prove of concept. It exhib­

                                   NOx [g/kWh]                                                 FSN [-]                                       HC [g/kWh]                                           CO [g/kWh]
               24                                                                                                                                                                                                              Series
                                                                                                                                                                                                                               full load
               18                                                                                                                                                                                                              curve with
                                  5.0
BMEP [bar]

                                                                                                                                                                                                                               diesel fuel
                               3.5

               12                       1.5
                                                                                         0.0                                                 0.5
                                         1.0
                6                         0.5                                                                                         1
                                                                                                                                    1.5.0
                                                                                                                                                                                                       15 0
                                                                                                                                                                                                   10

                                                                                                                        4.0                                                                             2 25
                0

                                            ηe [%]                                                      λ                            dp/dα [bar/°CA]                                                   Texh [°C]
               24
                                                                                                                                                                                                           700
               18
                                                                                                2
BMEP [bar]

                                                                                               1.

                                                                                                                                                                                                       600
                                                                                                                                                       4
                                                                                                                                             3

                                                                                                                                                 5
               12
                                                                                                   1. 1.3

                                                                                                                                                                                                 500
                                            34
                                                                                                     4

                                  40                                                                      5
                                                                                                       1.
                                                                                                                                    6

                                                                                                                                                                               400
                6                           32                                    1.6
                                                                                1.8                                                                                          300
                                             25 0                              2.0                                                                                         200                                         FIGURE 6 DME
                                               2
                0                                                                                                                                                                                                      engine maps (© IAV)
                0

                                                          0

                                                                                                                 0

                                                                                                                                                                  0
                        00

                               00

                                        00

                                                 00

                                                                       00

                                                                                                       00
                                                                                  00

                                                                                           00

                                                                                                                        00

                                                                                                                                         00

                                                                                                                                                   00

                                                                                                                                                            00

                                                                                                                                                                       00

                                                                                                                                                                                     00

                                                                                                                                                                                                       00

                                                                                                                                                                                                               00
               50

                                                         50

                                                                                                                50

                                                                                                                                                                 50
                    10

                             15

                                       20

                                                25

                                                                   10

                                                                                                    25
                                                                                15

                                                                                          20

                                                                                                                     10

                                                                                                                                    15

                                                                                                                                              20

                                                                                                                                                           25

                                                                                                                                                                      10

                                                                                                                                                                             15

                                                                                                                                                                                                  20

                                                                                                                                                                                                             25

                        Engine speed [rpm]                             Engine speed [rpm]                            Engine speed [rpm]                               Engine speed [rpm]

 32
FIGURE 7 Emission improve-
                                                                                                                       ment of DME relative to
                                                                                                                       diesel in WLTC (© IAV)

ited the findings from the multi-cylinder   as sustainable fuels for diesel engine
engine investigations.                      applications in passenger cars and com­
   The emission potential of DME com­
pared to diesel fuel in WLTC is shown
                                            mercial vehicles in the “XME-diesel”
                                            project. DME in particular proved to be
                                                                                                                 THANKS
in FIGURE 7 and evaluated with regard       a promising candidate as a substitute for           The authors thank the German Federal Ministry of

to raw emissions of particulates and        fossil diesel fuel, considering different           Economics and Energy for their support of the

NOx as well as for CO2 emission down­       requirements for future sustainable fuel            project and TÜV Rheinland, especially Dr. Bernhard

stream of the exhaust aftertreatment        solutions for combustion engines (TtW               Koonen, and the Forschungsvereinigung Verbren-

system. The soot/NOx trade-off of the       CO2 and emission reduction, available               nungskraftmaschinen (FVV) for their organizational

classic diesel combustion was no lon­       standards, global availability and low              support. In addition, the authors the authors would

ger present for DME combustion. The         costs). The performance of DME from                 like to thank their partners from the Technical

particulate mass could be brought to        basic injection chamber measurements                University of Munich, Dr. Martin Härtl, Kai Gaukel,

zero emission level, while NOx emis­        to single-cylinder and multi-cylinder               M. Sc., and Dominik Pelerin, M. Sc., who covered

sion relative to diesel operation could     tests to a demonstrator vehicles (Ford              the heavy-duty applications in the project as well as

also be reduced significantly (-33%).       Mondeo) were analyzed and demon­                    Oberon Fuels and Prins-Westport, who supported

The CO2 emission level remained             strated within the project.                         the project as well.

almost the same. A low pollutant emis­
sion and nearly CO2-neutral operation       REFERENCES
could be achieved by pro­viding the fuel    [1] Westbrook, C. K.; Pitz, W. J.; Curran, H. J.:
                                            Chemical kinetic modeling study of the effects
from regenerative sources (E-DME) and       of oxygenated hydrocarbons on soot emissions
a well-to-wheel consideration.              from diesel engines. In: The journal of physical
                                            chemistry A (2006), 110 (21), pp. 6912–6922
                                            [2] Ottenwaelder, T.; Pischinger, S.: Effects of
CONCLUSION                                  Biofuels on the Mixture Formation and Ignition
                                            Process in diesel-Like Jets. SAE Technical Paper
As part of the technical program „Neue      2017-01-2332, 2017
Fahrzeug- und Systemtechnologien“           [3] Fischer, S. L.; Dryer, F. L.; Curran, H. J.:
                                            The reaction kinetics of dimethyl ether. In:
funded by the German Federal Ministry
                                            High-temperature pyrolysis and oxidation
of Economics and Energy, methyl ether       in flow reactors. In: International Journal of
fuels (DME/OME1) were investigated          Chemical Kinetics (2000), 32, pp. 713-740

MTZ worldwide    03|2020                                                                                                                        33
You can also read