Distributed fiber optic monitoring of a CFA pile with a central reinforcement bar bundle
←
→
Page content transcription
If your browser does not render page correctly, please read the page content below
Front. Struct. Civ. Eng.
https://doi.org/10.1007/s11709-020-0581-z

    RESEARCH ARTICLE

Distributed fiber optic monitoring of a CFA pile with a
central reinforcement bar bundle
Yi RUIa* , Nicholas de BATTISTAa, Cedric KECHAVARZIa, Xiaomin XUa, Mei YINb
a
    Centre for Smart Infrastructure and Construction, Department of Engineering, University of Cambridge, Cambridge CB2 1TN, UK
b
    Department of Engineering, University of Cambridge, Cambridge CB2 1TN, UK
*
    Corresponding author. E-mail: ruiyi1123@gmail.com

                  © The Author(s) 2021. This article is published with open access at link.springer.com and journal.hep.com.cn
ABSTRACT In this paper, we present an application of distributed fiber optic sensor (DFOS) technology to measure
the strain of a continuous flight auger (CFA) test pile with a central reinforcement bar bundle, during a static load test
carried out in London. Being distributed in nature, DFOS gives much more information about the pile performance as
compared to traditional point sensors, such as identifying cross-sectional irregularities or other anomalies. The strain
profiles recorded along the depth of the piles from the DFOS were used to calculate pile deformation (contraction), shaft
friction, and tip resistance under various loads. Based on this pile load test, a finite element (FE) analysis was performed
using a one-dimensional nonlinear load-transfer model. Calibrated by the shaft friction and tip resistance derived from the
monitored data, the FE model was able to simulate the pile and soil performance during the load testing with good
accuracy. The effect of the reinforcement cage and central reinforcement bar bundle were investigated, and it was found
that the addition of a reinforcement cage would reduce the pile settlement by up to 20%.

KEYWORDS continuous flight auger pile, static load test, central reinforcement bar bundle, distributed fiber optic sensor,
finite element, load transfer

1      Introduction                                                instruments in piles [8]. Thanks to the successful
                                                                   implementation of FOS in many pile load tests in the
The pile load test is a well-established technique for             UK, it is now included alongside conventional instrumen-
validating foundation design in general, as well as for            tation in the specification guidelines for piling and
proving the suitability of a specific pile design based on          embedded retaining walls [9].
site investigation before construction. Due to the crucial            Commonly used FOS in structural health monitoring are
importance of this technique in pile construction, Clause          based on either fiber Bragg gratings (FBG) [10–13],
7.5 of Eurocode 7 lays down requirements for pre-                  Brillouin optical time-domain analysis (BOTDA) [14–18],
construction pile load testing [1] to eliminate potential          or Brillouin optical time-domain reflectometry (BOTDR)
uncertainties in the pile design, such as soil properties and      [19–24]. BOTDR-based distributed fiber optic sensing
construction influences. On the other hand, in practice, it         (DFOS) technology measures changes in strain and
has been found that there are still some uncertainties about       temperature using back-scattered light along the entire
the interpretation of test results due to the limitations of       length of fiber optic cables at a high spatial density. Hence,
instrumentation. Conventional instrumentation includes             in pile load tests, DFOS has a distinct advantage over
electric resistance and vibrating wire strain gauges,              conventional sensor technologies or even FBG, due to its
accelerometers, axial load cells, and extensometers [2–7].         capacity to provide spatially quasi-continuous data, and
Recent advances make use of fiber optic sensors (FOS),              hence enable the localization of anomalies along the pile
based on either Rayleigh, Raman, and Brillouin scattering          depth. DFOS also provides an opportunity to examine in
or Bragg diffraction, as an alternative to traditional             more detail the soil behavior and pile-soil interactions
                                                                   during the pile load test.
Article history: Received Aug 25, 2018; Accepted Jan 4, 2019          This paper deals with the pile testing instrumentation of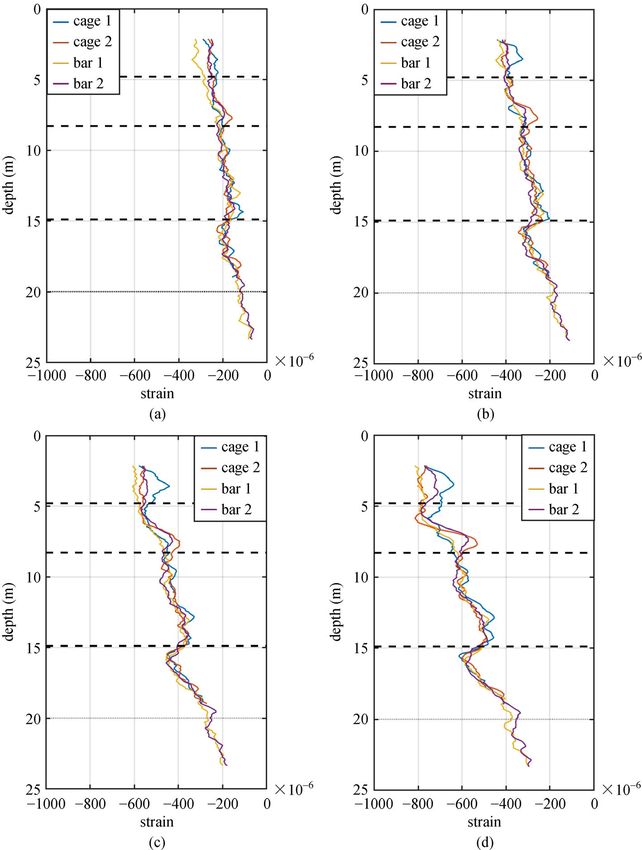
2 Front. Struct. Civ. Eng.
a cast-in situ reinforced concrete pile with a central frequency shift in this temperature cable independently.
reinforcement bar bundle. This pile was constructed using After substituting into Eq. (1), strain changes can be
the continuous flight auger (CFA) method, and DFOS calculated using the Brillouin frequency change measured
(BOTDR) was used to supplement traditional pile testing in the strain cable.
instrumentation. The added value that DFOS technology
can bring is demonstrated with extracts from the monitor- 2.2 Pile testing and instrumentation
ing data during the static load test. The pile displacement,
strain and load transfer behavior were simulated by a In this study, a static maintained load test was performed
simple one-dimensional (1D) load transfer finite element on a CFA test pile in London. The purpose of this test was
(FE) analysis. Finally, the effects of the central reinforce- to investigate the strain and settlement of the pile under
ment bar bundle and reinforcement cage on the load different vertical compressive loads, which defines the
carrying capacity of the pile were investigated using this load-carrying capability of the pile for a range of
FE model. displacements.
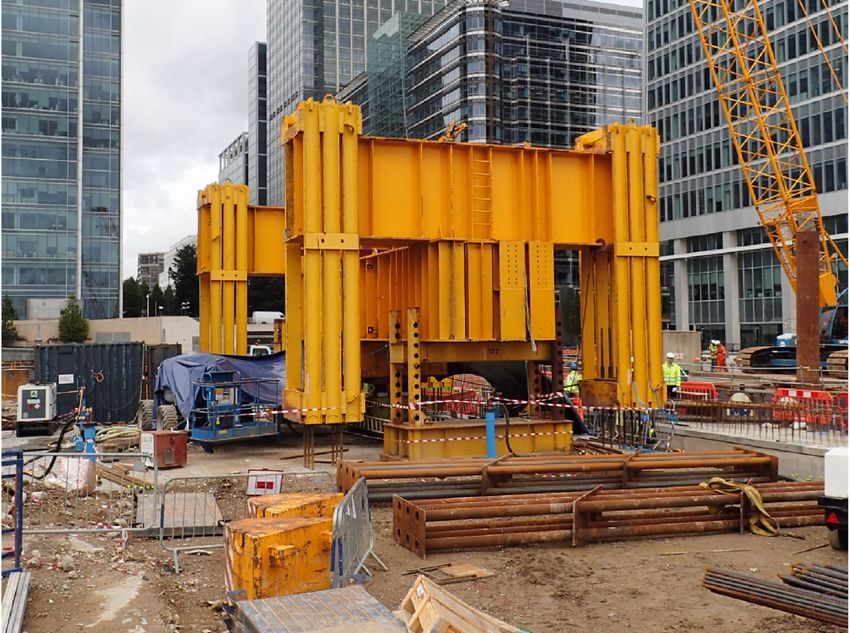
The design length of the test pile was 25 m with a
nominal diameter of 900 mm and a reinforcement cage
2 Testing of the concrete pile using DFOS diameter of 750 mm, as shown in Fig. 1. This test pile
included a 20 m long reinforcement cage and 25 m long
2.1 DFOS technology central reinforcement bar bundle, such that the upper 20 m
of the pile were reinforced with both cage and bar bundle,
DFOS technology measures strain and temperature varia- while the lower 5 m of the pile were reinforced only with
tions using back-scattered light along the length of fiber the central bar bundle. The soil stratigraphy in the testing
optic cables, which act as a continuous series of closely area consisted of made Ground, alluvium, River Terrace,
spaced sensing points. As light travels through the optical and Lambeth Group clay.
fiber, Brillouin scattering is caused by the interaction of the To measure the strain along the whole depth of the pile
incident light wave photons with propagating density during load testing, the DFOS cables were installed on the
waves or acoustic vibrations (phonons). These acoustic cage in U-shaped loops (Fig. 1). Each loop consisted of
vibrations are affected by density and refractive index two FO cables: a loose-tube temperature cable, and a
fluctuations induced by temperature or strain changes [25]. tightly-bonded strain cable, with the latter being pre-
The Brillouin scattering is inelastic and the photons may strained by hand before being fixed in place on the
lose or gain energy (Stokes and anti-Stokes processes) and reinforcement. The temperature cable was used for
create or absorb phonons. This shift in photon energy temperature compensation of the strain measurement.
corresponds to a shift in the frequency of the scattered light The two cables were fixed to the pile reinforcement at
wave, which is referred to as the Brillouin frequency shift. the top and bottom, and held loosely along the reinforce-
A change in strain (Δε) or temperature (ΔT ) at any point ment with intermediate cable-ties to prevent cable deflec-
along the optical fiber is equivalent to a relevant shift in the tion during concrete pouring. A similar DFOS cable pair
Brillouin frequency (Δvb ) at that location, which can be loop was also installed on the central bundle of reinforce-
detected using Brillouin optical time domain reflectometry ment bars. Further details about the instrumentation in this
(BOTDR). Under normal environmental conditions, this pile is provided by de Battista et al. [28].
frequency shift varies with changes in longitudinal strain A Yokogawa AQ8603 BOTDR spectrum analyzer was
and temperature in the fiber core/cladding [26,27]: used to take readings of Brillouin frequency from the
DFOS cables. The spatial resolution of the analyzer was 1
Δvb ¼ Cε Δε þ CT ΔT ; (1) m and the sampling resolution (the distance between two
where Cε and CT are the strain and the temperature consecutive sampling points digitised by the analyzer) was
coefficients of the Brillouin frequency shift for the DFOS 0.1 m. Hence, each instrumented 20 m-long side of the pile
cables, which were 497 MHz/% and 0.96 MHz/°C in this cage provided 200 data points of strain and temperature
study, respectively. measurements.
As discussed above, the Brillouin frequency is affected During the load test, a controlled load was applied and
by both temperature and strain variations. To distinguish removed in stepped stages from a loading frame above the
between these two effects, a separate temperature com- pile, as shown in Fig. 2. The test pile was subjected to
pensation cable is typically installed adjacent to the strain maintained loading in axial compression, consisting of two
cable. The temperature compensation cable is constructed staged cycles of applied load up to 11.4 and 20.0 MN. The
with an inner gel-filled tube hosting single mode optical load was applied in discrete increments, as shown in Fig. 3.
fibers. In this gel-filled loose tube cable the frequency Each load increment was applied when the settlement rate
change Δvb is affected by the temperature variations only. of the pile was below the specified criteria. This static load
Hence, temperature changes, ΔT , can be obtained from the test lasted approximately 60 h. At each loading and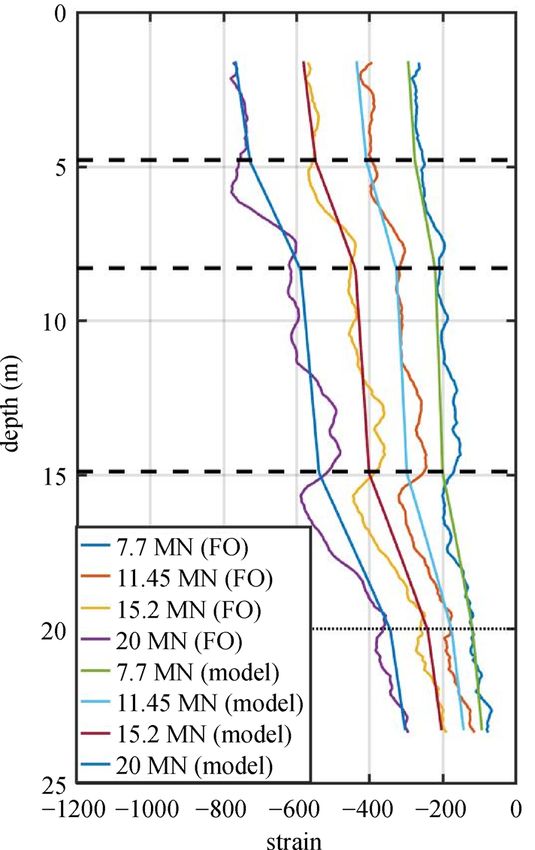
Yi RUI et al. Distributed fibre optic monitoring of a CFA pile                                   3

                                Fig. 1 Distributed fiber optic sensor cables installed in the CFA pile.

unloading stage, the applied load and displacement at the            temperature compensation for the four different distributed
pile head were measured using a load cell and linear                 fiber optic cables are independent. In addition, each cable
variable differential transformers (LVDTs), respectively.            provided hundreds of data points. These data points
From these, the load-settlement relationship of the pile was         produced a series of similar and relatively smooth curves
derived.                                                             under various loading conditions, which further validate
                                                                     the repeatability of the measurements.
                                                                        At each loading stage, the settlement at the pile head was
3   Data analysis                                                    measured by LVDTs. By integrating the head settlement
                                                                     and average strain profile from top to bottom, the axial
Figure 4 shows the strain profiles measured by DFOS                   displacement of the pile along the whole depth can be
during some of the load stages, from 7.7 to 20 MN. A                 calculated, as shown in Fig. 5. Under the static load of 20
maximum compressive strain of about 800 10–6 was                    MN, the maximum settlement close to the pile head was
recorded close to the top of the pile, under a load of 20 MN.        about 35 mm. This settlement decreased gradually with
   A sudden reduction of strain in the pile was observed in          pile depth, due to the compression of the concrete pile. At
the alluvium and River Terrace Deposits strata, when                 the pile tip, this value was about 23.5 mm, which indicates
compared with the expected gradual decrease in strain.               that a portion of the axial load had been transferred to the
This is likely caused by a larger pile cross-section at these        pile tip. A number of design parameters can be estimated
depths, and hence a smaller strain for a given load, which is        from the strain and displacement data, such as the pile
indicative of an overbreak at these depths. In addition, the         modulus at the pile head, the shaft friction for the different
four strain profiles in each load stage are quite similar             soil strata, and the pile tip resistance [30].
except in the made ground stratum. This indicates that the
pile had a fairly symmetric cross-section throughout its
depth, and hence the strain profiles on different sides are           4    FE analysis
quite similar. However, some fluctuations in the pile strain
appear in the top part of the pile. This could be due to             To further investigate the performance of the test pile under
cross-sectional irregularities close to the pile head.               static loading, a FE analysis was performed. The pile load
   The similarity in the measurement results between the             test was simulated by a simple 1D load-transfer FE model.
four cables highlights the reliability and repeatability of          As illustrated in Fig. 6, the vertical axially-loaded pile was
DFOS. This is considering that the measurement and                   simplified as a series of linear elastic axially loaded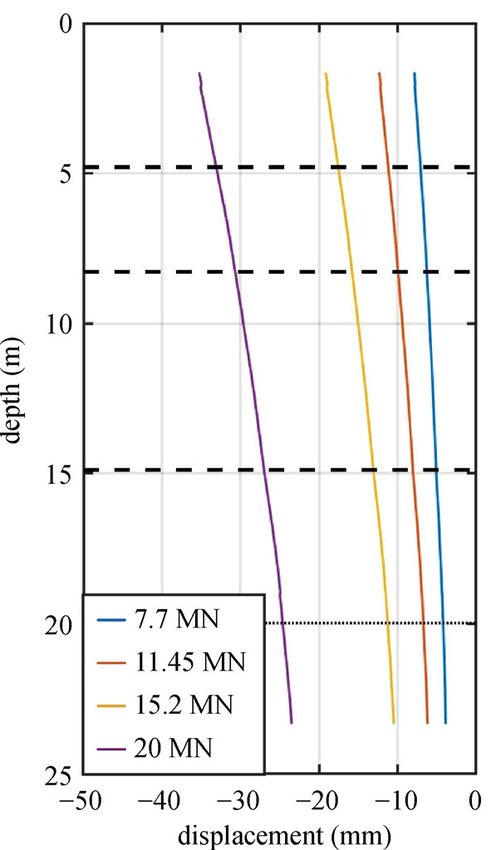
4                                                           Front. Struct. Civ. Eng.

               Fig. 2 Static load testing frame for the trial test pile (reproduced from de Battista et al. [29] with permission).

                                                                                                              km
                                                                                              q¼v ffiffiffiffiffiffiffiffiffiffiffiffiffiffiffiffiffiffiffiffiffiffiffiffiffiffiffiffiffiffiffiffiffiffi
                                                                                                                                   ffi;   (3)
                                                                                                u
                                                                                                d                       hd !
                                                                                                u                 k
                                                                                                t 1 þ mz
                                                                                                                  qm

                                                                          where km is the maximum stiffness, tm is the maximum
                                                                          shear stress, qm is the maximum tip resistance, d and h are
                                                                          the material constants which control the hardening and
                                                                          degradation behavior, and z is the vertical displacement.
                                                                             According to the static equilibrium in the vertical
                                                                          direction:

                                                                                                  t⋅2πrdz ¼ E⋅πr2 dε;                   (4)
                 Fig. 3 Pile load test schedule.
                                                                          and hence:
elements and a the pile-soil interaction was modeled as a                                                     Er dε
series of nonlinear soil springs, both of which had vertical                                            t¼      ⋅ ;                     (5)
                                                                                                              2 dz
displacement degrees-of-freedom only. This simplification
avoids having to mesh the cross section of the pile. This                 where r is the pile radius, ε is the pile axial strain, and E is
means that the modeled variables, including displacement,                 the concrete Young’s modulus. In this case study, E = 40
strain and stress are averaged across the pile’s cross section            GPa for concrete and uniform r = 0.45 m.
and vary only along the length of the pile. This model                       According to Eq. (5), the shaft friction can be calculated
contained 250 axially loaded elements with uniform mesh                   directly from the observed axial strain from the DFOS, and
size.                                                                     the results for different soil strata are plotted in Fig. 7.
   The behavior of the soil springs for shaft friction and tip            Similarly, the tip resistance q can also be calculated from
reaction was simulated by the nonlinear load-transfer                     the pile strain:
curves [30]. The shear stress t and tip resistance q can be                                              q ¼ E εbot ,                   (6)
written as:
                                                                          where εbot is the axial strain at the pile tip.
                                 km
                 t¼v ffiffiffiffiffiffiffiffiffiffiffiffiffiffiffiffiffiffiffiffiffiffiffiffiffiffiffiffiffiffiffiffiffiffi ;         (2)        The Young’s modulus of pile concrete can vary
                   u
                   d                       hd !
                   u                 k                                    significantly from the value given in the codes or obtained
                   t 1 þ mz                                               from the laboratory tests [30]. The static load applied on
                                     tm                                   the pile head, F, can be written as: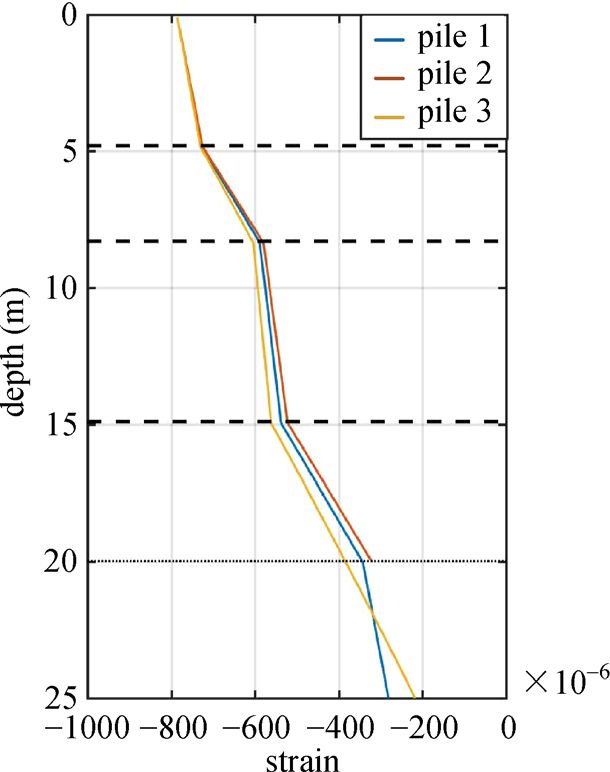
Yi RUI et al. Distributed fibre optic monitoring of a CFA pile                                              5

     Fig. 4 Strain profile of the CFA pile, as it was incrementally loaded vertically in compression, with loads of (a) 7.7 MN, (b) 11.4 MN, (c)
     15.2 MN and (d) 20.0 MN (negative strain indicates compression).

                         F ¼ E⋅πr2 εtop ,                           (7)     hence the shaft friction with 0.1 m intervals can be
                                                                            calculated using Eqs. (5) and (6). In the calibration, the
where εtop is the axial strain at the pile head. Hence, the                 average shaft friction for each strata was used. Accord-
value of Young’s modulus can be back calculated                             ingly, the parameters in the spring model can be calibrated
according to F and εtop measured at each loading stage.                     for each strata, as listed in Table 1. The results showed that
The field test data show that the real young’s modulus at                    the nonlinear load-transfer curves matched the observed
the pile head was close to 40 GPa.                                          data very well.
   The load transfer curves were calibrated by the shaft                       The large difference between Figs. 7(d) and 7(e)
friction derived from the DFOS strain, as shown in Fig. 7.                  indicates the reinforcement cage had a significant effect
The relative displacement and shaft friction are average                    on the load-transfer between the pile and the surrounding
values for each strata with reference to the initial stage. The             soil, for the same soil stratum (Lambeth Group). With the
axial strain used was the average strain recorded by the                    reinforcement cage, the maximum shaft friction reached
four FO cables in the pile. Because the DFOS can provide a                  about 360 kPa. But with the reinforcement bar bundle only,
high spatial density of axial strain during the loading test,               this value decreased sharply to about 110 kPa. This is
6 Front. Struct. Civ. Eng.
Figure 8 shows the pile head settlement from both the
FO and FE models. The results showed that the monitoring
data matched well with the simulation data. Small
differences were observed when the load was between 5
and 15 MN, which indicate that the shaft friction was
slightly underestimated (hence overestimated pile head
settlement) in the FE model during these loading stages.
Figure 9 shows the monitored (DFOS) and calculated
(FE) pile axial strains. The monitored strain is the average
value of the four cables shown in Fig. 4. A good match is
observed in general between measured and calculated
strains. However, the FO cables recorded higher values of
strain compared to the FE model at depths of 6 and 16 m.
This is unexpected when the pile is assumed to be uniform
as in the FE model. On the other hand, this difference of
pile axial strain was proportional to the applied static load.
Hence, this is likely due to localized necking of the pile
(smaller cross-section) or decrease in the concrete Young’s
modulus, both of which would result in a localized increase
of strain for a given load. From a parametric study, it was
found that, if the compressive stiffness (EA) decreased by
Fig. 5 Displacement profile of the CFA pile (negative displace- about 13% at depth of 6 m and 16% at depth of 16 m, a
ment indicates settlement). good match could be obtained between the measured and
simulated pile axial strains.
because the reinforcement cage increases the stiffness of Turning points in the measured and simulated axial
the concrete pile, especially at the pile surface close to the strain profiles were observed at the depth of 20 m,
soil. This increase in pile stiffness would also increase the coinciding with the bottom of the reinforcement cage. This
load transfer, and hence a higher shaft friction would be further indicates the important role of the reinforcement
observed in the presence of a reinforcement cage. cage in the pile-soil load transfer.
Fig. 6 Load-transfer model.Yi RUI et al. Distributed fibre optic monitoring of a CFA pile 7
Fig. 7 Calibration of load-transfer curves: (a) made ground; (b) alluvium; (c) River Terrace; (d) Lambeth Group (cage and bar); (e)
Lambeth Group (bar only); (f) tip.
5 Performance of reinforcement cage and Figure 11 shows the load-settlement curves for these
central reinforcement bar bundle three simulated piles. A linear relationship between the
To investigate the performance of the reinforcement cage
and central reinforcement bar bundle in pile load testing, a
parametric study was performed based on the three
different simulated pile configurations, as shown in
Fig. 10. The first pile was identical to the test pile
discussed above. The second pile was the top 20 m part of
pile 1 (i.e., the part that had both cage and central bar
bundle reinforcement). Pile 3 was 25 m long with the
reinforcement cage and central bar bundle over the whole
length. The load-transfer curves for pile 1 and pile 2 were
assumed to be identical to those in Table 1. For pile 3, the
load transfer in the lower part of the Lambeth Group
stratum followed the model of Lambeth Group (cage and Fig. 8 Comparison of pile head settlement from the FO and FE
bar) in Table 1. models.8 Front. Struct. Civ. Eng.
settlement and load under a small load was observed for all
three piles. When the load was over 10 MN, the pile settled
much faster as the load increased. The settlement of pile 1
was always between that of piles 2 and 3 for all loads. The
largest settlements of piles 1, 2, and 3 were approximately
35, 43, and 28 mm, respectively, under the static loading of
20 MN. This indicates that extending the reinforcement
cage to the bottom of the pile (pile 3) would result in a 20%
reduction in the pile settlement (from 35 to 28 mm) under
the maximum applied load, as compared with the test pile
investigated in this study (pile 1). On the other hand,
removing the bottom 5 m of the pile which was reinforced
only with the bar bundle (as in pile 2) would result in a
23% increase in pile settlement (from 35 to 43 mm).
Figure 12 shows the pile axial strain for the three
simulated piles under a load of 20 MN. The difference is
very small above the depth of 8 m. With the central
reinforcement bar bundle only (pile 1), the axial strain
decreased faster with depth, as compared with the pile
having reinforcement cage and bar bundle (pile 3). This
was due to the larger settlement as shown in Fig. 11,
leading to greater shaft friction. On the other hand, a larger
tip resistance was observed for pile 2. Using Eq. (6), the tip
resistance was about 11.2 MPa for pile 1, 12.9 MPa for pile
Fig. 9 Comparison of pile axial strains from the FO and FE models. 2, and 8.7 MPa for pile 3. This further indicates that the
Fig. 10 Assumed differences in the reinforcement cage and bar bundle for comparison purposes in the parametric study.Yi RUI et al. Distributed fibre optic monitoring of a CFA pile 9
Table 1 Calibration parameters of the load-transfer model
layer tm or qm (kPa) km (kN/m3) d h
made ground 120 6000 3 1
alluvium 393 18512 3 1
River Terrace 107 6259 3 1
Lambeth Group (cage and bar) 366 26632 3 1
Lambeth Group (bar only) 112 14992 3 1
tip resistance 13930 674040 3 1
load-transfer model. The following conclusions were
derived.
1) DFOS provides a high spatial density of measurement
data, and hence can give much more information about the
properties and performance of a reinforced concrete pile
than point sensors. In this case study, some anomalies, like
an irregular pile cross-sectional area in the CFA test pile,
were identified, which would not have been possible to
identify using conventional point sensors. Such a postula-
tion is supported by the comparison between the FO data
and FE analysis.
2) The continuous strain profiles can be used to calculate
Fig. 11 Pile head settlement. the pile displacement and shaft friction through numerical
integration and differentiation. These can provide informa-
tion for calibration of the load transfer model used in the
FE analysis.
3) A good match was obtained between the monitoring
data and FE analysis in terms of pile axial strain and pile
displacement, which indicates that the nonlinear load-
transfer model used in this study was able to simulate the
pile and soil performance during the load testing.
4) The performance of the reinforcement cage and
central reinforcement bar bundle in pile load testing were
investigated through a numerical study. It was found that
extending the reinforcement cage to the bottom of the pile
(as opposed to having the bottom 5 m of the pile reinforced
only with the central bar bundle) would reduce the pile
settlement by up to 20% under a maximum load of 20 MN,
as well as increase the load carrying capacity of the pile.
Acknowledgements The authors thank the EPSRC and Innovate UK for
funding this research through the Cambridge Centre for Smart Infrastructure
Fig. 12 Pile axial strains under the mechanical load of 20 MN. and Construction (CSIC) Innovation and Knowledge Centre (EPSRC grand
reference number EP/L010917/1). We thank Professor Kenichi Soga (UC
Berkeley) for providing valuable input to this research. We would also like to
load carrying capacity of pile 1 was between that of pile 2 acknowledge the contribution of Angus Cameron from Environmental
and pile 3. Scientifics Group.
Open Access This article is licensed under a Creative Commons Attribution
6 Conclusions 4.0 International License, which permits use, sharing, adaptation, distribution
and reproduction in any medium or format, as long as you give appropriate
In this paper, the application of distributed fiber optic credit to the original author(s) and the source, provide a link to the Creative
Commons licence, and indicate if changes were made. The images or other
sensor (DFOS) technology was used in full-scale static pile third party material in this article are included in the article’s Creative
load testing to investigate the integrity and load capacity of Commons licence, unless indicated otherwise in a credit line to the material.
a CFA test pile in London. To interpret the monitoring data If material is not included in the article’s Creative Commons licence and your
better, a FE analysis was performed based on a simple 1D intended use is not permitted by statutory regulation or exceeds the permitted10 Front. Struct. Civ. Eng.
use, you will need to obtain permission directly from the copyright holder. To 5823–5828
view a copy of this licence, visit http://creativecommons.org/licenses/by/4.0/. 16. Cui Q, Pamukcu S, Lin A, Xiao W, Toulouse J. Performance of
double side band modulated probe wave in BOTDA distributed fiber
sensor. Microwave and Optical Technology Letters, 2010, 52:
References 2713–2717
17. Cui Q, Pamukcu S, Lin A, Xiao W, Herr D, Toulouse J, Pervizpour
1. British Standards Institution. BS EN 1997-1:2004 + A1:2013 M. Distributed temperature-sensing system based on Rayleigh
Eurocode 7. Geotechnical Design, General Rules. London, UK: scattering BOTDA. IEEE Sensors Journal, 2011, 11(2): 399–403
BSI, 2004 18. Pamukcu S, Cetisli F, Texier S, Naito C, Toulouse J. Dynamic
2. Bond A J, Jardine R J, Dalton J C P. Design and performance of the strains with Brillouin scattering distributed fiber optic sensor.
Imperial College instrumented pile. Geotechnical Testing Journal, GeoCongress, 2006, 187: 31–36
1991, 14(4): 413–424 19. Cheung L L K, Soga K, Bennett P J, Kobayashi Y, Amatya B,
3. Ismael N F. Axial load tests on bored piles and pile groups in Wright P. Optical fibre strain measurement for tunnel lining
cemented sands. Journal of Geotechnical and Geoenvironmental monitoring. Proceedings of the Institution of Civil Engineers-
Engineering, 2001, 127(9): 766–773 Geotechnical Engineering, 2010, 163(3): 119–130
4. Brown M J, Hyde A F L, Anderson W F. Analysis of a rapid load 20. de Battista N, Elshafie M, Soga K, Williamson M, Hazelden G, Hsu
test on an instrumented bored pile in clay. Geotechnique, 2006, Y S. Strain monitoring using embedded distributed fibre optic
56(9): 627–638 sensors in a sprayed concrete tunnel lining during the excavation of
5. Jardine R J, Zhu B T, Foray Y Z X. Interpretation of stress cross-passages. In: Proceedings of the 7th International Conference
measurements made around closed-ended displacement piles in on Structural Health Monitoring and Intelligent Infrastructure
sand. Geotechnique, 2013, 63(8): 613–627 (SHMII7). Torino: Curran Associates, Inc., 2015: 1–3
6. Jardine R J, Zhu B T, Foray P, Yang Z X. Measurement of stresses 21. Kechavarzi C, Soga K, de Battista N, Pelecanos L, Elshafie M Z E
around closed-ended displacement piles in sand. Geotechnique, B, Mair R J. Distributed Fibre Optic Strain Sensing for Monitoring
2013, 63(1): 1–17 Civil Infrastructure. London: Thomas Telford, 2016: 241–246
7. McNamara A M, Suckling T, McKinley B, Stallebrass S E. A field 22. Mohamad H, Bennett P J, Soga K, Mair R J, Bowers K. Behaviour
trial of a reusable, hollow, cast-in-situ pile. Geotechnical Engineer- of an old masonry tunnel due to tunnelling-induced ground
ing, 2014, 167(4): 390–401 settlement. Geotechnique, 2010, 60(12): 927–938
8. Kechavarzi C, Pelecanos L, de Battista N, Soga K. Distributed fibre 23. Rui Y, Kechavarzi C, O’Leary F, Barker C, Nicholson D, Soga K.
optic sensing for monitoring reinforced concrete piles. Geotechnical Integrity testing of pile cover using distributed fibre optic sensing.
Engineering Journal of the SEAGS & AGSSEA, 2019, 50(1): 43–51 Sensors (Basel), 2017, 17(12): 2949
9. Institution of Civil Engineers (Great Britain). ICE Specification for 24. Schwamb T, Soga K, Mair R J, Elshafie M Z, Boquet C, Greenwood
Piling and Embedded Retaining Walls. London: ICE Publishing, J. Fibre optic monitoring of a deep circular excavation. Geotechnical
2016 Engineering, 2014, 167(2): 144–154
10. Lee W, Lee W J, Lee S B, Salgado R. Measurement of pile load 25. Garus D, Golgolla T, Krebber K, Schliep F. Brillouin optical
transfer using the Fiber Bragg Grating sensor system. Canadian frequency-domain analysis for distributed temperature and strain
Geotechnical Journal, 2004, 41(6): 1222–1232 measurements. Journal of Lightwave Technology, 1997, 15: 654–
11. Kister G, Winter D, Gebremichael Y M, Leighton J, Badcock R A, 662
Tester P D, Krishnamurthy S, Boyle W J O, Grattanb K T V, 26. Horiguchi T, Kurashima T, Tateda M. Tensile strain dependence of
Fernando G F. Methodology and integrity monitoring of foundation Brillouin frequency shift in silica optical fibers. IEEE Photonics
concrete piles using Bragg grating optical fibre sensors. Engineering Technology Letters, 1989, 1: 107–108
Structures, 2007, 29(9): 2048–2055 27. Kurashima T, Horiguchi T, Tateda M. Thermal effects on the
12. Majumder M, Gangopadhyay T K, Chakraborty A K, Dasgupta K, Brillouin frequency shift in jacketed optical silica fibers. Applied
Bhattacharya D K. Fibre Bragg gratings in structural health Optics, 1990, 29: 2219–2222
monitoring—Present status and applications. Sensors and Actuators. 28. de Battista N, Kechavarzi C, Soga K. Distributed fiber optic sensors
A, Physical, 2008, 147(1): 150–164 for monitoring reinforced concrete piles using Brillouin scattering.
13. Doherty P, Igoe D, Murphy G, Gavin K, Preston J, McAvoy C, In: Proceedings of the European Workshop on Optical Fibre
Martin C M. Field validation of fibre Bragg grating sensors for Sensors-EWOFS 2016. Limerick: SPIE, 2016
measuring strain on driven steel piles. Géotechnique Letters, 2015, 29. de Battista N, Kechavarzi C, Seo H, Soga K, Pennington S.
5(2): 74–79 Distributed fibre optic sensors for measuring strain and temperature
14. Bao X, DeMerchant M, Brown A, Bremner T. Tensile and of cast-in-situ concrete test piles. In: Proceedings of the
compressive strain measurement in the lab and field with the International Conference on Smart Infrastructure and Construction
distributed Brillouin scattering sensor. Journal of Lightwave (ICSIC). London: ICE Publishing, 2016
Technology, 2001, 19: 1698–1704 30. Pelecanos L, Soga K, Elshafie M Z, de Battista N, Kechavarzi C,
15. Cui Q, Pamukcu S, Xiao W, Guintrand C, Toulouse J, Pervizpour Gue C Y, Seo H J. Distributed fiber optic sensing of axially loaded
M. Distributed fiber sensor based on modulated pulse base reflection bored piles. Journal of Geotechnical and Geoenvironmental
and Brillouin gain spectrum analysis. Applied Optics, 2009, 48(30): Engineering, 2017, 144(3): 04017122You can also read