VOCAL MELODY EXTRACTION USING PATCH-BASED CNN
←
→
Page content transcription
If your browser does not render page correctly, please read the page content below
VOCAL MELODY EXTRACTION USING PATCH-BASED CNN
Li Su
Institute of Information Science, Academia Sinica, Taiwan
ABSTRACT series, and multiple events usually have their spectra over-
lapped with each other. To enjoy the advantages of patch-
arXiv:1804.09202v1 [cs.SD] 24 Apr 2018
A patch-based convolutional neural network (CNN) model
based modeling, one needs a data representation that can ef-
presented in this paper for vocal melody extraction in poly-
fectively localize a pitch event.
phonic music is inspired from object detection in image pro-
To address the above-mentioned issues, a novel data rep-
cessing. The input of the model is a novel time-frequency rep-
resentation, based on the combined frequency and periodicity
resentation which enhances the pitch contours and suppresses
(CFP) approach [11–14], is proposed to enable localization of
the harmonic components of a signal. This succinct data rep-
pitched events in the frequency domain without interference
resentation and the patch-based CNN model enable an effi-
from the harmonics. Such a data representation then allows us
cient training process with limited labeled data. Experiments
to leverage the key concepts in image processing, such as the
on various datasets show excellent speed and competitive ac-
region proposal and selective search in R-CNN, in MIR. This
curacy comparing to other deep learning approaches.
study specifically focuses on vocal melody extraction from
Index Terms— Melody extraction, convolutional neural poly-phonic music, viewing it as an analogy of semantic seg-
networks, cepstrum, music information retrieval. mentation in image processing. The vocal melody extraction
contains a classification task for classifying whether a time-
frequency patch contains a vocal event, and a localization task
1. INTRODUCTION
for simultaneously performing vocal activity detection (VAD)
Most of the music information retrieval (MIR) tasks, such and pitch detection. Since a singing voice has vibrato and
as auto-tagging [1] and vocal melody extraction from poly- sliding behaviors different from other instruments [15], it is
phonic music [2–7], require local behavior of a specific audio feasible to perform vocal-nonvocal classification simply by
event to be detected, e.g., the time stamps and pitches of a using a localized pitch contour.
singing voice. The most common data representation used The proposed system uses a similar strategy to R-CNN.
for such MIR tasks is undoubtedly the spectrogram obtained It extracts a CFP representation from a signal, selects patches
from converting a 1-D signal into a 2-D graph in the time- as candidates of vocal melody objects in the representation,
frequency domain to better capture local behaviors of a sig- trains a CNN to determine whether a patch corresponds to a
nal. However, a spectrogram is rarely modeled in a way that singing voice or not, and then localizes a voice melody object
a conventional image processing method does: an audio pro- both in time and frequency. In the experiments, the proposed
cessing method typically employs a frame or a segment (i.e. system achieves competitive accuracy with respect to other
a sequence of frames) as a basic unit, while the counterpart recently-developed deep learning approaches by using small-
for an image processing method usually being a patch, such sized training data and limited computing resources.
as the region-based convolutional neural network (R-CNN)
and its improved versions [8–10], all of which emphasize the 2. METHOD
strategy of selecting and processing patches to bridge the gap
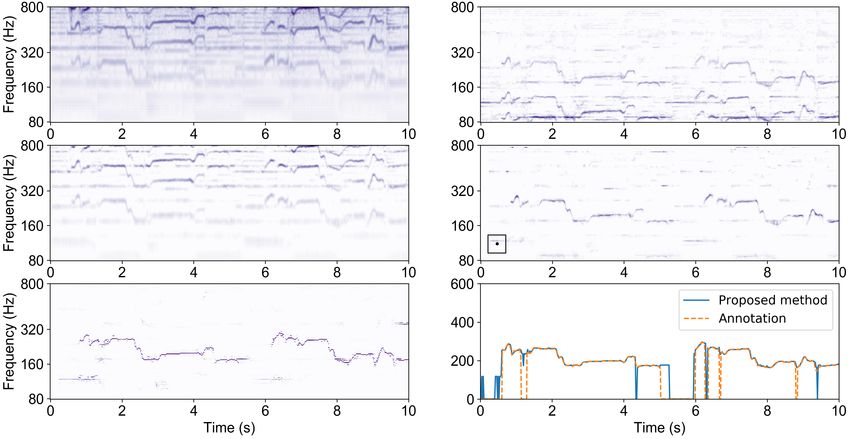
between image classification and object localization [8]. As shown in Fig. 1, the proposed melody extraction system
It is therefore intriguing to unlock the potential of utiliz- contains three main parts: a data representation, patch selec-
ing time-frequency patches in MIR tasks considering advan- tion, and CNN modeling.
tages offered by employing the patches. First, a patch can
capture an event localized not only in time but also in fre- 2.1. Data representation
quency or pitch. Besides, patch-based processing is faster
than segment-based processing, since a patch excludes some The data representation proposed here is based on the CFP ap-
elements in a spectrum from computation. However, model- proach, in which a pitch object is determined by a frequency-
ing local pitched events on a spectrogram representation by domain representation indicating its fundamental frequency
using patches has difficulties in practice, since a pitched sig- (f0 ) and harmonics (nf0 ), and by a time-domain representa-
nal naturally has a wide-band spectrum having its harmonic tion revealing its f0 and sub-harmonics (f0 /n) [11–14, 16].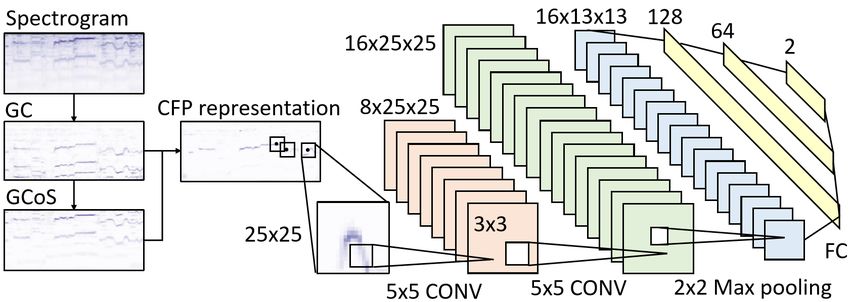
time) takes the weighted sum of the components whose fre-
                                                                   quency (or period) between 0.25 semitones above and below
                                                                   the frequency at fm = 80 × 2(m−1)/48 Hz (or the period at
                                                                   1/fm seconds). The filtered representations are then both in
                                                                   the pitch scale, namely Z̃1 and Z̃2 . The final CFP representa-
                                                                   tion is
                                                                                     Y[p, n] = Z̃1 [p, n]Z̃2 [p, n] ,          (6)
                                                                   where p is the index in the log-frequency scale. In this work,
                Fig. 1. The proposed system.                       the audio files are resampled to 16 kHz and merged into one
                                                                   mono channel. Data representations are computed with Hann
                                                                   window of 2048 samples and hop size of 320 samples.
The following discussion shows that simply multiplying the
                                                                       The above procedure is illustrated in the top 4 subfigures
frequency-domain representation by the time-domain rep-
                                                                   in Fig. 2. As seen, the singing voice melody of the male
resentation can effectively suppress the harmonic and sub-
                                                                   singer performing in this clip has very weak and unclear con-
harmonic peaks, and yield a CFP representation localizing a
                                                                   tour at its fundamental frequency, and the spectral energy
pitch object in both the time and frequency domain.
                                                                   is mostly concentrated in the high frequency range. Such a
     Consider an input signal x := x[n] where n is the index
                                                                   ‘weak fundamental’ phenomenon is usually seen in singing
of time. Let the amplitude part of the short-time Fourier trans-
                                                                   voice because the energy of singing voice is dominated by the
form (STFT) of x is represented as X. Given an N -point DFT
                                                                   formants rather than the fundamental frequency. Such high-
matrix F, high-pass filters Wf and Wt , and activation func-
                                                                   frequency contents are unseen in the GC representation as it is
tions σi , consider the following three data representations:
                                                                   a time-domain representation, and the GC representation ex-
                                                                   hibits a number of strong sub-harmonics in the low frequency
                Z0 [k, n] := σ0 (Wf X) ,                    (1)
                                                                   range. The GCoS is then a refined, ‘de-trended’ version of
                                       −1

                Z1 [q, n] := σ1 Wt F        Z0 ,            (2)    the spectrogram, where the spectral envelope is canceled by
                Z2 [k, n] := σ2 (Wf FZ1 ) .                 (3)    the high-pass filter in (5). Multiplying GCoS by GC there-
                                                                   fore yields a succinct CFP representation in (6), in which the
Equations (1)-(3) encompass many conventional pitch salience       unwanted peaks are suppressed, and the remaining peaks are
functions used in the literature: Z0 is a spectrogram, Z1 is a     mostly the fundamental frequencies of either the melody or
generalized cepstrum (GC) [17–21], and Z2 is a generalized         the accompaniment instruments.
cepstrum of spectrum (GCoS) [13,14]. The index k in Z0 and
Z2 is frequency, while the index q in Z1 represents quefrency,
                                                                   2.2. Patch selection
which has the same unit as time. Here the nonlinear activation
function is defined as a rectified and root-power function:        To classify whether a pixel in a time-frequency plane belongs
                                                                   to a singing voice melody contour, patches from the key re-
             σi (Z) = |relu(Z)|γi ,   i = 0, 1, 2 ,         (4)    gions are selected in Y as the candidates of a melody contour.
                                                                   Assuming that every peak in a frame in Y is a candidate of
where 0 < γi ≤ 1, relu(·) represents a rectified linear unit,      vocal melody, a simple strategy is employed for selecting a
and | · |γ0 is an element-wise root function. Wf and Wt are        patch: for each peak, a patch having the peak at its center
two high-pass filters designed as diagonal matrices with the       is selected. The patch size is 25 × 25 (i.e., 0.5 second 6.25
cutoff frequency and quefrency, respectively being kc and qc ,     semitones) as suggested by our pilot study, and a fixed size is
:                                                                 employed for simplicity. The patches are then used as input
                               1,    l > kc or qc ;
            Wf or t [l, l] =                              (5)      of a CNN trained to classify whether the center of a patch be-
                               0,    otherwise .
                                                                   longs to a vocal melody contour (labeled as 1) or not (labeled
Wf and Wt are used to remove slow-varying portions.Based           as 0). Only a small portion of the peaks in Y are the melody
on the CFP approach, merging Z1 and Z2 together can sup-           contour, and therefore 10 percent of non-vocal peaks are ran-
press the unwanted harmonics and sub-harmonics. Since Z1           domly selected into the training data during training to avoid
is in the quefrency domain, it should be mapped into the fre-      the imbalance between positive and negative examples.
quency domain before merging. Besides, to fit the perceptive
scale of musical pitches, the resulting CFP representation is      2.3. Model
preferred to be mapped into the log-frequency scale. There-
fore, two sets of filter banks respectively in the time and fre-   To predict whether an input patch represents singing voice
quency domains are applied. Both filter-banks have 159 tri-        or not, we configure a CNN model having two convolutional
angular filters ranging from 80 Hz to 800 Hz, with 48 bands        layers followed by three fully-connected layers. The two con-
per octave. More specifically, the m-th filter in frequency (or    volutional layers have 8 5 × 5 filters and 16 3 × 3 filters,
Fig. 2. Procedure of singing melody extraction of the first 10s of ‘train09.wav’ in the MIREX05 dataset. Top left: power-scale
spectrogram (Z0 ). Top right: generalized cepstrum (Z1 ). Middle left: generalized cepstrum of spectrum (Z2 ). Middle right:
CFP representation (Y) with a 25 × 25 patch. Bottom left: reorganized CNN outputs. Bottom right: the CNN-MaxOut result.
respectively, and both preserve the size of the mapping with 3. EXPERIMENT
padding. The numbers of units of the three fully-connected
layers are 128, 64, and 2, respectively. The CNN outputs We compare the three proposed methods with two recently-
a 2 × 1 vector with one element representing the likelihood developed deep learning algorithms The first is the multi-
of being a melody contour, and the other element represent- column DNN (MCDNN) by Kum et al., in which the results
ing of the opposite. During training, the cross entropy be- of ADC2004 and MIREX2005 are reported [2], and the sec-
tween the CNN output and the ground truth is minimized us- ond is the deep salience map (DSM) by Bittner et al., for
ing stochastic gradient descent with the Adam optimizer. The which on-line source code with the ‘vocal’ option is avail-
CNN model is implemented in Python 2.7, using Keras with able [4]. Since the detection results of DSM are sensitive to
Theano as the back end. the thresholding parameter, the parameter is tuned from 0 to
0.9 for all datasets to find the optimal value for better com-
The patch-level prediction results are then reorganized as parison. The resulting optimal threshold th=0.1 as well as
a new time-frequency representation according to the time the default value th=0.3 are both used in the experiment. The
and frequency of the patch center, as shown in the bottom model is trained and tested on an ASUS ZenBook UX430U @
left of Fig. 2. Note that pitch contours having low similarity 2.70/2.90 GHz with an Intel i7-7500U CPU and 8 GB RAM.
to those of singing voice, such as a pitch contour having no For reproducibility, the companion source code, and informa-
vibrato or sliding, are of very low output probability. To gen- tion of testing data and results can be found at https://
erate a binary prediction result, the threshold of the CNN out- github.com/leo-so/VocalMelodyExtPatchCNN.
put is set at 0.5. As there might be more than one patch having
an output probability > 0.5, the output vocal melody contour 3.1. Data
for each time step can be obtained in three possible ways: 1)
The first 3 seconds of the first 800 clips of the MIR1K1 dataset
directly employing the CFP representation by simply taking
are used as training data, and no data augmentation is per-
the pitch index corresponding to the maxima of the frame, 2)
formed. In contrast to other data-driven melody methods, the
from patches having an output probability > 0.5, taking the
training data used for this study is small-sized and of low-
frequency index where the CFP representation reaching max-
diversity, since it contains only 40 minutes of Chinese karaoke
imal, and 3) taking the frequency index corresponding to the
songs sung by amateur singers. The testing data for evalua-
largest output probability. In the following discussions, we
tion are from four datasets for melody extraction: ADC2004,
name the three methods as CFP-Max, CNN-MaxIn, CNN-
MaxOut, respectively. 1 https://sites.google.com/site/unvoicedsoundseparation/mir-1kADC2004 (vocal) MIREX2005 (vocal) iKala MedleyDB
Method
OA RPA RCA VR VFA OA RPA RCA VR VFA RPA RCA RPA RCA
CFP-Max 61.2 71.7 76.8 100 100 46.3 70.7 75.5 100 100 69.7 72.6 55.6 62.4
CNN-MaxIn 74.3 76.7 78.4 90.1 41.3 73.2 81.2 82.2 95.1 41.1 76.6 77.8 58.7 63.6
CNN-MaxOut 72.4 74.7 75.7 90.1 41.3 74.4 83.1 83.5 95.1 41.1 76.9 77.7 59.7 63.8
MCDNN 73.1 75.8 78.3 88.9 41.2 68.4 77.6 78.6 87.0 49.0 – – – –
DSM (th = 0.3) 68.0 68.4 70.9 78.2 25.5 76.3 70.4 71.2 80.1 13.6 67.9 69.7 61.7 64.7
DSM (th = 0.1) 70.8 77.1 78.8 92.9 50.5 69.6 76.3 77.3 93.6 42.8 73.4 74.6 72.0 74.8
Table 1. Vocal melody extraction results of the proposed and other methods on various datasets.
MIREX05,2 iKala [22], and MedleyDB [23]. As the pro- higher than those of CNN-MaxOut in the ADC2004 dataset.
posed model is designed solely for singing voice melody, we For the comparison to other methods, Table 3 shows that
follow [2] and select only samples having melody sung by when focusing on RPA, CNN-MaxOut outperforms DSM
human voice from ADC2004 and MIREX05. As a result, by 6.8% in MIREX05 and by 3.5% in iKala. On the other
12 clips in ADC2004 and 9 clips in MIREX05 are selected. hand, DSM outperforms CNN-MaxIn by 0.4% in ADC2004
Since all melodies in iKala are singing voice, all 252 clips and also outperforms CNN-MaxOut by 12.3% in MedleyDB.
in the iKala dataset are selected for evaluation. To obtain Such a huge difference across the four datasets encompassing
the annotation of singing voice in medleyDB, 12 songs hav- a broad range of music styles can be attributed to the train-
ing singing voice included in their ‘MELODY2’ annotations ing method and the size of the model. DSM is trained with
are selected. The vocal melody labels are obtained from the data most similar to MedleyDB, so its superior performance
MELODY2 annotations occurring in the intervals labeled by is no surprise. Similarly, ADC2004 contains opera singing
‘female singer’ or ‘male singer’. included in the training data of MedleyDB but not included
in MIR-1K, so for those samples of opera singing, DSM
3.2. Result also performs better than the model proposed in this study.
On the other hand, although the proposed model is trained
Table 3 lists the overall accuracy (OA), raw pitch accuracy on amateur singing voice, it still performs better in iKala, a
(RPA), raw chroma accuracy (RCA), voice recall (VR) and dataset with professional Karaoke singing. For the size of
voice false alarm (VFA) of the three proposed methods, model, DSM adopts more layers, more feature mappings, and
MCDNN, and DSM on the four testing datasets. All data is larger data representation (i.e., the full CQT representation)
computed from mir eval [24]. The results of MCDNN on than the proposed model, which has a small, patch-sized data
ADC2004 and MIREX05 are from [2]. Due to paper length representation and fewer feature mappings. As a result, the
limitation, we only report the VR and VFA of the ADC2004 proposed model provides a much faster computation speed
and MIREX05 datasets since the VAD task is a minor topic of than DSM, and a test on the first 10 songs in the iKala dataset
this paper. CFP-Max has no VAD mechanism, so the resulting indicates the execution speeds of CFP-Max, CNN-MaxOut
VR and VFA are both 100%. CNN-MaxIn and CNN-MaxOut and DSM are 0.10x, 0.57x and 4.26x real time, respectively,
both use the same CNN for VAD, so their VR and VFA values demonstrating that the proposed patch-based CNN model is
are the same. The VR and VFA of the proposed model are around eight times faster than DSM.
similar to the ones of the DSM with the optimal threshold
parameter without fine tuning; it is probably because each
instance of voice activation is determined independently and 4. CONCLUSION
locally in both the time and frequency domain.
The proposed model with the CFP representation and patch-
Among the proposed methods, CNN-MaxOut achieves
based CNN is demonstrated as easy to train, computationally
highest scores in general; this result clearly verifies the ef-
light, and of high accuracy. It also has scalability, and can
fectiveness of the proposed patch-based CNN modeling in
be extended in the future by incorporating data augmenta-
selecting the patches corresponding to singing voice melody.
tion and more training samples containing melody contours
However, one can also observe that the CFP representation
locally representing voice or non-voice events.
itself, as a pure signal processing method without data-driven
modeling, still exhibits very competitive performance. The The solution proposed is based on the assumption that a
explanation for this phenomenon includes: first, using CFP- short pitch contour is sufficient to discriminate singing voice
Max without CNN modeling provides very competitive RPA melody from accompaniment; this might no longer hold un-
and RCA, occasionally even better than DSM using the de- der complicated instrumentation or other context-dependent
fault threshold; second, the RPA and RCA of CNN-MaxIn are situation. Future research directions can include incorporat-
ing both the local and contextual information spanning either
2 https://labrosa.ee.columbia.edu/projects/melody/ in time or frequency to address more challenging scenarios.5. REFERENCES [13] L. Su, “Between homomorphic signal processing and
deep neural networks: Constructing deep algorithms for
[1] J.-Y. Liu and Y.-H. Yang, “Event localization in music polyphonic music transcription,” in Asia Pacific Signal
auto-tagging,” in Proc. ACM Multimedia. ACM, 2016, and Infor. Proc. Asso. Annual Summit and Conf. (AP-
pp. 1048–1057. SIPA ASC), 2017.
[2] S. Kum, C. Oh, and J. Nam, “Melody extraction on [14] Y.-T. Wu, B. Chen, and L. Su, “Automatic music tran-
vocal segments using multi-column deep neural net- scription leveraging generalized cepstral features and
works.,” in Proc. ISMIR, 2016, pp. 819–825. deep learning,” in Proc. ICASSP, 2018.
[3] F. Rigaud and M. Radenen, “Singing voice melody tran- [15] J. W. Beauchamp, “Comparison of vocal and violin vi-
scription using deep neural networks.,” in ISMIR, 2016, brato with relationship to the source/filter model,” in
pp. 737–743. Studies in Musical Acoustics and Psychoacoustics, pp.
201–221. Springer, 2017.
[4] R. M. Bittner, B. McFee, J. Salamon, P. Li, and J. P.
[16] G. Peeters, “Music pitch representation by periodicity
Bello, “Deep salience representations for f0 estima-
measures based on combined temporal and spectral rep-
tion in polyphonic music,” in 18th Int. Soc. for Music
resentations,” in Proc. IEEE ICASSP, 2006.
Info. Retrieval Conf., Suzhou, China, Oct. 2017.
[17] T. Tolonen and M. Karjalainen, “A computationally ef-
[5] P. Verma and R. W. Schafer, “Frequency estimation ficient multipitch analysis model,” IEEE Speech Audio
from waveforms using multi-layered neural networks,” Processing, vol. 8, no. 6, pp. 708–716, 2000.
in INTERSPEECH, 2016, pp. 2165–2169.
[18] A. Klapuri, “Multipitch analysis of polyphonic music
[6] R. M. Bittner, J. Salamon, S. Essid, and J. P. Bello, and speech signals using an auditory model,” IEEE
“Melody extraction by contour classification.,” in Proc. Trans. Audio, Speech, Lang. Proc., vol. 16, no. 2, pp.
ISMIR, 2015, pp. 500–506. 255–266, 2008.
[7] J. Salamon and E. Gómez, “Melody extraction from [19] T. Kobayashi and S. Imai, “Spectral analysis using gen-
polyphonic music signals using pitch contour character- eralized cepstrum,” IEEE Trans. Acoust., Speech, Signal
istics,” IEEE Transactions on Audio, Speech, and Lan- Proc., vol. 32, no. 5, pp. 1087–1089, 1984.
guage Processing, vol. 20, no. 6, pp. 1759–1770, 2012.
[20] H. Indefrey, W. Hess, and G. Seeser, “Design and
[8] R. Girshick, J. Donahue, T. Darrell, and J. Malik, “Rich evaluation of double-transform pitch determination al-
feature hierarchies for accurate object detection and se- gorithms with nonlinear distortion in the frequency
mantic segmentation,” in Proc. IEEE conference on domain-preliminary results,” in Proc. IEEE Int. Conf.
computer vision and pattern recognition, 2014, pp. 580– Acoust. Speech Signal Process, 1985, pp. 415–418.
587. [21] K. Tokuda, T. Kobayashi, T. Masuko, and S. Imai,
“Mel-generalized cepstral analysis: a unified approach
[9] S. Ren, K. He, R. Girshick, and J. Sun, “Faster r-cnn:
to speech spectral estimation.,” in Proc. Int. Conf. Spo-
Towards real-time object detection with region proposal
ken Language Processing, 1994.
networks,” in Advances in neural information process-
ing systems, 2015, pp. 91–99. [22] T.-S. Chan, T.-C. Yeh, Z.-C. Fan, H.-W. Chen, L. Su,
Y.-H. Yang, and R. Jang, “Vocal activity informed
[10] K. He, G. Gkioxari, P. Dollár, and R. Girshick, “Mask singing voice separation with the ikala dataset,” in Proc.
r-cnn,” arXiv preprint arXiv:1703.06870, 2017. ICASSP, 2015, pp. 718–722.
[11] L. Su and Y.-H. Yang, “Combining spectral and tem- [23] R. M. Bittner, J. Salamon, M. Tierney, M. Mauch,
poral representations for multipitch estimation of poly- C. Cannam, and J. P. Bello, “Medleydb: A multitrack
phonic music,” Audio, Speech, and Language Process- dataset for annotation-intensive mir research.,” in Proc.
ing, IEEE/ACM Transactions on, vol. 23, no. 10, pp. ISMIR, 2014, vol. 14, pp. 155–160.
1600–1612, 2015.
[24] C. Raffel, B. McFee, E. J. Humphrey, J. Salamon, O. Ni-
[12] L. Su, T.-Y. Chuang, and Y.-H. Yang, “Exploiting eto, D. Liang, and D. P. W. Ellis, “mir eval: A transpar-
frequency, periodicity and harmonicity using advanced ent implementation of common mir metrics,” in Proc.
time-frequency concentration techniques for multipitch ISMIR, 2014.
estimation of choir and symphony,” in ISMIR, 2016.You can also read