Chromosome-level genome assembly of the humpback puffer, Tetraodon palembangensis
←
→
Page content transcription
If your browser does not render page correctly, please read the page content below
DATA R E L E A S E

                                              Chromosome-level genome
                                              assembly of the humpback puffer,
                                              Tetraodon palembangensis
                                              Rui Zhang1 , † , Chang Li1 , † , Mengjun Yu1 , † , Xiaoyun Huang1 , Mengqi Zhang1 ,
                                              Shanshan Liu1 , Shanshan Pan1 , Weizhen Xue1 , Congyan Wang1 ,
                                              Chunyan Mao1 , He Zhang1 , 2 , * and Guangyi Fan1 , *
                                         1 BGI-Qingdao, BGI-Shenzhen, Qingdao 266555, China
                                         2 Department of Biology, Hong Kong Baptist University, Hong Kong, China

                                                ABSTRACT
                                                The humpback puffer, Tetraodon palembangensis, is a poisonous freshwater pufferfish species
                                                mainly distributed in Southeast Asia (Thailand, Laos, Malaysia and Indonesia). The humpback
                                                puffer has many interesting biological features, such as inactivity, tetrodotoxin production and
                                                body expansion. Here, we report the first chromosome-level genome assembly of the humpback
                                                puffer. The genome size is 362 Mb, with a contig N50 value of ∼1.78 Mb and a scaffold N50 value
                                                of ∼15.8 Mb. Based on this genome assembly, ∼61.5 Mb (18.11%) repeat sequences were identified,
                                                19,925 genes were annotated, and the function of 90.01% of these genes could be predicted.
                                                Finally, a phylogenetic tree of ten teleost fish species was constructed. This analysis suggests
                                                that the humpback puffer and T. nigroviridis share a common ancestor 18.1 million years ago
                                                (MYA), and diverged from T. rubripes 45.8 MYA. The humpback puffer genome will be a valuable
                                                genomic resource to illustrate possible mechanisms of tetrodotoxin synthesis and tolerance.

                                              Subjects Animal and Plant Sciences, Animal Genetics, Functional Genomics, Marine Biology

  Submitted:       05 November 2020           DATA DESCRIPTION
  Accepted:        31 March 2021
  Published:       01 April 2021              Background and context
                                              The humpback puffer, Tetraodon palembangensis (NCBI Taxonomy ID: 1820603, Fishbase ID:
* Corresponding authors. E-mail:              25179), also known as Pao palembangensis, is widely distributed in Southeast Asia and
  zhanghe@genomics.cn;
  fanguangyi@genomics.cn                      prefers to live in alkalescent, warm (24–28°), and slow-flowing rivers (Figure 1a) [1]. The
                                              female and male humpback puffers have a similar body size, but the male’s rear hump is
† Contributed equally.                        much bigger than that of the female [2]. The humpback puffer is a popular ornamental fish
  Published by GigaScience Press.             because of its beautiful skin colouration and patterns. Unlike other species of predatory
  Preprint submitted at                       pufferfish, the humpback puffer is lazy and will not initiatively look for food [1].
  https://www.preprints.org/                  Furthermore, its body contains a deadly toxin, known as tetrodotoxin (TTX), and it can
  manuscript/202008.0694/v1
                                              swell up to three times its normal size as a defense mechanism when threatened [1].
  This is an Open Access article              Previous studies have shown that the toxicity of the humpback puffer varies greatly
  distributed under the terms of the
  Creative Commons Attribution                between seasons [3]. The wild population of humpback puffer has declined in recent years
  License (http://creativecommons.org/        owing to the destruction of suitable habitat caused by climate change and overfishing [4].
  licenses/by/4.0/), which permits
  unrestricted reuse, distribution, and          With these biological characteristics and a small genome size, the humpback puffer is an
  reproduction in any medium,                 ideal species for genetic study [5]. It is also a species in the Fish10K Genome Project, a
  provided the original work is
  properly cited.                             subproject of the Earth BioGenome Project, which aims to sample, sequence, assemble and
  Gigabyte, 2021, 1–12                        analyse the genomes of 10,000 fish species [6]. In this study, we provide a chromosome-scale

  Gigabyte, 2021, DOI: 10.46471/gigabyte.17                                                                                                        1/12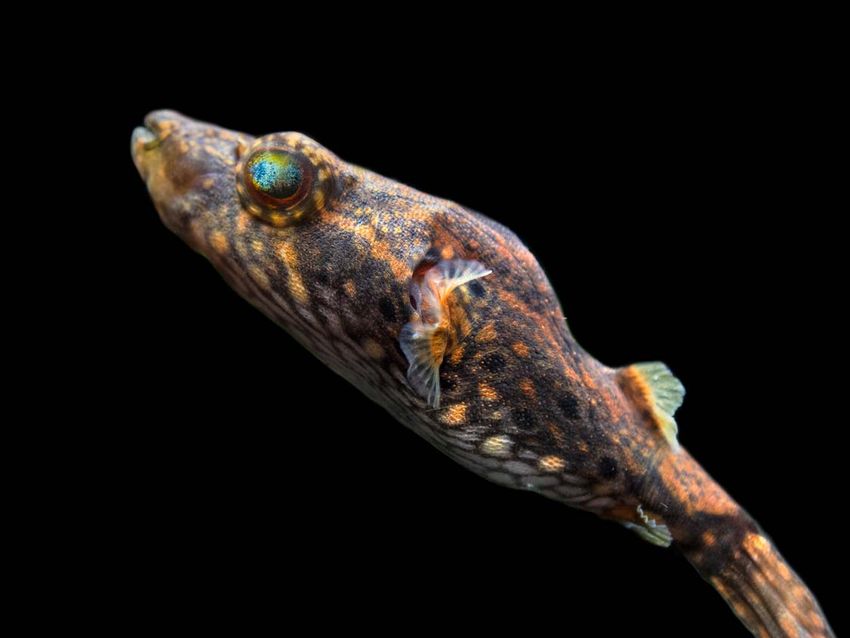
R. Zhang et al.
Figure 1. Tetraodon palembangensis. (a) Photograph of Tetraodon palembangensis. Photo courtesy of Preston Swipe, Aquatic Arts LLC. (b) The 17-mer depth
distribution of the stLFR reads. The estimated genome size is 385 Mb; heterozygosis is 0.21%.
genome assembly of the humpback puffer. This assembly will be valuable for further study
of mechanisms, such as tetrodotoxin synthesis and expansion defense. Comparative
genomic analysis will help us to better understand the phylogenetic evolution and special
gene families of the Tetraodontidae.
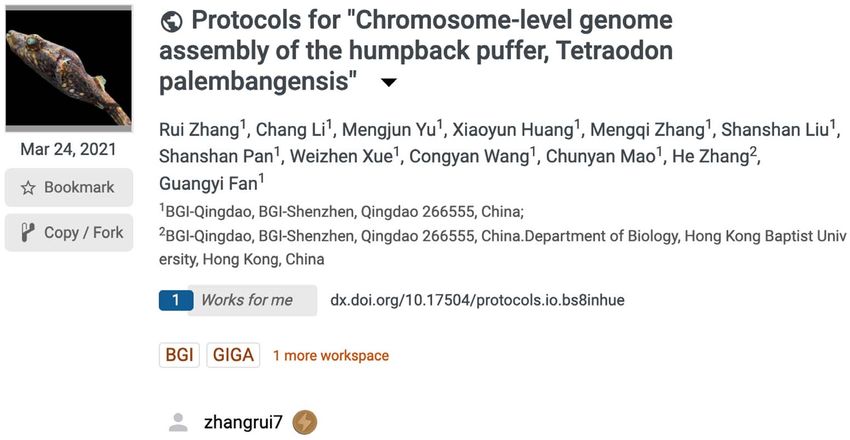
METHODS
All methods used to isolate DNA/RNA, construct libraries, and conduct genomic sequencing
are available in a protocols.io collection (Figure 2 [7]).
Sample collection and sequencing
The sample (CNGB ID: CNS0224034) used in this study was an adult humpback puffer
bought from the YueHe Flower-Bird-Fish market in Guangzhou Province, China. DNA and
RNA were both isolated from blood following published protocols [8, 9]. Then, a paired-end
single tube long fragment reads (stLFR) library and an RNA library were constructed
according to the protocol published by Wang et al. [10]. A Hi-C library was constructed from
blood according to the protocol published by Huang et al. [11]. These three libraries were
then sequenced on the BGISEQ-500 platform (RRID:SCR_017979) [12]. A Nanopore library
was constructed with DNA isolated from blood using the QIAamp DNA Mini Kit
(Qiagen) [13] and sequenced on the GridION platform (RRID:SCR_017986) [14]. In total, we
obtained 146 Gb (∼312×) raw stLFR data, 21 Gb raw RNA data, 19 GB (∼49×) raw Hi-C data,
and 12 GB (∼32×) raw Nanopore data (Table 1).
Raw stLFR reads were subjected to quality control to improve the assembly quality.
Firstly, we obtained co-barcoding information from the last 42 bases of read 1 and deleted
the last 42 bases. Then SOAPnuke (v1.6.5, RRID:SCR_015025) [15] was used to filter
remaining reads, using the parameters: “–M 1 –d –A 0.4 –n 0.05 –l 10 –q 0.4 –Q 2 –G –5 0” [16].
Gigabyte, 2021, DOI: 10.46471/gigabyte.17 2/12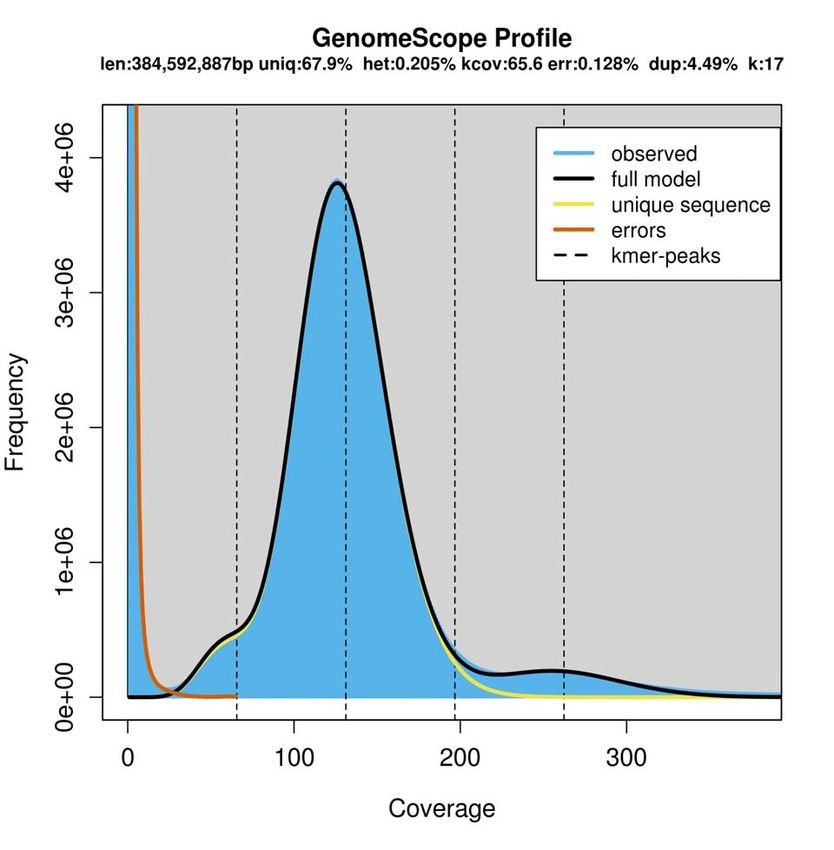
R. Zhang et al.

                                              Figure 2. Protocols.io collection for the chromosome-level genome assembly of the humpback puffer, Tetraodon
                                              palembangensis. https://www.protocols.io/widgets/doi?uri=dx.doi.org/10.17504/protocols.io.bs8inhue

                                             Table 1. Statistics of sequencing data.

                                               Libraries      Read lengths (bp)                     Raw data                          Valid data
                                                                                       Total bases (Gb)    Sequencing     Total bases (Gb)     Sequencing
                                                                                                            depth (×)                            depth (×)
                                                stFLR               PE100                    120.4           311.69             62.6              162.60
                                                 RNA                PE 100                    20.6              –               20.0                 –
                                                 Hi-C               PE 100                   19.01            49.43              5.4               14.04
                                               Nanopore           CN50: 32 kb                 12.3            31.98               –                  –

                                             Sequencing depth = total bases/genome size, where the genome size is the result of k-mer estimation in Table 2.
                                             Abbreviations: CN5, contig N50; PE, paired end.

                                             Table 2. Statistics of 17-mer analysis.

                                                    k-mer              k-mer number             k-mer depth (×)    Heterozygosity (%)       Genome size (bp)
                                                      17               48,458,703,762                126                 0.205                384,592,887

                                            Finally, 62 Gb (152×) clean data were retained for further assembly. Raw RNA reads were
                                            also filtered by SOAPnuke using the parameters: “–M 1 –A 0.4 –n 0.05 –l 10 –q 0.4 –Q 2 –G –5
                                            0”, generating 20 Gb clean data. Raw Hi-C data were produced with a quality control using
                                            HiC-Pro (v. 2.8.0) [16] with default parameters. This generated 5.4 Gb validated data, which
                                            accounted for 28.81% of all data (Table 1).

                                            Genome assembly
                                            Jellyfish (v2.2.6, RRID:SCR_005491) was used to count k-17mers of all clean stLFR reads [17].
                                            Genomescope [18] was used to estimate the humpback puffer genome size at about 385 Mb
                                            (Table 2 and Figure 1b).
                                               The genome size, G, was defined as G = K num ∕K depth , where the K num is the total number
                                            of k-mers, and K depth is the most frequently occurring frequency.
                                               To assemble the humpback puffer genome, we firstly converted the format of clean
                                            stLFR reads, then used Supernova (v. 2.0.1, RRID:SCR_016756) to perform the draft assembly.

Gigabyte, 2021, DOI: 10.46471/gigabyte.17                                                                                                                      3/12
R. Zhang et al.
Table 3. Statistics of the draft assembly of the humpback puffer genome.
Statistics Scaffold Contig
Total number (#) 5291 6190
Total length (bp) 361,704,206 360,427,744
Gap (N) (bp) 1,276,462 0
Average length (bp) 68,362 58,227
N50 length (bp) 7,059,990 1,830,664
N90 length (bp) 453,057 157,209
Maximum length (bp) 19,534,197 9,842,180
Minimum length (bp) 682 48
GC content (%) 44.66 44.66
Table 4. Statistics of the Hi-C scaffolding of the humpback puffer genome.
Statistics Scaffold Contig
Total number (#) 5366 6435
Total length (bp) 361,698,760 360,427,744
Gap (N) (bp) 1,271,016 0
Average length (bp) 67,406 56,011
N50 length (bp) 15,808,960 1,794,775
N90 length (bp) 11,014,520 117,115
Maximum length (bp) 34,916,285 9,792,502
Minimum length (bp) 682 48
GC content (%) 44.66 44.66
Then, we used GapCloser (v. 1.12, RRID:SCR_015026) [19] to fill gaps with stLFR reads. To
futher improve the assembly quality, TGSgapFiller [20] was then used to re-fill gaps with
Nanopore reads, and Pilon (v. 1.22, RRID:SCR_014731) [21] was used to polish the assembly
twice. At this stage, the genome assembly was about 362 Mb, with 7.1-Mb scaffold N50 and
1.8-Mb contig N50 values (Table 3).
With the genome and validated Hi-C data from HiC-Pro, the contact matrix was
generated by Juicer (v3, RRID:SCR_017226). Finally, we perfomed chromosomal-level
scaffolding using the 3D de novo assembly (3D-DNA) pipeline (v. 170123) [22]. This
anchored 91.2% of all sequences to 18 chromosomes, with a length ranging from 11 Mb to
35 Mb (Table 4 and Figure 3).
The karyotype differs among genuses in Tetraodontidae [23–27]. For example, Takifugu
rubripes, Takifugu obscurus and Takifugu flavidus have 2n = 44 chromosomes, while
Tetraodon nigroviridis and Tetraodon fluviatilis have 2n = 42 chromosomes. In addition,
Thamnaconus septentrionalis (Monacanthidae) has 2n = 40 chromosomes. Thus, we defined
the chromosome number of the humpback puffer to be 18, according to the apparent and
logical interactions by Hi-C reads.
Genomic annotation
Two methods were used to annotate repetitive sequences. Firstly, we aligned the genome to
the Repbase library by TRF (v.4.09) [28]. RepeatMasker (v. 3.3.0, RRID:SCR_012954) and
RepeatProteinMask (v. 3.3.0) [29] were then used to predict and classify the repetitive
sequences. Secondly, we constructed a repeat library using RepeatModeler (v1.0.8,
RRID:SCR_015027) and classified the transposable elements (TEs) with RepeatMasker
(v. 3.3.0) [29]. The results of both methods were amalgamated to give a total of 65 Mb repeat
sequences and 59 Mb TEs, accounting for 18.11% (Table 5 and Figure 4a) and 16.62% of the
entire genome, respectively (Table 6 and Figure 4a).
Gigabyte, 2021, DOI: 10.46471/gigabyte.17 4/12R. Zhang et al.
Figure 3. Heat map of chromosomal interaction from Hi-C reads. Grey lines show the border between
chromosomes.
Using the clean, reformatted stLFR reads, the mitochondrial genome of the humpback
puffer was assembled using MitoZ [30] with default parameters. Mitochondrial genes were
annotated using the MitoAnnotator tool of the mitofish pipeline [31] (Figure 4b). For gene
structural annotation, we performed de novo prediction using AUGUSTUS (v3.1,
RRID:SCR_008417) [32], GlimmerHMM (v3.0.4, RRID:SCR_002654) [33], and Genscan
(RRID:SCR_013362) [34]. We also used TRINITY (v2.8.5, RRID:SCR_013048) [35] to assemble a
draft transcriptome with clean RNA reads, then HISAT2 (v2.1.0, RRID:SCR_015530)-StringTie
(v1.3.4, RRID:SCR_016323) [36] and PASA (v2.3.3, RRID:SCR_014656)-TransDecoder
(RRID:SCR_017647) [37] to predict transcripts. GeneWise (v2.4.1, RRID:SCR_015054) [38] was
used for homologous annotation, with protein data obtained from the National Center for
Biotechnology Information (NCBI) database for the following eight species: Danio rerio
(NCBI, GenBank ID:50), Cynoglossus semilaevis (NCBI, GenBank ID:11788), Gasterosteus
aculeatus (NCBI, GenBank ID:146), Gadus morhua (NCBI, GenBank ID:2661), Larimichthys
Gigabyte, 2021, DOI: 10.46471/gigabyte.17 5/12R. Zhang et al.
Figure 4. Annotation of the Tetraodon palembangensis genome. (a) Basic genomic elements of the genome. LTR, long terminal repeat; LINE, long interspersed
nuclear elements; SINE, short interspersed elements. (b) Physical map of mitochondrial assembly.
Table 5. Statistics of repeat sequences.
Type Repeat size (bp) % of genome
TRF 9,050,571 2.52
RepeatMasker 34,142,529 9.50
RepeatProteinMask 17,674,660 4.92
De novo 57,492,865 16.00
Total 65,080,476 18.11
crocea (NCBI, GenBank ID:12197), Oreochromis niloticus (NCBI, GenBank ID:197), Oryzias
latipes (NCBI, GenBank ID:542), and Takifugu rubripes (NCBI, GenBank ID:63). Finally, these
three types of evidence were integrated using EVidenceModeler (v1.1.1,
RRID:SCR_014659) [39], generating 19,925 nonredundant coding genes, each containing an
average of 11 exons and a 1945 bp coding region (Table 7).
For gene function annotation, we aligned the 19,925 genes to the TrEMBL (UniProtKB,
RRID:SCR_004426) [40], Swissprot [41], Kyoto Enyclopedia of Genes and Genomes (KEGG,
RRID:SCR_012773) [42], Gene Ontology (GO, RRID:SCR_002811) [43] and InterProScan
(RRID:SCR_005829) [44] databases. Overall, 90.1% of all genes were able to be functionally
annotated (Table 8 and Figure 3).
Genome evolution
To study the evolutionary status of humpback puffer among bony fish species, we clustered
gene families by alignment using protein sequences of the humpback puffer and nine other
teleosts (Xiphophorus maculatus, Gasterosteus aculeatus, Sebastes schlegelii, Oryzias latipes,
Gadus morhua, Oreochromis niloticus, Tetraodon nigroviridis, Danio rerio, and Takifugu
rubripes) using the TreeFam v0.50 pipeline [45]. Protein-coding genes sequences for all of
Gigabyte, 2021, DOI: 10.46471/gigabyte.17 6/12R. Zhang et al.
Table 6. Statistics of transposable elements (TEs).
Type RepBase TEs TE proteins De novo Combined TEs
Length (bp) % of genome Length (bp) % of genome Length (bp) % of genome Length (bp) % of genome
DNA 12,412,491 3.45 1,086,262 0.30 16,089,219 4.48 22,470,373 6.25
LINE 18,430,929 5.13 13,695,154 3.81 29,418,621 8.19 33,421,782 9.30
SINE 524,061 0.15 0 0.00 289,252 0.08 789,086 0.22
LTR 5,393,600 1.50 2,906,451 0.81 12,758,934 3.55 15,803,098 4.40
Other 8,290 0.00 228 0.00 0 0.00 8,518 0.00
Unknown 0 0.00 0 0.00 3,202,764 0.89 3,202,764 0.89
Total 34,142,529 9.50 17,674,660 4.92 55,052,617 15.32 59,729,335 16.62
Abbreviations: LINE, long interspersed nuclear elements; LTR, long terminal repeats; SINE, short interspersed nuclear elements; TE, transposable elements.
Table 7. Statistics of the predicted genes in the humpback puffer genome.
Gene set Gene number Average Average CDS Average intron Average exon Average exons
transcript length (bp) length (bp) length (bp) per gene
length (bp)
Homolog Cynoglossus semilaevis 19,686 9136.12 1715.14 856.1 177.4 9.67
Danio rerio 19,348 15,066.80 1577.39 1718.92 178.28 8.85
Gadus morhua 20,361 7040.85 1441.77 744.62 169.23 8.52
Gasterosteus aculeatus 26,630 6896.85 1474.53 686.88 165.79 8.89
Larimichthys crocea 21,220 9425.27 1690.06 902.2 176.53 9.57
Oreochromis niloticus 24,562 9494.62 1789.15 829.18 173.82 10.29
Oryzias latipes 23,332 8859.46 1467.62 962.5 169.08 8.68
Takifugu rubripes 19,635 7762.47 1645.04 707.22 170.47 9.65
De novo Augustus 21,662 7149.08 1725.00 659.42 186.98 9.23
Genscan 25,933 9855.53 1791.43 990.72 196.01 9.14
GlimmerHMM 99,722 1192.96 594.53 378.42 230.31 2.58
Transcript Pasa & Transdecoder 33,965 4856.71 1186.88 558.33 156.73 7.57
Hisat & Stringtie 31,664 5551.59 1303.52 608.39 163.3 7.98
EVM 19,925 9418.80 1945.48 757.65 179.08 10.86
The EVM gene set contains the integrated result of De novo gene predictions, homolog gene predictions and transcript annotation by EVM software.
Table 8. Statistics of the functional annotation.
Database Number of genes Gene functionally annotated (%)
Total 20,057 100.00
SwissProt 17,333 86.42
KEGG 16,182 80.68
TrEMBL 18,037 89.93
Interpro 17,108 85.30
Overall 18,064 90.06
these species were downloaded from NCBI, except for S. schlegelii [46], which was obtained
from the China National Genebank Nucleotide Sequence Archive (CNSA; Accession ID:
CNP0000222). To improve analysis quality, we removed genes either with frameshifts, or
less than 50 amino acids, as well as redundant copies, only keeping the longest transcripts
for comparative genomic analysis. A total of 21,022 gene families were identified, of which
40 gene families were unique to the humpback puffer (Table 9 and Figure 5a).
Of all 21,022 gene families, we identified 4461 single-copy protein-coding genes shared
by all species. We used MUSCLE v3.8.31 [47] to align these orthologs, with default
parameters. Then, the alignments were concatenated into a 3,584,782 amino acid “super
alignment matrix”. Based on this matrix, a phylogenetic tree was constructed using RAxML
v8.2.4 [48], with the best amino acid substitution model-JTT. Clade support was assessed
Gigabyte, 2021, DOI: 10.46471/gigabyte.17 7/12R. Zhang et al.
Figure 5. Comparative analysis of the Tetraodon palembangensis and nine teleosts. (a) Clustering of gene families.
(b) Phylogenetic tree constructed with the single-copy gene families. The fossil correction nodes in the tree are
highlighted by red dots.
using a bootstrapping algorithm with 1000 alignment replicates (Figure 5b). Next, we
calculated the divergence time among these teleosts using the MCMCTree tool included in
PAML (v4.7a, RRID:SCR_014932) [49], with parameters of “–rootage 500 -clock 3 -alpha
0.431879”. The fossil correction time (Table 10) was obtained from Timetree [50]. The result
showed that the humpback puffer and T. nigroviridis, two species belonging to the same
genus, shared a common ancestor 18.1 millon years ago (MYA) and diverged from
T. rubripes 18.1 MYA (Figure 5b).
Gigabyte, 2021, DOI: 10.46471/gigabyte.17 8/12R. Zhang et al.
Table 9. Statistics of gene family clustering.
Species Total number Number of Number of gene Number of Average number
of genes unclustered families unique families of genes per
genes family
D. rerio 30,067 2171 18,635 735 1.5
G. aculeatus 20,756 728 15,995 11 1.25
G. morhua 19,987 525 15,650 11 1.24
S. schlegelii 24,094 558 16,991 30 1.39
O. latipes 19,535 984 14,873 71 1.25
O. niloticus 21,431 160 15,811 13 1.35
T. nigroviridis 19,544 805 14,916 50 1.26
T. palembangensis 19,796 690 15,830 40 1.21
T. rubripes 18,459 207 14,733 6 1.24
X. maculatus 20,356 271 16,446 3 1.22
Table 10. Fossil correction time used in divergence analysis.
Taxon 1 Taxon 2 Fossil time (MYA) Minimum (MYA) Maximum (MYA)
Takifugu rubripes Tetraodon nigroviridis 52 42 59
Takifugu rubripes Gadus morhua 148 141 170
Oryzias latipes Xiphophorus maculatus 93 76 111
Oryzias latipes Gasterosteus aculeatus 128 105 154
Oryzias latipes Danio rerio 229.9 204.5 255.3
Table 11. Statistics of the BUSCO assessment.
Types of BUSCOs Genome assembly Gene set
Number Percentage (%) Number Percentage (%)
Complete BUSCOs 3486 95.7 3303 90.7
Complete and single-copy BUSCOs 3427 94.1 3252 89.3
Complete and duplicated BUSCOs 59 1.6 51 1.4
Fragmented BUSCOs 45 1.2 96 2.6
Missing BUSCOs 109 3.1 241 6.7
Total BUSCOs groups searched 3640 100 3640 100
DATA VALIDATION AND QUALITY CONTROL
To demonstrate the quality of genome assembly and gene set, we performed a qulity
evaluation using the actinopterygii_odb10 database from Benchmarking Universal
Single-Copy Orthologs (BUSCO v.4.1.2, RRID:SCR_015008) [51]. The results showed that 95.7%
and 90.7% complete BUSCOs were covered by the genome assembly and gene set,
respectively (Table 11).
REUSE POTENTIAL
We assembled the first annotated chromosome-level genome of the humpback puffer.
These resources will be helpful to study the mechanism of body expansion displayed by this
fish species, the synthesis mechanism and treatment of tetrodotoxin, as well as the
evolution of freshwater puffer. Futhermore, the humpback puffer genome will fill a gap
missing from the Fish 10K program and in the phylogenetic tree of life.
DATA AVAILABILITY
We have deposited the project at CNGB Nucleotide Sequence Archive (CNSA) where the
accession ID is CNP0001025. The genomic data can be obtained in GigaScience Database [52].
Gigabyte, 2021, DOI: 10.46471/gigabyte.17 9/12R. Zhang et al.
The sequencing data have been deposited at National Center for Biotechnology Information
(NCBI) where the bioproject accession ID is PRJNA597275.
DECLARATIONS
LIST OF ABBREVIATIONS
bp: base pair; BUSCO: Benchmarking Universal Single-Copy Orthologs; CNSA: China
National Gene Bank Nucleotide Sequence Archive; Gb: gigabase; GO: Gene Ontology; kb:
kilobase; KEGG: Kyoto Enyclopedia of Genes and Genomes; Mb: megabase; ML: Maximum
Likelihood; NCBI: National Center for Biotechnology Information; stLFR: single tube long
fragment reads; TE: transposable element.
ETHICAL APPROVAL
All resources used in this study were approved by the Institutional Review Board of BGI
(IRB approval No. FT17007). This experiment has passed the ethics audit of Beijing
Genomics Institute (BGI) Gene Bioethics and Biosecurity Review Committee.
CONSENT FOR PUBLICATION
Not applicable.
COMPETING INTERESTS
The authors declare that they have no competing interests.
FUNDING
This work was supported by the special funding of “Blue granary” scientific and
technological innovation of China (2018YFD0900301-05).
AUTHORS’ CONTRIBUTIONS
H.Z. and G.F. designed this project. M.Z. prepared the samples. S.L., S.P., W.X., C.W. and C.M.
conducted the experiments. R.Z., C.L., M.Y. and X.H. did the analyses. R.Z., C.L. and M.Y.
wrote and revised the manuscript. All authors read and approved the final version of the
manuscript.
ACKNOWLEDGEMENTS
We thank for the China National Genebank for technical support in constructing and
sequencing the stLFR library.
REFERENCES
1 Saitanu K et al. Toxicity of the freshwater puffer fish Tetraodon fangi and T. palembangensis from
Thailand. Toxicon, 1991; 29: 895–897.
2 Subamia IW, Sudarto S, Purbowasito W, Sex determination in Indonesian pufferfish Tetraodon
palembangensis Bleeker, 1852: implication for aquaculture and conservation. Indones. Aquac. J., 2011;
6: 37–45.
3 Jaillon O et al. Genome duplication in the teleost fish Tetraodon nigroviridis reveals the early
vertebrate proto-karyotype. Nature, 2004; 431: 946–957.
4 Sutaria D, Panicker D, Jog K, Sule M, Muralidharan R, Bopardikar I, Humpback dolphins (Genus
Sousa) in India: an overview of status and conservation issues. Adv. Marine Biol., 2015; 72: 229–256.
5 Hedges SB, The origin and evolution of model organisms. Nat. Rev. Genet., 2002; 3: 838–849.
6 Fan G et al. Initial data release and announcement of the 10,000 Fish Genomes Project (Fish10K).
GigaScience, 2020; 9: giaa080.
Gigabyte, 2021, DOI: 10.46471/gigabyte.17 10/12R. Zhang et al.
7 Zhang R et al. Protocols for “Chromosome-level genome assembly of the humpback puffer, Tetraodon
palembangensis”. protocols.io. 2021; https://dx.doi.org/10.17504/protocols.io.bs8inhue.
8 Chang L, Hi-C library preparation for the Lateolabrax maculatus genome. protocols.io. 2018l;
https://dx.doi.org/10.17504/protocols.io.ss4eegw.
9 Julkowska M, Protocols for “RNA isolation with TRIzol”. protocols.io. 2018;
https://dx.doi.org/10.17504/protocols.io.pbndime.
10 Wang O et al. Efficient and unique cobarcoding of second-generation sequencing reads from long DNA
molecules enabling cost-effective and accurate sequencing, haplotyping, and de novo assembly.
Genome Res., 2019; 29: 798–808.
11 Huang J et al. BGISEQ-500 WGS library construction. protocols.io. 2018;
https://dx.doi.org/10.17504/protocols.io.ps5dng6.
12 Huang J, BGISEQ-500 sequencing. protocols.io. 2018; https://dx.doi.org/10.17504/protocols.io.pq7dmzn.
13 Pederson ER, RNA and DNA extraction (Qiagen) of frozen tissue to nanopore sequencing. protocols.io.
2021; https://dx.doi.org/10.17504/protocols.io.bj7tkrnn.
14 Zhang R, Oxford Nanopore sequencing and library construction. protocols.io. 2021;
https://dx.doi.org/10.17504/protocols.io.btignkbw.
15 Chen Y et al. SOAPnuke: a MapReduce acceleration-supported software for integrated quality control
and preprocessing of high-throughput sequencing data. Gigascience, 2018; 7: gix120.
16 Servant N et al. HiC-Pro: an optimized and flexible pipeline for Hi-C data processing. Genome Biol.,
2015; 16: 259.
17 Li R et al. The sequence and de novo assembly of the giant panda genome. Nature, 2010; 463: 311–317.
18 Vurture GW et al. GenomeScope: fast reference-free genome profiling from short reads.
Bioinformatics, 2017; 33: 2202–2204.
19 Luo R et al. SOAPdenovo2: an empirically improved memory-efficient short-read de novo assembler.
Gigascience, 2012; 1: 18.
20 Xu M, Guo L, Gu S, Wang O, Zhang R, Peters BA, Fan G, Liu X, Xu X, Deng L, Zhang Y, TGS-GapCloser:
A fast and accurate gap closer for large genomes with low coverage of error-prone long reads.
Gigascience, 2020; 9(9): giaa094. doi:10.1093/gigascience/giaa094.
21 Walker BJ et al. Pilon: an integrated tool for comprehensive microbial variant detection and genome
assembly improvement. PloS One, 2014; 9: e112963.
22 Liu X, Protocols for “the pipeline of Hi-C assembly”. protocols.io. 2018;
http://dx.doi.org/10.17504/protocols.io.qradv2e.
23 Wataru K et al. Integration of the genetic map and genome assembly of fugu facilitates insights into
distinct features of genome evolution in teleosts and mammals. Genome Biol. Evol., 2011; 3: 424–442.
24 Kang S et al. Chromosomal-level assembly of Takifugu obscurus (Abe, 1949) genome using
third-generation DNA sequencing and Hi-C analysis. Mol. Ecol. Resour., 2020; 20: 520–530.
25 Zhou Y et al. Chromosome genome assembly and annotation of the yellowbelly pufferfish with PacBio
and Hi-C sequencing data. Sci. Data, 2019; 6: 267.
26 Mandrioli M, Cuoghi B, Marini M, Manicardi GC, Cytogenetic analysis of the pufferfish Tetraodon
fluviatilis (Osteichthyes). Chromosome Res., 2000; 8: 237.
27 Li F et al. Morphological structure and karyotype of Thamnaconus septentrionalis. South China
Fisheries Science, 2019; 15: 104–112.
28 Benson G, Tandem repeats finder: a program to analyze DNA sequences. Nucleic Acids Res., 1999; 27:
573–580.
29 Tarailo-Graovac M, Chen N, Using RepeatMasker to identify repetitive elements in genomic sequences.
Curr. Protoc. Bioinformatics, 2009; 25: 4.10.1–4.10.14.
30 Meng G, Li Y, Yang C, Liu S, MitoZ: a toolkit for animal mitochondrial genome assembly, annotation
and visualization. Nucleic Acids Res., 2019; 47: e63.
31 Wataru I et al. MitoFish and MitoAnnotator: a mitochondrial genome database of fish with an accurate
and automatic annotation pipeline. Mol. Biol. Evol., 2013; 30: 2531–2540.
32 Stanke M, Keller O, Gunduz I, Hayes A, Waack S, Morgenstern B, AUGUSTUS: ab initio prediction of
alternative transcripts. Nucleic Acids Res., 2006; 34(suppl_2): W435–W439.
Gigabyte, 2021, DOI: 10.46471/gigabyte.17 11/12R. Zhang et al.
33 Majoros WH, Pertea M, Salzberg SL, TigrScan and GlimmerHMM: two open source ab initio
eukaryotic gene-finders. Bioinformatics, 2004; 20: 2878–2879.
34 Burge C, Karlin S, Prediction of complete gene structures in human genomic DNA. J. Mol. Biol., 1997;
268: 78–94.
35 Grabherr MG et al. Full-length transcriptome assembly from RNA-Seq data without a reference
genome. Nat. Biotechnol., 2011; 29: 644.
36 Pertea M, Kim D, Pertea GM, Leek JT, Salzberg SL, Transcript-level expression analysis of RNA-seq
experiments with HISAT, StringTie and Ballgown. Nat. Protoc., 2016; 11: 1650.
37 Campbell MA, Haas BJ, Hamilton JP, Mount SM, Buell CR, Comprehensive analysis of alternative
splicing in rice and comparative analyses with Arabidopsis. BMC Genomics, 2006; 7: 327.
38 Doerks T, Copley RR, Schultz J, Ponting CP, Bork P, Systematic identification of novel protein domain
families associated with nuclear functions. Genome Res., 2002; 12: 47–56.
39 Haas BJ et al. Automated eukaryotic gene structure annotation using EVidenceModeler and the
Program to Assemble Spliced Alignments. Genome Biol., 2008; 9: R7.
40 Elsik CG, Mackey AJ, Reese JT, Milshina NV, Roos DS, Weinstock GM, Creating a honey bee consensus
gene set. Genome Biol., 2007; 8: R13.
41 Bairoch A, Apweiler R, The SWISS-PROT protein sequence database and its supplement TrEMBL in
2000. Nucleic Acids Res., 2000; 28: 45–48.
42 Kanehisa M, Goto S, KEGG: kyoto encyclopedia of genes and genomes. Nucleic Acids Res., 2000; 28:
27–30.
43 Harris MA, Clark J, Ireland A, Lomax J, Ashburner M, Foulger R, The Gene Ontology (GO) database
and informatics resource. Nucleic Acids Res., 2004; 32(Suppl_1): D258–D261.
44 Jones P et al. InterProScan 5: genome-scale protein function classification. Bioinformatics, 2014; 30:
1236–1240.
45 Li H et al. TreeFam: a curated database of phylogenetic trees of animal gene families. Nucleic Acids
Res., 2006; 34: D572.
46 He Y et al. A chromosome level genome of black rockfish, Sebastes schlegelii, provides insights into the
evolution of live birth. Mol. Ecol. Resour., 2019; 19: 1309–1321.
47 Edgar RC, MUSCLE: multiple sequence alignment with high accuracy and high throughput. Nucleic
Acids Res., 2004; 19(32): 1792–1797.
48 Stamatakis A, RAxML-VI-HPC: Maximum likelihood-based phylogenetic analyses with thousands of
taxa and mixed models. Bioinformatics, 2006; 22: 2688–2690.
49 Yang Z, PAML: a program package for phylogenetic analysis by maximum likelihood. Bioinformatics,
1997; 13: 555–556.
50 Sudhir K, Stecher G, Suleski M, Hedges SB, TimeTree: a resource for timelines, timetrees, and
divergence times. Mol. Biol. Evol., 2017; 34: 1812.
51 Simão FA, Waterhouse RM, Ioannidis P, Kriventseva EV, Zdobnov EM, BUSCO: assessing genome
assembly and annotation completeness with single-copy orthologs. Bioinformatics, 2015; 31:
3210–3212.
52 Zhang R et al. Genome data for the chromosome-level assembly of the humpback puffer, Tetraodon
palembangensis. GigaScience Database. 2020; http://dx.doi.org/10.5524/100755.
Gigabyte, 2021, DOI: 10.46471/gigabyte.17 12/12You can also read