Life Cycle Assessment of North American Stormwater Pipe Systems - TR-53 2021
←
→
Page content transcription
If your browser does not render page correctly, please read the page content below
Life Cycle Assessment of
     North American
Stormwater Pipe Systems

         TR-53

         2021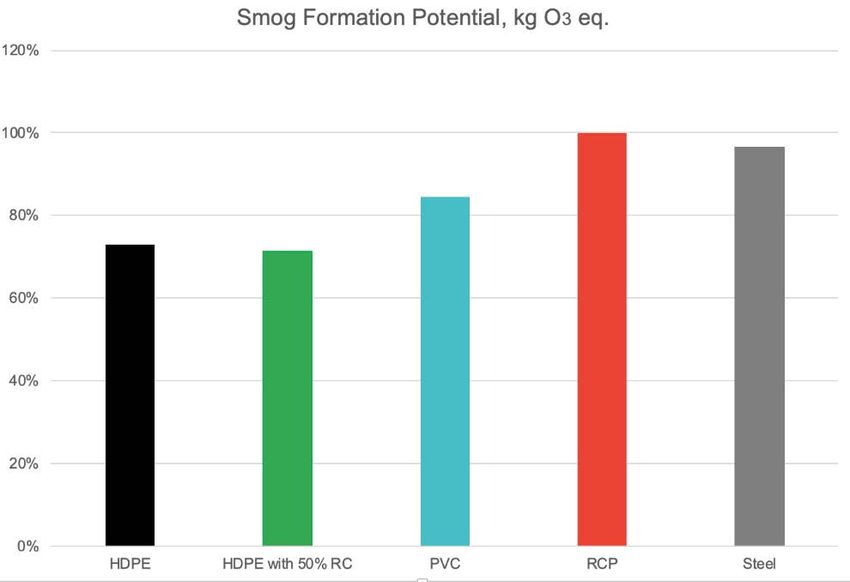
Foreword

This technical report was developed and published with the technical help and financial
support of the members of the Plastics Pipe Institute (PPI). These members have
shown their commitment to developing and improving quality products by assisting
standards development organizations in the development of standards, and also by
developing design aids and reports to help engineers, code officials, specifying groups,
contractors and users.

The purpose of this technical report is to summarize the Life Cycle Assessment (LCA)
completed for the Drainage Division by Franklin Associates in 2020. The completed
LCA is over 140 pages in length and can be requested in its entirety from PPI. The LCA
reviews the impact to the environment of corrugated HDPE pipe made with virgin and
recycled materials, reinforced concrete pipe, PVC pipe and aluminized steel pipe over a
100-year service life period. The results demonstrate that corrugated HDPE pipe is the
most environmentally sustainable choice for storm drainage pipe material.

PPI has prepared this technical report as a service to the industry. The information in
this report is offered in good faith and believed to be accurate at the time of its
preparation, but is offered “as is” without any express or implied warranty, including
WARRANTIES OF MERCHANTABILITY AND FITNESS FOR A PARTICULAR
PURPOSE. Additional information may be needed in some areas, especially with regard
to unusual or special applications. Consult the manufacturer or material supplier for
more detailed information. A list of member manufacturers is available on the PPI
website. PPI does not endorse the proprietary products or processes of any
manufacturer and assumes no responsibility for compliance with applicable laws and
regulations.

PPI intends to revise this technical report within five years, or sooner if required, from
the date of its publication, in response to comments and suggestions from users of the
document. Please send suggestions of improvements to the address below. Information
on other publications can be obtained by contacting PPI directly or visiting our website.

                             The Plastics Pipe Institute, Inc.

                               https://www.plasticpipe.org/

                This Technical Report was first issued in January 2021.

                            © 2021 The Plastics Pipe Institute, Inc.

                                              ii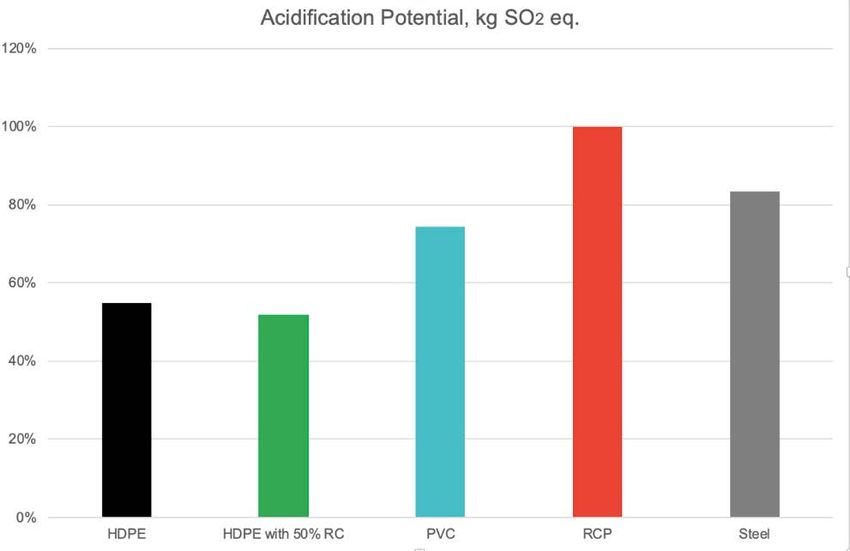
Table of Contents

1.0 Introduction .................................................................................................................. 1
2.0 LCA Methodology ......................................................................................................... 1
   2.1. Goal and scope definition ...................................................................................... 1
             Allocation procedures ..................................................................................... 3
             Assumptions ................................................................................................... 3
             Comparative assertion.................................................................................... 5
             Peer-review .................................................................................................... 5
   2.2. Life-cycle inventory analysis .................................................................................. 5
   2.3. Life-cycle impact assessment................................................................................ 5
   2.4. Life-cycle Interpretation ......................................................................................... 6
             Results ........................................................................................................... 7
             Sensitivity Analyses ...................................................................................... 16

                                                     Table of Figures
Figure 1: Comparison of relative global warming potential (GWP) ........................................ 9
Figure 2: Comparison of relative acidification potential (AP). .............................................. 10
Figure 3: Comparison of relative eutrophication potential (EP) ........................................... 11
Figure 4: Comparison of relative ozone depletion potential (ODP) ..................................... 12
Figure 5: Comparison of relative smog formation potential (SFP) ....................................... 13
Figure 6: Comparison of relative total energy demand ....................................................... 14
Figure 7: Comparison of relative solid waste ...................................................................... 15
Figure 8: Comparison of relative water consumption .......................................................... 16

                                                       List of Tables
Table 1: Results for 24-in.-diameter Stormwater Pipe .......................................................... 8
Table 2: Comparative Results with HDPE baseline for 24-in.-diameter Stormwater Pipe ..... 8
Table 3: Comparative Results with HDPE with 50% recycled content baseline .................... 8

                                                                 iii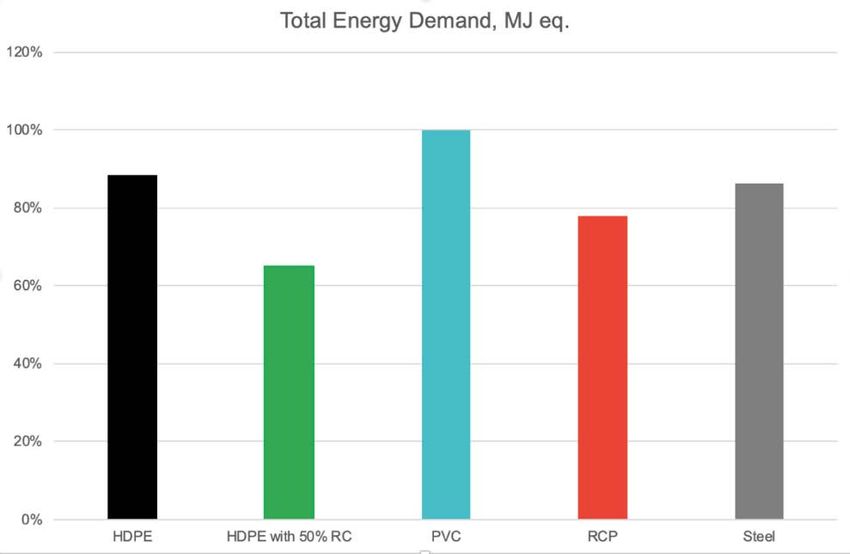
Life Cycle Assessment of
                         North American Stormwater Pipe Systems

1.0     INTRODUCTION

       Plastics Pipe Institute funded a research project titled, “Life Cycle Assessment of
       North American Municipal Stormwater Pipe Systems,” which was performed by
       Franklin Associates, a division of ERG completed April 2020. The purpose of this
       technical note is to summarize the scope and methodology of the research program
       and highlight the results, which are the environmental impacts of high-density
       polyethylene (HDPE) and alternative stormwater pipe systems.

       This information will assist PPI members in communicating the environmental impacts
       of HDPE pipe systems. It will also provide specifiers, owners, and others with useful
       information when selecting which technology to employ for stormwater pipe systems.

2.0 LCA METHODOLOGY

       Life-cycle assessment (LCA) is an internationally accepted method used to quantify
       the environmental impact of a product or process over its entire life cycle. LCA can be
       performed on a simple product (like a pencil), a complex product (like a building), or a
       process (such as the process for manufacturing a car). Two international standards
       govern the LCA methods: ISO 14040, Environmental management—Life cycle
       assessment—Principles and framework, and ISO 14044, Environmental
       management—Life cycle assessment—Requirements and guidelines. These
       standards set minimum requirements for performing an LCA in four main areas:

       •   Goal and scope definition
       •   Life-cycle inventory (LCI) analysis
       •   Life-cycle impact assessment
       •   Life-cycle interpretation

      2.1. Goal and scope definition

           During this phase of the LCA, a number of important decisions are made
           related to the goal and scope of the project. In defining the goal of the study,
           the following items are established related to the research:

           o the intended application and audience,
           o the reasons for conducting it, and
           o whether the results will be used for comparative assertions.

                                                 1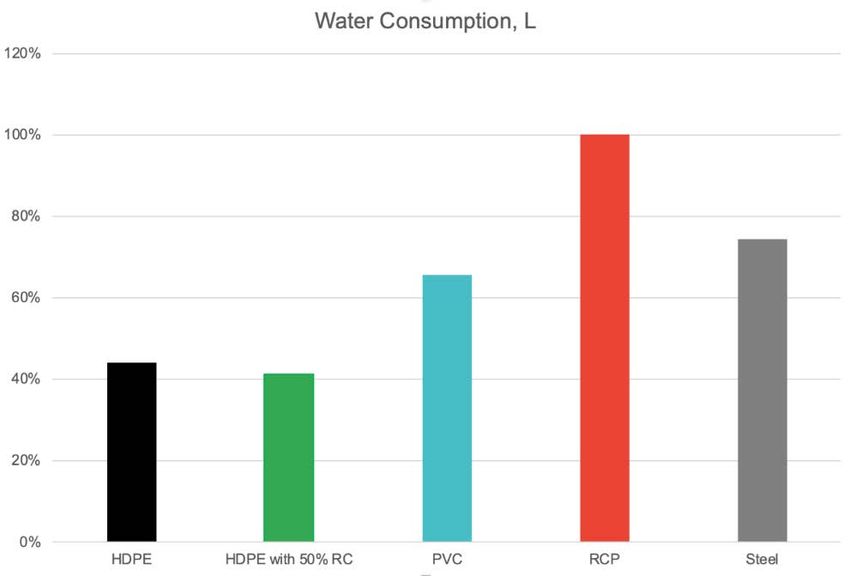
The goal of the PPI study is to develop baseline data for North American
corrugated HDPE pipe used as municipal stormwater drainage pipe. The HDPE
pipe systems are compared to alternative material piping systems used for the
same applications. The intended use of this study is to inform PPI and its
member companies about the environmental profiles of HDPE and alternative
stormwater pipe systems.

In the full LCA report, the results are presented by life-cycle stage (for example,
pipe production, installation, use, end of life management). However, in this
technical note, the results are presented in aggregated form for the full life
cycle. The LCA has been conducted following internationally accepted (ISO)
standards for LCI methodology. Since PPI is using this report as the basis for
public comparative assertions about HDPE pipe systems and alternative pipe
systems, a panel peer review of the study is required for conformance with ISO
LCA standards.

The scope phase of the LCA establishes such things as the product system
studied, the function of the product systems, the functional unit, the system
boundary, the allocation procedures, and any assumptions, among other ISO-
14044 requirements. For the current LCA, a functional unit of 1000 ft of 24-in.-
diameter piping is used with an assumed 100 year length of service.

The following functionally equivalent pipe systems were chosen to be studied in
the LCA. Each system is made of a different material, but overall
measurements and expected performance are unchanged.

o 24-in. corrugated high-density polyethylene (HDPE) double-wall pipe made
  with virgin HDPE and having bell and spigot joints with gasket
o 24-in. corrugated HDPE pipe made with 50% post-consumer recycled
  content, and having bell and spigot joints with gasket
o 24-in. corrugated polyvinyl chloride (PVC) double-wall pipe with PVC bell
  and spigot joints with gasket
o 24-in. Class III reinforced concrete pipe (RCP) with concrete bell and spigot
  joints with gasket
o 24-in. aluminum coated type 2 spiral-wound corrugated steel pipe with
  gasket

Although LCA studies can be performed with a more-limited scope or time
scale, the most representative accounting of a product’s environmental impact
includes all environmental flows over the full life of the product. Thus the full life
cycle of the pipe systems—from extracting raw materials from nature, any
transformation or manufacturing of these raw materials into a product, the
product use, to end-of-life scenarios—was included in this study, which is also
called a cradle-to-grave LCA.

                                     2
Three different end-of-life scenarios were considered: leave-in-place, recycle,
and landfill. Only the results of the leave-in-place scenario are presented, which
assumes that once the pipes are done with 100 years of service without
complications, they will be left in the ground. Results from all three end-of-life
scenarios are included in the full LCA, but only the leave-in-place scenario is
included in this technical note. There is considerable uncertainty with how
products will be handled at the end of their service lives so far in the future.
This level of uncertainty is one reason why many manufacturers have avoided
full cradle-to-grave LCA studies. The leave-in-place scenario has the fewest
assumptions and the least uncertainty given that future technology related to
recycling or landfilling is unknown. Thus, because of the significant uncertainty
related to circumstances 100 years in the future, the leave-in-place scenario is
conservative when estimating the end-of-life impacts for all pipe systems.
Allocation procedures
When raw materials and emissions associated with the manufacturing
process cannot be easily attributed to several product outputs from a
system, these LCI data must be allocated to the various co-products. There
are several methods available to allocate co-products, and in this LCA,
mass and enthalpy allocation are used.
Co-product allocations were needed in this LCA due to the multiple useful
outputs from some of the “upstream” chemical processes involved in
producing the resins used to manufacture plastic pipes and fittings. In this
LCA, environmental impacts were assigned to any useful process output
that is produced and sold. All scrap co-product was allocated on a mass
basis.
For heat or steam co-products or a co-product sold for use as a fuel, the
energy amount (Btu or J) of the heat, steam, or fuel was allocated as
recovered energy that reduced the net process energy assigned to the
resin.
Assumptions
There are a number of assumptions made for any LCA study, which must
be presented to put the results in the correct context. It’s worth noting that,
for comparative assertions, ISO 14044 requires that assumptions related to
non-represented industries be conservative. Because this study is a
comparative assertion and non-HDPE industries were not involved in the
decision-making process for assumptions, the ISO standard requires that
the non-represented industries be given the benefit of a decision.
3Many of the conservative assumptions made during this study are described
in the following:
Companies operate in compliance with emissions standards. If
actual industry emissions data are not available, published emissions
standards are used as the basis for determining environmental
emissions. In reality, exceptions to compliance may occur.
Energy and emissions for production of imported crude oil is
assumed to be the same as that for U.S. crude oil. This assumption is
followed even though standards and regulations for foreign production
can vary significantly from those of the United States.
Space-conditioning energy in manufacturing facilities is much less
than process energy. The fuels and power consumed to heat, cool, and
light manufacturing establishments are omitted from the calculations.
Energy consumed for space conditioning is usually less than one
percent of the total energy consumption for the manufacturing process.
Energy and waste associated with research and development, sales,
and administrative personnel or related activities are also small and have
been omitted from this study.
The energy and emissions associated with production of capital
equipment, facilities, and infrastructure are not included.
Miscellaneous materials and additives (catalysts, pigments, or other
additives) that total less than one percent by weight of the net process
inputs are typically not included. No low-level use of resource-intensive
or high-toxicity chemicals or additives was identified for any of the pipe
systems; therefore, they are not expected to significantly affect the
results.
Inputs and outputs reported in the data sources used account for any
input materials that are converting scrap.
Transportation to construction site by tractor-trailer for all pipe types.
Pipes did not develop cracks that may cause leakage and water
contamination. This analysis did not attempt to quantify rates of cracks
and leakage from the stormwater pipe systems evaluated, nor does the
analysis address potential human or ecosystem health issues that could
result from contamination issues associated with stormwater pipe cracks
and leakage.
Pipes did not require replacement during the 100-year service life.
While some pipe systems have proven service lives of 100 years, other
systems are known to be more susceptible to corrosion or deleterious
contaminants.
The need for high-quality backfill soil was identical for HDPE, PVC, and
steel pipe systems, and reinforced concrete pipe used more native soil.
This is a conservative assumption, especially for installations beneath
pavement or inside the public right-of-way.
4Comparative assertion
The LCA study was conducted “as the basis for public comparative
assertions about PE pipe systems and alternative pipe systems.” ISO 14044
requires an additional level of technical rigor for these types of studies,
especially if representatives of the alternative-pipe-system industries are not
involved in the development or review process, which was the case in this
project.
Peer-review
The full LCA report was reviewed by an external peer-review panel “to
ensure the study has been conducted in a manner consistent with ISO
14044 standards, including goal and scope, data acquisition and
compilation, key assumptions, and interpretation of results.” The peer-
review panel adequately fulfilled its duty to perform an unbiased external
peer review that was in conformance with the ISO 14044 standard. In
addition, the LCA practitioner appropriately responded to the external peer-
review comments.
2.2. Life-cycle inventory analysis
Environmental flows are material and energy resources that go into a product,
as well as all emissions to air, water, and land that result from its manufacture
and use. This phase of an LCA involves handling and tracking data related to
materials, water, and energy use, as well as emissions to air, water, and land
(typically in the form of waste).
The primary data for this study were provided directly from PPI members that
produce virgin and recycled HDPE pipe types. Data for the other industries
(PVC, concrete, and steel) were provided from sources such as the 2015 Uni-
Bell PVC pipe environmental declaration (EPD), Franklin Associates’ United
States industry average database, the U.S. LCI Database, and the European
ecoinvent database (adapted to represent U.S. conditions where appropriate).
2.3. Life-cycle impact assessment
For the life-cycle impact assessment phase of the LCA, data compiled during
the LCI phase is converted into environmental impacts with the use of
characterization factors. Computer models are used to assist with the data
compilation and assignment of environmental impacts.
5For this LCA, the characterization factors from two sources were used to
convert LCI data into the following environmental impact categories:
o Global warming potential (kg CO2 eq.)
o Acidification potential (kg SO2 eq.)
o Eutrophication potential (kg N eq.)
o Ozone depletion potential (kg CFC-11 eq.)
o Smog formation potential (kg O3 eq.)
For global warming potential (GWP), LCI data are characterized using factors
reported by the Intergovernmental Panel on Climate Change (IPCC) with a 100-
year time horizon. For the other categories, the U.S. EPA TRACI 2.1 method
was used.
Global warming potential (GWP), which is synonymous with potential to cause
climate change, is the most-commonly known environmental impact category. It
is expressed in terms of mass of carbon-dioxide (CO2) equivalent, which means
that all other greenhouse gas (GHG) emissions are normalized to an equivalent
amount of CO2 emissions. For example, 1 unit of mass of methane is
equivalent to approximately 30 units of mass of carbon dioxide related to the
effect the gas has on climate change.
Acidification potential is related to chemical compounds that are precursors to
acidic rain. These compounds are most often released in fuel combustion,
which can occur in manufacturing and transportation of piping. The units are in
terms of sulfur dioxide (SO2), which is the most common precursor to acid rain.
Eutrophication potential refers to the enrichment of bodies of water with
minerals and nutrients. Over enrichment can result in reduced oxygen counts in
the water, causing damage to the ecosystem, usually through the use of
fertilizers and detergents. This is measured in unit mass of nitrogen (N), the
primary nourishing compound.
Ozone depletion potential is the measure of a compound's potential to remove
protective ozone from the atmosphere, measured in standard units of
trichlorofluoromethane, also known as freon-11 (CFC-11).
Smog formation potential measures the amount of harmful, visible ozone that
can be created throughout a manufacturing and transportation process. Ozone
(O3) is used as standard units, which can be very harmful to the human body if
not in minimal exposure.
2.4. Life-cycle Interpretation
During the last phase of the LCA, results are presented and sensitivity analyses
are run. The results often highlight environmental “hot spots,” which are
materials or processes in the life-cycle of a product that contribute more to its
6environmental impact. Sensitivity analyses explain changes in data or in LCA
execution caused by a fundamental difference of materials or circumstances.
Results
Oftentimes, data are presented in LCA reports with many decimal places,
implying that all digits are significant, which is typically not the case. In fact,
most data values can be truncated to two significant figures without any loss
of accuracy. Although LCA is a good tool, and arguably the best tool we
have, it is not perfect. LCA practitioners understand that there is inherent
variability within the data.
When comparing results of different LCAs, the differences in some of the
environmental impact categories might be quite small. But a small change in
a small number may result in a large percentage shift. Therefore, if results
are presented as a percentage, it’s important to look at the absolute
differences in values, and beware of the coefficient of variation within the
data. The percent difference in values among data sets may be smaller than
the coefficient of variation among the data, thus the difference is
insignificant.
In Table 1, the full life-cycle results are presented for all stormwater pipe
systems for the leave-in-place scenario at the end-of-life. Tables 2 and 3
present relative, full life-cycle results for all stormwater pipe systems for the
leave-in-place scenario at the end-of-life when compared to the HDPE and
HDPE with 50% recycled content pipe system, respectively. Green
highlights indicate areas of significant, positive difference, while gray
indicates insignificant variance and red indicates significant, negative
difference. Significance levels of 10% for energy results and 25% for total
solid waste and impact assessment results were used for this study. These
values were chosen due to the inherent uncertainty in the data itself, as well
as uncertainty imposed in the study due to assumptions made.
Data are presented for the calculated environmental impact categories as
well as for selected, measured LCI data categories. The environmental
impact categories are global warming potential, acidification potential,
eutrophication potential, ozone depletion potential, and smog formation
potential. LCI data is presented for total energy demand, total solid waste,
and amount of water consumption.
The results show that the HDPE pipe systems performed as well or better
than the other stormwater pipe systems in almost all categories. For LCI or
environmental impact categories where other stormwater pipe systems
perform better than HDPE, additional explanation is provided in the
following sections.
7Table 1: Results for 24-in.-diameter Stormwater Pipe for Leave in Place at End-of-Life
Evaluated with Cut-off Method (results per 1000 feet of pipe for 100 years of service)
Impact category Unit HDPE HDPE with PVC RCP Steel
50% RC
Total Energy Demand MJ eq. 6.71E+05 4.94E+05 7.59E+05 5.91E+05 6.54E+05
Solid Waste by Weight kg eq. 7.19E+02 6.37E+02 1.36E+03 3.85E+03 2.65E+03
Water Consumption L 8.39E+04 7.86E+04 1.25E+05 1.91E+05 1.42E+05
Global Warming Potential kg CO2 eq. 2.85E+04 2.49E+04 3.91E+04 5.23E+04 5.17E+04
Acidification Potential kg SO2 eq. 1.19E+02 1.12E+02 1.61E+02 2.17E+02 1.81E+02
Eutrophication Potential kg N eq. 5.36E+00 5.25E+00 8.00E+00 8.00E+00 7.94E+00
Ozone Depletion Potential kg CFC-11 eq. 1.40E-04 1.29E-04 1.07E-03 2.25E-04 -2.34E-05
Smog Formation Potential kg O3 eq. 2.96E+03 2.89E+03 3.42E+03 4.05E+03 3.91E+03
Table 2: Comparative Results with HDPE baseline for 24-in.-diameter Stormwater Pipe for
Leave in Place at End-of-Life (results per 1000 feet of pipe for 100 years of service)
Impact category HDPE HDPE with PVC RCP Steel
50% RC
Total Energy Demand -30% 12% -13% -2%
Solid Waste by Weight -12% 62% 137% 115%
Water Consumption -7% 40% 78% 52%
Global Warming Potential -13% 32% 59% 58%
Acidification Potential -6% 30% 58% 41%
Eutrophication Potential -2% 39% 40% 39%
Ozone Depletion Potential -8% 154% 47% -280%
Smog Formation Potential -2% 14% 31% 28%
Table 3: Comparative Results with HDPE with 50% recycled content baseline for 24-in.-
diameter Stormwater Pipe for Leave in Place at End-of-Life (results per 1000 feet of pipe for 100
years of service)
Impact category HDPE HDPE with PVC RCP Steel
50% RC
Total Energy Demand 30% 42% 18% 28%
Solid Waste by Weight 12% 72% 143% 122%
Water Consumption 7% 46% 84% 58%
Global Warming Potential 13% 45% 71% 70%
Acidification Potential 6% 36% 64% 47%
Eutrophication Potential 2% 42% 42% 41%
Ozone Depletion Potential 8% 157% 55% -289%
Smog Formation Potential 2% 17% 33% 30%
82.4.1.1. Global Warming Potential
In the United States, because energy is primarily generated from fossil
fuel sources, and global warming potential is primarily associated with
carbon dioxide emissions, there is a strong correlation between global
warming potential results and non-renewable energy demand. In this
study, there is a significant difference in this correlation for the HDPE
pipe. This is because the non-renewable energy results for plastic pipe
also include the energy content of fossil fuel resources that are used
as material feedstocks and not combusted.
The total global warming potential for PVC, reinforced concrete, and
corrugated steel pipe systems are greater than that of the HDPE pipe
in all end-of-life scenarios. The use of recycled resin reduces results
for the 50% recycled content HDPE pipe compared to virgin HDPE
pipe, but the differences between the HDPE pipe systems are too
small to be considered meaningful.
Figure 1: Comparison of relative global warming potential (GWP) for all pipe systems studied
normalized to the pipe system with the greatest GWP. For this environmental impact category,
the pipe system with the greatest GWP is the reinforced concrete pipe system.
92.4.1.2. Acidification Potential
Like with global warming potential, acidification potential is also closely
correlated to non-renewable energy demand. So also like with global
warming potential, acidification potential for PVC, reinforced concrete,
and corrugated steel pipe systems are greater than that of the HDPE
pipe in all end-of-life scenarios.
Figure 2: Comparison of relative acidification potential (AP) for all pipe systems studied
normalized to the pipe system with the greatest AP. For this environmental impact category, the
pipe system with the greatest AP is the reinforced concrete pipe system.
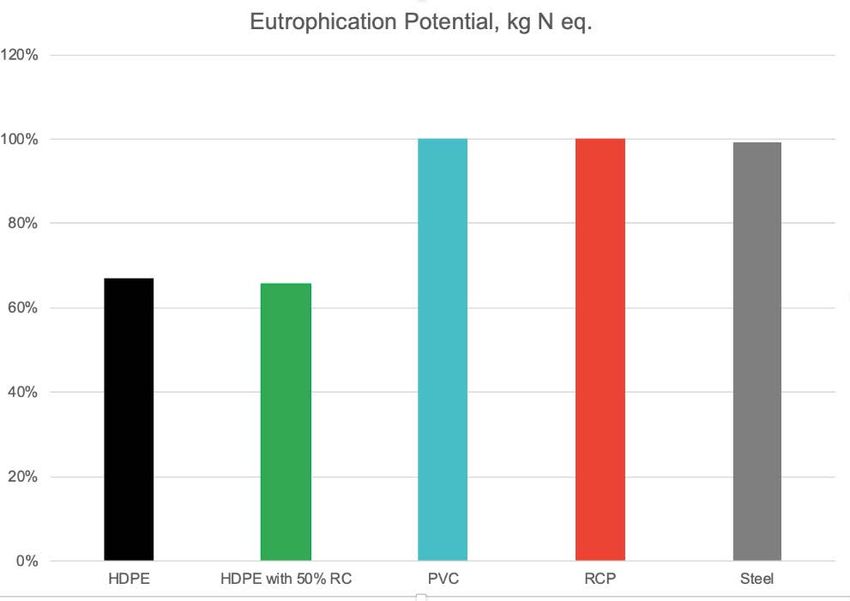
102.4.1.3. Eutrophication Potential
For all end-of-life scenarios, the eutrophication potential of HDPE pipe
is less than that for PVC, reinforced concrete, and corrugated steel
pipe systems. Eutrophication potential is closely tied to pipe
production, installation, and cleaning during the 100 year life, and
HDPE pipe systems have much lower eutrophication impacts than the
other pipe types for all end-of-life scenarios.
Figure 3: Comparison of relative eutrophication potential (EP) for all pipe systems studied
normalized to the pipe system with the greatest EP. For this environmental impact category, the
pipe systems with the greatest EP are the PVC and reinforced concrete pipe systems.
112.4.1.4. Ozone Depletion Potential
Steel pipe performed better in the ozone depletion environmental
impact category when compared to both systems with HDPE pipe. For
HDPE and steel pipe systems, the largest source of pollutants that
contribute to ozone depletion potential come from fuel use during
installation. For PVC and reinforced concrete pipe systems, pipe
production is the greatest contributor to ozone depletion potential.
The primary reason for the better performance of the steel pipe system
in this category is due to the background Worldsteel data set used for
modeling. In this dataset, there are negative amounts of emissions that
contribute to ozone depletion potential. This is due to credits given for
avoided production of fuels and chemicals during the production of
steel co-products. Thus, the corrugated steel pipe system has lower
ozone depletion results compared to all other pipe systems due to the
credit given during the pipe-production stage.
Figure 4: Comparison of relative ozone depletion potential (ODP) for all pipe systems studied
normalized to the pipe system with the greatest ODP. For this environmental impact category,
the pipe system with the greatest ODP is the PVC pipe system.
122.4.1.5. Smog Formation Potential
Smog formation potential is closely related to the amount of emissions
from combustion of diesel fuels, for excavation equipment, trucks, and
pipe cleaning equipment, as well as combustion of coal used for
process energy and electricity generation. For all end-of-life scenarios,
total smog formation potential for HDPE pipe systems are lesser than
those for corrugated steel and reinforced concrete pipe systems.
Differences in smog formation potential results for HDPE and PVC
pipe systems are inconclusive.
Figure 5: Comparison of relative smog formation potential (SFP) for all pipe systems studied
normalized to the pipe system with the greatest SFP. For this environmental impact category,
the pipe system with the greatest SFP is the reinforced concrete pipe system.
2.4.1.6. Total Energy Demand
The reinforced concrete pipe performed better than the virgin HDPE
pipe system in the total energy demand category. As shown in the
following table, pipe production creates the greatest total energy
demand for the product system during the life cycle, while pipe
installation is the source of the second greatest energy demand.
During the pipe production phase, reinforced concrete pipe requires a
lower amount of production energy compared to other systems. This
may seem counterintuitive because it is common knowledge that
cement is an energy-intensive material to make, but in practice only a
small amount of cement by mass is included in concrete. When the
energy consumption required in the production of cement is allocated
to the percent mass of cement contained in the concrete, while more
than 80% of the mass of concrete is made of materials with very little
13production energy (sand, gravel, and aggregate), the energy demand
per pound of reinforced concrete pipe is much less than that of other
pipe systems. So even though the reinforced concrete pipes are much
heavier than the other systems, the total energy demand per 1000 ft of
pipe is less than other systems.
Reinforced concrete pipe systems also have installation energy
demands that are less than those of virgin HDPE pipe. This is because
more native soil can be used as backfill, which results in less energy
demand due to bringing in less select fill material and hauling away
less native soil. HDPE pipe made with recycled resins show lower
energy demands than with virgin HDPE as a result of using less
energy reclaiming, reprocessing, and reusing recycled HDPE resins for
50% of the content rather than producing 100% HDPE from virgin
materials.
Figure 6: Comparison of relative total energy demand for all pipe systems studied normalized to
the pipe system with the greatest total energy demand. For this environmental impact category,
the pipe system with the greatest total energy demand is the PVC pipe system.
142.4.1.7. Solid Waste
Solid waste results are strongly influenced by the end-of-life
management scenario for the pipe system. The reinforced concrete
pipe system generated the greatest amount of solid waste for all end-
of-life scenarios evaluated, and the HDPE pipe systems have the least
total solid waste for all end-of-life scenarios. Solid waste differences
between the virgin and 50% recycled content HDPE pipe systems are
not large enough to be considered meaningful.
Figure 7: Comparison of relative solid waste for all pipe systems studied normalized to the pipe
system that generates the greatest amount of solid waste. For this environmental impact
category, the pipe system with the greatest solid waste is the reinforced concrete pipe system.
152.4.1.8. Water Consumption
Water consumption for all pipe systems is associated with the
generation of electricity used for process energy, as well as extraction
and processing of other process and transportation fuel. The HDPE
pipe systems consume less water than all other pipe systems for all
end-of-life scenarios. Differences between water consumption of virgin
and recycled content HDPE pipe are not large enough to be
considered meaningful.
Figure 8: Comparison of relative water consumption for all pipe systems studied normalized to
the pipe system with the greatest water consumption. For this environmental impact category,
the pipe system with the greatest water consumption is the reinforced concrete pipe system.
Sensitivity Analyses
Sensitivity analyses are used to verify that assumptions made during the
LCA do not significantly change the results. For this study, sensitivity
analyses were run for three assumptions: those related to pipe weights,
steel reinforcement content in the reinforced concrete pipe, and average
transportation distances for reinforced concrete pipe.
2.4.2.1. Pipe Weights
A sensitivity analysis is included on pipe weight because there can be
weight variations for pipe produced by different manufacturers. For the
HDPE pipe, results were run for the highest and lowest pipe weights
reported by producers. For other types of pipe, results were run at
weights 10% higher than the baseline weight and 10% lower than the
baseline weight. Results comparing low weight HDPE pipe with high
weight alternative pipe (best case scenario for HDPE) and comparing
high weight HDPE pipe with low weight alternative pipe (worst case
16scenario for HDPE) were run for all three end-of-life fates for both
recycling methodologies.
Overall, the pipe weight sensitivities do not show notable changes in
the comparative conclusions for baseline weight pipes. Comparing low
weight HDPE pipe with high weight alternative pipes shifts some
comparative conclusions from inconclusive to lower for HDPE pipes,
and comparing high weight HDPE pipe with low weight alternative
pipes generally shifts some comparative results into the inconclusive
range rather than showing significant benefits for alternative pipes
compared to HDPE pipe. Supporting data tables are presented in the
full report.
2.4.2.2. Reinforcing Steel Content of Reinforced Concrete Pipe
The reinforcing steel content of reinforced concrete pipe was modeled
based on industry data per metric tonne of pipe from a 2017 study for
the Canadian Concrete Pipe & Precast Association (CCPPA). From
this report, a 5.2% weighted average of reinforcing steel was
calculated for 24-in. diameter reinforced concrete pipe. A 2010 fact
sheet from The Wire Reinforcement Institute indicated that steel
content values varied between 1.1% and 2.8% of the weight of the
reinforced concrete pipe.
If the reinforced concrete pipe is modeled with the lower steel content,
only a few comparative conclusions for HDPE and reinforced concrete
pipe are affected. For pipe that is left in place, some energy
comparisons between 50% recycled content HDPE and reinforced
concrete pipe shift from higher for reinforced concrete pipe to
inconclusive differences. Some eutrophication and smog comparisons
between reinforced concrete pipe and HDPE pipe also shift from
higher for reinforced concrete pipe to inconclusive differences. All other
comparisons of results are higher for reinforced concrete pipe
compared to virgin and recycled HDPE pipe. Results tables for the
reinforced concrete pipe steel weight sensitivity analysis are presented
in the full report.
2.4.2.3. Transport Distance for Reinforced Concrete Pipe to Installation Site
A distance of 100 miles from manufacturer to installation site was
modeled for all pipe types except reinforced concrete pipe. Due to its
heavy weight, RCP is generally sourced from local plants, so the
transport distance for reinforced concrete pipe was modeled as 50
miles in the baseline results. A sensitivity analysis on a transport
distance of 100 miles for reinforced concrete pipe showed no changes
in comparative conclusions for HDPE and reinforced concrete pipe
systems.
17You can also read