Recalibration and validation of the charlson comorbidity index in an Asian population: the national Health insurance Service national Sample ...
←
→
Page content transcription
If your browser does not render page correctly, please read the page content below
www.nature.com/scientificreports

            OPEN            Recalibration and validation
                            of the Charlson Comorbidity
                            Index in an Asian population:
                            the National Health Insurance
                            Service‑National Sample Cohort
                            study
                            Jae Shin Choi1,3,10, Myoung‑Hee Kim2,10, Yong Chul Kim 3, Youn‑Hee Lim                   4
                                                                                                                         , Hyun Joo Bae5,
                            Dong Ki Kim 3,9, Jae Yoon Park6, Junhyug Noh 7 & Jung Pyo Lee 8,9*

                            Weights assigned to comorbidities in predicting mortality may vary based on the type of index disease
                            and advances in the management of comorbidities. We aimed to develop a modified version of the
                            Charlson Comorbidity Index (CCI) using an Asian nationwide database (mCCI-A), enabling the precise
                            prediction of mortality rates in this population. The main data source used in this study was the
                            National Health Insurance Service-National Sample Cohort (NHIS-NSC) obtained from the National
                            Health Insurance database, which includes health insurance claims filed between January 1, 2002,
                            and December 31, 2013, in Korea. Of the 1,025,340 individuals included in the NHIS-NSC, 570,716
                            patients who were hospitalized at least once were analyzed in this study. In total, 399,502 patients,
                            accounting for 70% of the cohort, were assigned to the development cohort, and the remaining
                            patients (n = 171,214) were assigned to the validation cohort. The mCCI-A scores were calculated
                            by summing the weights assigned to individual comorbidities according to their relative prognostic
                            significance determined by a multivariate Cox proportional hazard model. The modified index was
                            validated in the same cohort. The Cox proportional hazard model provided reassigned severity weights
                            for 17 comorbidities that significantly predicted mortality. Both the CCI and mCCI-A were correlated
                            with mortality. However, compared with the CCI, the mCCI-A showed modest but significant increases
                            in the c statistics. According to the analyses using continuous net reclassification improvement, the
                            mCCI-A improved the net mortality risk reclassification by 44.0% (95% confidence intervals (CI), 41.6–
                            46.5; p < 0.001). The mCCI-A facilitates better risk stratification of mortality rates in Korean inpatients
                            than the CCI, suggesting that the mCCI-A may be a preferable index for use in clinical practice and
                            statistical analyses in epidemiological studies.

                            1
                             Department of Internal Medicine, Pyeongtaek St. Mary’s Hospital, Pyeongtaek‑si, Gyeonggi‑do, Republic of
                            Korea. 2Department of Dental Hygiene, College of Health Science, Eulji University, Seongnam‑si, Gyeonggi‑do,
                            Republic of Korea. 3Department of Internal Medicine, Seoul National University Hospital, Seoul, Republic of
                            Korea. 4Institute of Environmental Medicine, Seoul National University Medical Research Center, Seoul, Republic
                            of Korea. 5Future Environmental Strategy Research Group, Korea Environment Institute, Sejong‑si, Republic of
                            Korea. 6Department of Internal Medicine, Dongguk University Ilsan Hospital, Goyang‑si, Gyeonggi‑do, Republic
                            of Korea. 7Computer Science and Engineering, College of Engineering, Seoul National University, Seoul, Republic
                            of Korea. 8Department of Internal Medicine, Seoul National University Boramae Medical Center, Seoul, Republic
                            of Korea. 9Department of Internal Medicine, Seoul National University College of Medicine, Seoul, Republic of
                            Korea. 10These authors contributed equally: Jae Shin Choi and Myoung-Hee Kim. *email: nephrolee@gmail.com

Scientific Reports |   (2020) 10:13715               | https://doi.org/10.1038/s41598-020-70624-8                                           1

                                                                                                                                     Vol.:(0123456789)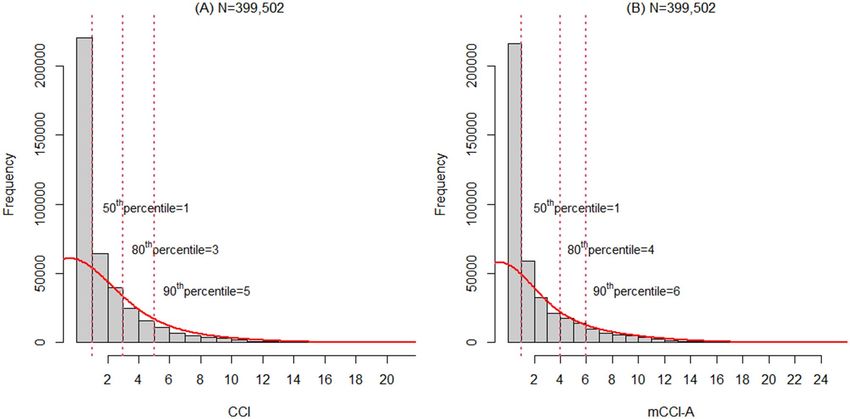
www.nature.com/scientificreports/
Entire cohort Development cohort Validation cohort
Variables (N = 570,716) (N = 399,502) (N = 171,214)
Age (N (%))
< 60 years 421,229 (73.81) 294,740 (73.78) 126,489 (73.88)
60–79 years 119,149 (20.88) 83,505 (20.9) 35,644 (20.82)
≥ 80 years 30,338 (5.32) 21,257 (5.32) 9,081 (5.3)
Male (N (%)) 264,092 (46.27) 184,891 (46.28) 79,201 (46.26)
No. of deaths (N (%)) 21,868 (3.83) 15,308 (3.83) 6,560 (3.83)
Regional size by population
Metropolitan areas 250,785 (43.94) 175,852 (44.02) 74,933 (43.77)
City or rural areas 319,931 (56.06) 223,650 (55.98) 96,281 (56.23)
Family income ratioa
0 (Medical aid) 19,778 (3.47) 13,854 (3.47) 5,924 (3.46)
1 40,195 (7.04) 28,283 (7.08) 11,912 (6.96)
2 38,107 (6.68) 26,850 (6.72) 11,257 (6.57)
3 37,959 (6.65) 26,493 (6.63) 11,466 (6.70)
4 41,679 (7.30) 29,233 (7.32) 12,446 (7.27)
5 46,622 (8.17) 32,499 (8.13) 14,123 (8.25)
6 53,477 (9.37) 37,500 (9.39) 15,977 (9.33)
7 60,295 (10.56) 42,032 (10.52) 18,263 (10.67)
8 70,504 (12.35) 49,440 (12.38) 21,064 (12.30)
9 79,311 (13.90) 55,522 (13.90) 23,789 (13.89)
10 82,789 (14.51) 57,796 (14.47) 24,993 (14.60)
Table 1. Baseline characteristics of the development and validation cohort. a Family income ratio was divided
into the following 11 groups: medical aid with group 0 and the income decile with 10 equal -sized groups
according to the rank of the gross household income and registered National Health Insurance (based on
2010).
Comorbidity is among the most important predictors of inpatient outcomes1. Among the various methods
used to predict mortality by weighting comorbidities, the Charlson Comorbidity Index (CCI) has been widely
utilized by health researchers to measure the burden of diseases. In 1984, Charlson et al. identified the clinical
conditions to be included in the index by reviewing 559 hospital charts of patients admitted to medical services
at a single hospital and then assessed the associations of these comorbidities with the 1-year all-cause m ortality2.
The ability of this index to predict mortality has been validated in various disease subgroups, including
cancer3, renal disease4, stroke5 and intensive care6. Nevertheless, there are several reasons to recalibrate and
subsequently validate this index with inpatients to obtain better predictions of their mortality rates. First, because
the management of inpatients and their comorbidities has advanced significantly over the past 30 years, the
contribution of comorbidities to the mortality rate has likely also changed. Second, this index is not suitable for
predicting long-term outcomes in general hospitalized patients because in the development of the CCI, only a
small sample and the one-year mortality rate were considered. Therefore, this index should be recalibrated and
revalidated using more recent data.
The recalibration and validation of comorbidities indices have been performed in various disease group
such as the index of coexistent d isease7, Davies i ndex8, Khan i ndex9, a modified version of the CCI in incident
hemodialysis patients (mCCI-IHD)10 and a modified version of the CCI in incident peritoneal dialysis patients
(mCCI-PD)11. However, indices created from these specific disease groups may not be optimal to use as a tool
to predict the outcomes of generalized patients.
Therefore, the present study aimed to develop a modified version of the Charlson Comorbidity Index (mCCI-
A) using an Asian nationwide database that reflected the recent changes of mortality due to the development
of medical technology and the difference in prevalence of diseases from racial differences and to compare its
performance with the original CCI.
Results
Baseline characteristics of the entire cohort. The baseline characteristics of the entire cohort, devel-
opment cohort and validation cohort are listed in Table 1 of the 570,716 participants, 46.3% of the patients were
men. The overall mortality rate was 3.83%.
In total, 74.43% of the subjects had one or more comorbidities. Among the 17 comorbidities, the most
prevalent comorbidity was chronic pulmonary disease (47.56%), followed by ulcer disease (37.1%) and mild
liver disease (24.05%) (Table 2).
Development of the New Comorbidity Index (mCCI‑A) for the prediction of mortality. Fig-
ure 1 shows the adjusted hazard ratios (HRs) and weights of each comorbidity. All comorbidities were signifi-
Scientific Reports | (2020) 10:13715 | https://doi.org/10.1038/s41598-020-70624-8 2
Vol:.(1234567890)www.nature.com/scientificreports/
Entire cohort Development cohort (70%) Validation cohort (30%)
Comorbidity (N = 570,716) (N = 399,502) (N = 171,214)
No comorbidity 145,929 (25.57) 102,046 (25.54) 43,883 (25.63)
Ulcer disease 211,737 (37.1) 148,101 (37.07) 63,636 (37.17)
Peripheral vascular disease 50,688 (8.88) 35,642 (8.92) 15,046 (8.79)
Mild liver disease 137,253 (24.05) 95,987 (24.03) 41,266 (24.1)
Myocardial infarct 10,170 (1.78) 7,129 (1.78) 3,041 (1.78)
Connective tissue disease 41,225 (7.22) 28,817 (7.21) 12,408 (7.25)
Congestive heart failure 27,970 (4.9) 19,582 (4.9) 8,388 (4.9)
Chronic pulmonary disease 271,438 (47.56) 190,206 (47.61) 81,232 (47.44)
Diabetes mellitus 69,665 (12.21) 48,668 (12.18) 20,997 (12.26)
Diabetes mellitus with end organ damage 35,200 (6.17) 24,644 (6.17) 10,556 (6.17)
Hemiplegia 10,154 (1.78) 7,132 (1.79) 3,022 (1.77)
Cerebrovascular disease 63,988 (11.21) 44,836 (11.22) 19,152 (11.19)
Dementia 16,524 (2.9) 11,580 (2.9) 4,944 (2.89)
Moderate or severe renal disease 7,494 (1.31) 5,274 (1.32) 2,220 (1.3)
Any tumor, leukemia, lymphoma 39,575 (6.93) 27,730 (6.94) 11,845 (6.92)
Moderate or severe liver disease 5,334 (0.93) 3,697 (0.93) 1,637 (0.96)
Metastatic solid tumor 12,410 (2.17) 8,664 (2.17) 3,746 (2.19)
AIDS 162 (0.03) 104 (0.03) 58 (0.03)
One or more comorbidity 424,787 (74.43) 297,456 (74.46) 127,331 (74.37)
Table 2. Prevalence of 17 comorbidities in the development and validation cohorts.
Figure 1. Adjusted hazard ratio and weights of 17 comorbidities in the development cohort. MST, Metastatic
solid tumor; AIDS, Acquired immunodeficiency syndrome; MSLD, Moderate or severe liver disease; MSRD,
Moderate or severe renal disease; DEME, Dementia; HEMI, Hemiplegia, CHF, Congestive heart failure, MI,
Myocardial infarction; CVD, Cerebrovascular disease; DMW, Diabetes mellitus with end organ damage; DM,
Diabetes mellitus; CPD, Chronic pulmonary disease; MLD, Mild liver disease; CTD, Connective tissue disease;
UD, Ulcer disease; PVD, Peripheral vascular disease. Adjusted for age (quartile), sex, region, family income ratio
(11 groups), and all comorbidities.
Scientific Reports | (2020) 10:13715 | https://doi.org/10.1038/s41598-020-70624-8 3
Vol.:(0123456789)www.nature.com/scientificreports/
Development cohort (N = 399,502)
HR (95% CI)a P value Relative weight Weight
Comorbidity
Peripheral vascular disease 0.79 (0.757–0.826) < 0.001 1 1
Ulcer disease 0.80 (0.769–0.823) < 0.001 1.013 1
Mild liver disease 0.88 (0.852–0.917) < 0.001 1.114 1
Connective tissue disease 0.89 (0.850–0.941) < 0.001 1.127 1
Diabetes 0.94 (0.896–0.976) 0.002 1.19 1
Chronic pulmonary disease 0.95 (0.921–0.985) 0.002 1.203 1
Myocardial infarct 1.26 (1.183–1.346) < 0.001 1.595 2
Diabetes with end organ damage 1.31 (1.247–1.376) < 0.001 1.658 2
Cerebrovascular disease 1.35 (1.297–1.399) < 0.001 1.709 2
Congestive heart failure 1.54 (1.477–1.606) < 0.001 1.949 2
Hemiplegia 1.57 (1.479–1.664) < 0.001 1.987 2
Dementia 1.81 (1.727–1.887) < 0.001 2.291 2
Moderate or severe renal disease 1.86 (1.740–1.986) < 0.001 2.354 2
Any tumor, leukemia, lymphoma 2.88 (2.762–2.999) < 0.001 3.646 4
Moderate or severe liver disease 2.94 (2.705–3.186) < 0.001 3.722 4
AIDS 3.64 (2.110–6.269) < 0.001 4.608 5
Metastatic solid tumor 4.29 (4.095–4.502) < 0.001 5.43 5
Table 3. Weights for comorbidities in the development cohort. a Adjusted for age (10 groups), sex, region,
family income ratio, and all comorbidities.
cantly associated with mortality. Metastatic solid tumors were assigned the highest weight, followed by AIDS,
moderate or severe liver disease, and any tumor, consecutively (Table 3).
Compared with the weights in the CCI, in the mCCI-A, the updated weights for cerebrovascular disease,
myocardial infarction (MI), congestive heart failure (CHF), dementia, any tumor and moderate or severe liver
disease increased; the updated weights for acquired immunodeficiency syndrome (AIDS) and metastatic solid
tumors decreased; and the updated weights for diabetes without complication, diabetes with end organ damage,
hemiplegia, and moderate or severe renal disease did not change (Fig. 1).
The mCCI-A scores were calculated by summing the updated weights. The scores were applied to each
patient in the development cohort. Based on the CCI and mCCI-A scores, we categorized both scores into the
following 4 risk groups: ≤ 50th percentile, 50th–80th percentile, 80th–90th percentile and > 90th percentile. To
determine the cut-off values of the comorbidity scores in each risk group, we generated a histogram to represent
the distributions of the scores (Fig. 2). The cut-off values of CCI scores corresponding to the 50th, 80th and
90th percentiles were 1, 3 and 5, respectively, whereas those of the mCCI-A scores were 1, 4 and 6, respectively.
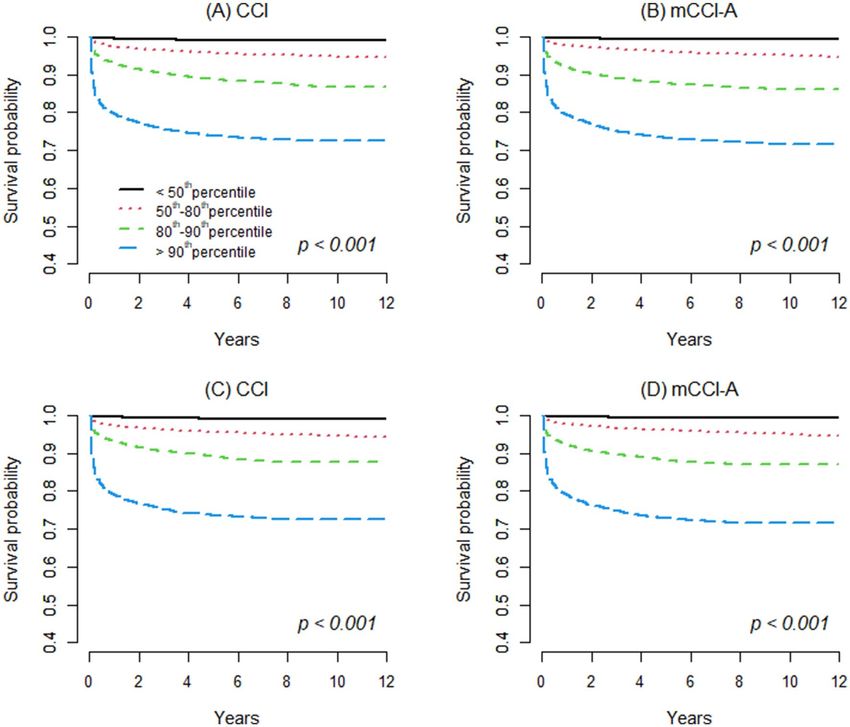
Figure 3 shows the survival curves obtained using the Kaplan–Meier method in the development cohort,
which were differentiated by the 4 risk groups of the CCI and mCCI-A. The risk groups in each index could
discriminate the survival rates, indicating that increasing comorbidity index scores were associated with lower
cumulative survival.
Application and validation of the mCCI‑A. The baseline characteristics of the validation cohort
(n = 171,214) are listed in Table 1. Males represented 46.26% of the subjects. The overall mortality was 3.83%. In
total, 74.37% of the subjects had one or more comorbidities. Among the 17 comorbidities, the most prevalent
comorbidity was chronic pulmonary disease (47.44%), followed by ulcer disease (37.17%) and mild liver disease
(24.1%) (Table 2).
To assess the discrimination ability of each index, the c statistic and cNRI were calculated after adjusting for
confounders in the following two analyses: univariate and multivariate. Significant differences were observed
in the c statistics between the CCI and the mCCI-A in the univariate and multivariate analyses (Table 4). Addi-
tionally, a significant risk reclassification improvement was observed in the mCCI-A in the univariate and mul-
tivariate analyses using cNRI. In the multivariate analysis, compared with the CCI, the mCCI-A significantly
improved the net mortality risk reclassification by 44.0% (95% CI 41.6–46.5; p < 0.001), indicating that the
mCCI-A facilitates a better risk stratification of mortality in Korean inpatients than the CCI. Figure 3 shows the
survival curves obtained using the Kaplan–Meier method in the validation cohort, which were differentiated by
the 4 risk groups of the CCI and mCCI-A.
Application and validation of the mCCI‑A to specific diseases. To assess the discrimination ability
of each index, the c statistic and cNRI were calculated after adjusting for confounders in multivariate analysis in
subgroups such as mild liver disease, chronic pulmonary disease, diabetes mellitus and moderate/severe renal
disease patients composed of the total cohort. Significant differences were observed in the c statistics and cNRI
between the CCI and the mCCI-A in multivariate analyses (Table 5).
Scientific Reports | (2020) 10:13715 | https://doi.org/10.1038/s41598-020-70624-8 4
Vol:.(1234567890)www.nature.com/scientificreports/
Figure 2. Distribution of the CCI and mCCI-A scores in the development cohort. (A) Distribution of the
CCI scores (n = 399,502); (B) Distribution of the mCCI-A scores (n = 399,502). The y-axis shows the number
of subjects. The solid line represents a density curve calculated by approximation to identify the overall pattern
and deviation. The vertical dotted lines (red) represent the 50th, 80th, and 90th percentile values. CCI, Charlson
Comorbidity Index; mCCI-A, modified version of the Charlson Comorbidity index for Asian populations.
Discussion
In this study, we modified the CCI using a nationwide population-based database and to developed a comorbid-
ity index that provides better risk predictions in the general inpatient population. To the best of our knowledge,
this study is the largest study to modify the CCI using a nationwide population-based database and develop a
comorbidity index that provides better risk prediction in a general inpatient Asian population.
Since 1987, the CCI has been used as a comorbidity index throughout the medical community, and there
have been efforts to predict the outcome of the general inpatient population using the CCI since the 1980s to
2000s. In 1996, the CCI was applied to 33,940 inpatients with ischemic heart d isease12. In 1992, another study
involving 27,111 patients who underwent lumbar spine surgery was conducted13. In both of the above mentioned
studies, the diagnostic information used was based on International Classification of Disease, 9th revision codes
(ICD-9). Using ICD codes may be useful in exploratory data a nalyses14. In the 2000s, a retrospective cohort
study was conducted using National Health Insurance claims data (2001–2002) to compare the performance of
three comorbidity measurements (Elixhauser, Charlson/Deyo, and Charlson/Romano method) among inpatients
hospitalized for Chronic Obstructive Pulmonary Disease and Acute Myocardial Infarction in T aiwan15. However,
these studies had two limitations. First, these studies investigated specific disease groups rather than general
patients. Second, the purpose of these studies was to demonstrate superiority among the existing methods or to
apply the methods to the general population.
Previous studies have directly applied the CCI to patients using a weight equal to that in the original index for
each CCI index. However, the recalibration and validation of the weights of the CCI index diseases are needed for
several reasons. First, the original CCI does not reflect the significant progress achieved in the treatment of each
comorbidity and medical advancements over the previous 30 years. Second, the extent to which the original CCI
reflects long-term outcomes considered important is unclear because the “training” population used to develop
the original CCI was created based on the one-year mortality rate in general inpatients. Third, the original CCI
was developed based on a relatively small number of patients.
In 1996, a study was conducted to update the CCI and scores using USA administrative databases of 6,326
patients who underwent bypass surgery, and the new index exhibited superior performance over the original
CCI (c = 0.74 vs. 0.70)16. A new comorbidity index was developed by assigning specific weights to the original
CCI in this study. However, AIDS was excluded because no patients with AIDS were included in the sample. In
2011, a study updated the CCI and scores using Canadian administrative databases of 55,929 patients admitted
to a medical facility in the Calgary region (Alberta, Canada) (population 1.3 million)17. The authors excluded
the 5 comorbidities found to have no statistical correlation with the mortality rates among the 17 comorbidities.
The new index exhibited superior performance over the original CCI (c = 0.825 vs. 0.808). Although these two
studies reflect the recent advances in medical management, there are limitations in that study. The evaluation
of several comorbidities was limited (particularly AIDS), and there is still a need for further evidence regarding
whether the index can be directly applied to Asians.
In Asia, the CCI has also been applied to various disease groups to evaluate the various outcomes of patients.
However, the usefulness of the original CCI remains controversial. A Japanese study revealed that the CCI had
Scientific Reports | (2020) 10:13715 | https://doi.org/10.1038/s41598-020-70624-8 5
Vol.:(0123456789)www.nature.com/scientificreports/
Figure 3. Survival curves obtained using the Kaplan–Meier method in the development and validation cohorts
differentiated by 4 risk groups for CCI and mCCI-A. (A) Survival curves in the development cohort for CCI,
(B) Survival curves in the development cohort for mCCI-A, (C) Survival curves in the validation cohort for
CCI, (D) Survival curves in the validation cohort for mCCI-A. CCI in development cohort, < 50th percentile
(n = 220,258, scores 0–1); 50th–80th percentile (n = 103,849, scores 2–3); 80th–90th percentile (n = 40,558,
scores 4–5) and > 90th percentile (n = 34,837, score ≥ 6). mCCI-A in the development cohort, < 50th percentile
(n = 215,768, scores 0–1); 50th–80th percentile (n = 113,413, scores 2–4); 80th–90th percentile (n = 31,535, scores
5–6) and > 90th percentile (n = 38,786, score ≥ 7). CCI in the validation cohort, < 50th percentile (n = 94,378,
scores 0–1); 50th–80th percentile (n = 44,517, scores 2–3); 80th–90th percentile (n = 17,467, scores 4–5)
and > 90th percentile (n = 14,852, score ≥ 6). mCCI-A in the validation cohort, < 50th percentile (n = 92,507,
scores 0–1); 50th–80th percentile (n = 48,490, scores 2–4); 80th–90th percentile (n = 13,626, scores 5–6)
and > 90th percentile (n = 16,591, score ≥ 7). CCI, Charlson Comorbidity Index; mCCI-A, modified version of
the Charlson Comorbidity Index for Asian populations.
been used to predict the overall survival of patients with solid tumors; however, the CCI is not considered a
significant predictor18. The authors emphasized the necessity for developing scales that can more accurately
predict patient outcomes.
Previously, we updated the CCI and scores in hemodialysis and peritoneal dialysis patients using the National
Health Insurance dataset in Korea10,11. The first study involved 24,738 people who first started hemodialysis
between 2005 and 2 00810. We developed the mCCI-IHD, which included 14 comorbidities with reassigned sever-
ity weights. In the validation cohort, compared with the CCI, the mCCI-IHD showed modest but significant
increases in the c statistics at 6 months and 1 year. Compared with the CCI, the analyses using cNRI revealed
that the mCCI-IHD improved the net mortality risk reclassification by 24.6%, 26.2% and 42.8% at 6 months
and 1 and 2 years, respectively. The second study involved 7,606 people who first started peritoneal dialysis
between 2005 and 200811. We developed the mCCI-IPD, which included 11 comorbidities with reassigned
severity weights. In the validation cohort, compared with the CCI, although the mCCI-IHD showed no differ-
ences in the c statistics, the analyses using cNRI revealed that the mCCI-IHD provided a 38.2% improvement
in mortality risk assessment.
Based on the results of the previous two studies, we extended this study to the entire inpatient population. In
this study, we modified the CCI using administrative data that included nearly all Korean inpatients who were
Scientific Reports | (2020) 10:13715 | https://doi.org/10.1038/s41598-020-70624-8 6
Vol:.(1234567890)www.nature.com/scientificreports/
c statistic cNRIEvent cNRINon-event cNRITotal
(95% CI) p-valuea (%, 95% CI) p- value (%, 95% CI) p-value (%, 95% CI) p-value
Validation cohort (n = 171,214)
Model 1
0.831
CCI
(0.826–0.836)
0.855 16.6 71.1 87.7
mCCI-A < 0.001 < 0.001 < 0.001 < 0.001
(0.850–0.860) (14.2–18.9) (70.8–71.5) (85.3–90.1)
Model 2
0.890
CCI
(0.887–0.893)
0.898 9.9 34.2 44.0
mCCI-A < 0.001 < 0.001 < 0.001 < 0.001
(0.895–0.901) (7.4–12.3) (33.7–34.6) (41.6–46.5)
Development cohort (n = 399,502)
Model 1
0.827
CCI
(0.824–0.830)
0.851 15.0 70.9 85.9
mCCI-A < 0.001 < 0.001 < 0.001 < 0.001
(0.848–0.854) (13.5–16.6) (70.7–71.1) (84.3–87.5)
Model 2
0.888
CCI
(0.886–0.890)
0.895 8.7 31.2 39.9
mCCI-A < 0.001 < 0.001 < 0.001 < 0.001
(0.894–0.897) (7.1–10.3) (30.9–31.5) (38.3–41.5)
Table 4. Model performance of the mCCI-A in the validation and development cohorts. cNRI, continuous net
reclassification improvement; CCI, Charlson Comorbidity Index; mCCI-A, modified version of the Charlson
Comorbidity Index for Asian populations; cNRITotal = cNRIEvent + cNRINon-event. Model 1; univariate. Model
2; adjusted for age (quartile), sex, region and family income ratio (11 groups). a p-value for the c statistic was
taken and computed for a contrast test.
c statistic cNRIEvent cNRINon-event cNRITotal
(95% CI) p-valuea (%, 95% CI) p- value (%, 95% CI) p-value (%, 95% CI) p-value
Mild liver disease (n = 137,253)
0.851
CCI
(0.846–0.855)
0.862 4.8 43.8 48.5
mCCI-A < 0.001 < 0.001 < 0.001 < 0.001
(0.853–0.866) (2.3–7.2) (43.3–44.3) (46.1–51.0)
Chronic pulmonary disease (n = 271,438)
0.878
CCI
(0.876–0.880)
0.887 9.3 35.3 44.6
mCCI-A < 0.001 < 0.001 < 0.001 < 0.001
(0.885–0.889) (7.5–11.1) (34.9–35.6) (42.8–46.4)
Diabetes mellitus (n = 69,665)
0.753
CCI
(0.747–0.759)
0.768 6.6 32.6 39.2
mCCI-A < 0.001 < 0.001 < 0.001 < 0.001
(0.763–0.774) (4.2–9.1) (31.8–33.3) (36.6–41.8)
Moderate or severe renal disease (n = 7,494)
CCI 0.665 (0.651–0.679)
mCCI-A 0.676 (0.662–0.691) < 0.001 14.8 (9.7–19.8) < 0.001 20.7 (18.3–23.2) < 0.001 35.5 (29.8–41.1) < 0.001
Table 5. Model performance of the mCCI-A in the subgroup analysis with specific disease. cNRI, continuous
net reclassification improvement; CCI, Charlson Comorbidity Index; mCCI-A, modified version of the
Charlson Comorbidity Index for Asian populations; cNRITotal = cNRIEvent + cNRINon-event. All models were
adjusted for age (quartile), sex, region and family income ratio (11 groups). a p-value for the c statistic was
taken and computed for a contrast test.
admitted between 2002 and 2013 and developed a comorbidity index that provides better risk stratification. In
addition, we performed a cross validation of the new index. Additionally, the superior performance of the new
index over the original CCI was shown. Notably, this report has two major implications. First, in contrast to
the previous CCI, the mCCI-A score reflects the current medical environment. Comparing the weights in the
CCI with the weights in the mCCI-A, the increased weights of cerebrovascular disease, circulatory systems (MI
Scientific Reports | (2020) 10:13715 | https://doi.org/10.1038/s41598-020-70624-8 7
Vol.:(0123456789)www.nature.com/scientificreports/
and CHF) and nonmetastatic tumors are likely associated with the increased prevalence of these diseases. This
tendency is consistent with recent studies investigating populations with specific diseases in Korea10,11. Addition-
ally, recent advances in the effectiveness of the treatment of metastatic cancer has led to a decreased mortality
rate. This change is likely due to the decreased weights of metastatic cancer in this study. The second implication
is that this study, based on the overall cohort of inpatients, overcame the limitations associated with the use of
small sample sizes in previous studies. For example, AIDS was not considered in a previous study modifying the
CCI due to the small sample size. However, in this study, obtaining the weights of AIDS was possible because
of the large sample size.
This study has several limitations. First, in contrast to collecting data through chart reviews, the determina-
tion of the prevalence of diseases is generally problematic using administrative d ata19. Second, although the
use of administrative data has advantages, such as the conservation of time and resources and consistency in
diagnosis, the diagnoses may be inappropriate due to physician preferences regarding diagnostic codes. Third,
administrative data do not include biochemical parameters such albumin and hemoglobin, which could affect
the survival rate. Fourth, new values for the weight of each comorbidity were derived in this study, but no expert
agreement on them could be derived and will need to be considered later. Fifth, because this study was conducted
for patients from 2002 to 2013, there is a limitation to the application of hospitalized patients after 2013. Last,
although there were interactions between variables and comorbidities that we considered in our analysis, the
interaction test was not conducted in our study.
Methods
Data source and study samples. The main data source used in this study was the National Health Insur-
ance Service-National Sample Cohort (NHIS-NSC) obtained from the National Health Insurance Service (NHIS)
in South Korea. The NHIS-NSC database has been publicly available since July 2014 and contains a substantial
amount of information regarding health care utilization, health screening, sociodemographic variables and mor-
tality in Korean citizens. Detailed information obtained from the NHIS-NSC has been previously p ublished20,21.
Briefly, The NHIS-NSC covers health insurance claims filed between January 1, 2002 and December 31, 2013. Of
the eligible population in 2002 (46,605,433 target individuals of 47,851,928 individuals constituting the entire
Korean population), 1,025,340 participants (2.2% of the target population) were randomly selected until 2013
and were followed until 2013 (for 12 years). All traceable identifiers were removed before publishing to protect
patient confidentiality.In this study, 578,547 patients (56.4% of the NHIS-NSC) who were hospitalized at least
once were analyzed longitudinally. Except for 7,831 patients who died immediately or same month as hospitali-
zation after admission, the total number of patients in our cohort was 570,716.
Study variables. Using the International Classification of Diseases, 10th revision (ICD-10), we identified
the Charlson comorbidities among the secondary diagnoses based on all diseases that were diagnosed from both
ischarge22. To develop the modified index, we used the same comorbid
inpatient and outpatient services before d
conditions covered by the CCI, including MI, CHF, peripheral vascular disease, cerebrovascular disease, demen-
tia, chronic pulmonary disease, connective tissue disease, ulcer disease, mild liver disease, diabetes, hemiplegia,
diabetes with end-organ damage, any tumor (including leukemia and lymphoma), moderate to severe liver dis-
ease, metastatic solid tumors and AIDS. We retrieved all records of each patient from the National Health Insur-
ance database prior to the date of the discharge to identify the comorbidities. A patient was considered to have
a comorbid condition if the condition was present in the index admission records. The outcomes included all-
cause long-term mortality within the follow-up period after admission. Additionally, the National Health Insur-
ance claims databases were used to identify mortality. Death occurring between January 1, 2002 and December
31, 2013, was considered in the development and validation cohorts. However, patients with admission and
death occurring in the same month were excluded. The demographic information of both cohorts included age,
sex, region, and family income.
Statistical analysis. First, to analyze the baseline characteristics of the study population, we merged the
demographic and medical utilization data. A Cox regression analysis adjusted for age (quartile), sex, region and
family income ratio was performed to develop new weights for the comorbidities. We obtained the adjusted HRs
and 95% confidence intervals (CIs) after adjusting for age, sex, region, family income ratio, and all 17 comorbidi-
ties. The prognostic weights of the mCCI-A were computed by dividing the HRs associated with each comor-
bidity by the lowest HRs23. Then, the relative weights were truncated to integer values rounded to zero decimal
places. The comorbidity score of each patient was calculated by summing the weights. Kaplan–Meier survival
curves24 were generated to compare the performance of the CCI to the performance of the mCCI-A.
We performed internal-validation partitioning of the main data set into two sets comprising 70% of the sample
for training and 30% of the sample for testing using a random sampling function with the variable of death as a
reference parameter. In total, 70% (n = 399,502) of the sample was used for training to develop new comorbidity
weights, and the remaining 30% (n = 171,214) of the sample was used as a validation cohort.
To assess the capacity of discriminating between the indices, a c statistic was calculated using the area
under the receiver-operator c urve25. To determine the statistical significance and 95% CIs of the c statistic, a
Mann–Whitney test was performed with a contrast test. The continuous net reclassification improvement (cNRI)
score obtained by performing logistic regression models was calculated to evaluate the reclassification26. For
the binary response, i.e., death, the function improveprob in R was used to determine whether the predictions
obtained from the model of mCCI-A significantly differed from those obtained from the model of the original
CCI27. The cNRItotal is the sum of cNRIEvent and cNRINon-event, indicating the sum of the net proportions of subjects
who died (Event) and who did not die (Non-event) were correctly reassigned a predicted risk.
Scientific Reports | (2020) 10:13715 | https://doi.org/10.1038/s41598-020-70624-8 8
Vol:.(1234567890)www.nature.com/scientificreports/
The data were analyzed by using SAS 9.4 for Windows software (SAS Institute, Cary, NC, USA) and R soft-
ware version 4.0.0 (Comprehensive R Archive Network: https://cran.r-project.org). In all analyses, p < 0.05 was
considered statistically significant.
Ethical approval. This study was conducted in accordance with the principles of the Declaration of Hel-
sinki. The study was approved by the Institutional Review Board (IRB) of Seoul National University Hospital
(1610-038-797), and the study protocol was approved by the IRB. Under IRB approval, the informed consent
waived.
Data availability
The datasets generated during and/or analyzed during the current study are available from the corresponding
author on reasonable request.
Received: 17 April 2018; Accepted: 28 July 2020
References
1. Valderas, J. M., Starfield, B., Sibbald, B., Salisbury, C. & Roland, M. Defining comorbidity: implications for understanding health
and health services. Ann. Fam. Med. 7, 357–363. https://doi.org/10.1370/afm.983 (2009).
2. Charlson, M. E., Pompei, P., Ales, K. L. & MacKenzie, C. R. A new method of classifying prognostic comorbidity in longitudinal
studies: development and validation. J. Chronic Dis. 40, 373–383. https://doi.org/10.1016/0021-9681(87)90171-8 (1987).
3. Singh, B. et al. Validation of the Charlson comorbidity index in patients with head and neck cancer: a multi-institutional study.
Laryngoscope 107, 1469–1475. https://doi.org/10.1097/00005537-199711000-00009 (1997).
4. Fried, L., Bernardini, J. & Piraino, B. Charlson comorbidity index as a predictor of outcomes in incident peritoneal dialysis patients.
Am. J. Kidney Dis. 37, 337–342. https://doi.org/10.1053/ajkd.2001.21300 (2001).
5. Tessier, A., Finch, L., Daskalopoulou, S. S. & Mayo, N. E. Validation of the Charlson Comorbidity Index for predicting functional
outcome of stroke. Arch. Phys. Med. Rehabil. 89, 1276–1283. https://doi.org/10.1016/j.apmr.2007.11.049 (2008).
6. Christensen, S., Johansen, M. B., Christiansen, C. F., Jensen, R. & Lemeshow, S. Comparison of Charlson comorbidity index with
SAPS and APACHE scores for prediction of mortality following intensive care. Clin. Epidemiol. 3, 203–211. https: //doi.org/10.2147/
clep.s20247 (2011).
7. Athienites, N. V. et al. Comorbidity assessment in hemodialysis and peritoneal dialysis using the index of coexistent disease. Semin.
Dial. 13, 320–326. https://doi.org/10.1046/j.1525-139x.2000.00095.x (2000).
8. van Manen, J. G. et al. How to adjust for comorbidity in survival studies in ESRD patients: a comparison of different indices. Am.
J. Kidney Dis Off. J. Natl. Kidney Found. 40, 82–89. https://doi.org/10.1053/ajkd.2002.33916 (2002).
9. Khan, I. H. et al. Influence of coexisting disease on survival on renal-replacement therapy. Lancet (London, England) 341, 415–418.
https://doi.org/10.1016/0140-6736(93)93003-j (1993).
10. Park, J. Y. et al. Recalibration and validation of the Charlson comorbidity index in Korean incident hemodialysis patients. PLoS
ONE 10, e0127240. https://doi.org/10.1371/journal.pone.0127240 (2015).
11. Cho, H. et al. Development and validation of the modified Charlson comorbidity index in incident peritoneal dialysis patients:
a national population-based approach. Perit. Dial. Int. J. Int. Soc. Perit. Dial. 37, 94–102. https://doi.org/10.3747/pdi.2015.00201
(2017).
12. D’Hoore, W., Bouckaert, A. & Tilquin, C. Practical considerations on the use of the Charlson comorbidity index with administra-
tive data bases. J. Clin. Epidemiol. 49, 1429–1433. https://doi.org/10.1016/s0895-4356(96)00271-5 (1996).
13. Deyo, R. A., Cherkin, D. C. & Ciol, M. A. Adapting a clinical comorbidity index for use with ICD-9-CM administrative databases.
J. Clin. Epidemiol. 45, 613–619. https://doi.org/10.1016/0895-4356(92)90133-8 (1992).
14. Schneeweiss, S. & Maclure, M. Use of comorbidity scores for control of confounding in studies using administrative databases.
Int. J. Epidemiol. 29, 891–898. https://doi.org/10.1093/ije/29.5.891 (2000).
15. Chu, Y. T., Ng, Y. Y. & Wu, S. C. Comparison of different comorbidity measures for use with administrative data in predicting
short- and long-term mortality. BMC Health Serv. Res. 10, 140. https://doi.org/10.1186/1472-6963-10-140 (2010).
16. Ghali, W. A., Hall, R. E., Rosen, A. K., Ash, A. S. & Moskowitz, M. A. Searching for an improved clinical comorbidity index for
use with ICD-9-CM administrative data. J. Clin. Epidemiol. 49, 273–278. https://doi.org/10.1016/0895-4356(95)00564-1 (1996).
17. Quan, H. et al. Updating and validating the Charlson comorbidity index and score for risk adjustment in hospital discharge
abstracts using data from 6 countries. Am. J. Epidemiol. 173, 676–682. https://doi.org/10.1093/aje/kwq433 (2011).
18. Nakaya, A. et al. Retrospective analysis of Charlson comorbidity index (CCI). Gan to kagaku ryoho Cancer Chemother. 41, 673–675
(2014).
19. Lee, D. S. et al. Comparison of coding of heart failure and comorbidities in administrative and clinical data for use in outcomes
research. Med. Care 43, 182–188. https://doi.org/10.1097/00005650-200502000-00012 (2005).
20. Cheol Seong, S. et al. Data resource profile: The National Health Information Database of the National Health Insurance Service
in South Korea. Int. J. Epidemiol. 46, 799–800. https://doi.org/10.1093/ije/dyw253 (2017).
21. Lee, J., Lee, J. S., Park, S. H., Shin, S. A. & Kim, K. Cohort profile: The National Health Insurance Service-National Sample Cohort
(NHIS-NSC) South Korea. Int. J. Epidemiol. 46, e15. https://doi.org/10.1093/ije/dyv319 (2017).
22. Quan, H. et al. Coding algorithms for defining comorbidities in ICD-9-CM and ICD-10 administrative data. Med. Care 43,
1130–1139. https://doi.org/10.1097/01.mlr.0000182534.19832.83 (2005).
23. Hemmelgarn, B. R., Manns, B. J., Quan, H. & Ghali, W. A. Adapting the Charlson Comorbidity Index for use in patients with
ESRD. Am. J. Kidney Dis. 42, 125–132. https://doi.org/10.1016/s0272-6386(03)00415-3 (2003).
24. Kaplan, E. L. & Meier, P. Nonparametric estimation from incomplete observations. J. Am. Stat. Assoc. 53, 457–481 (1958).
25. Harrell, F. E. Jr., Lee, K. L. & Mark, D. B. Multivariable prognostic models: issues in developing models, evaluating assump-
tions and adequacy, and measuring and reducing errors. Stat. Med. 15, 361–387. https://doi.org/10.1002/(sici)1097-0258(19960
229)15:4%3c361::aid-sim168%3e3.0.co;2-4 (1996).
26. Pencina, M. J., D’Agostino, R. B. Sr., D’Agostino, R. B. Jr. & Vasan, R. S. Evaluating the added predictive ability of a new marker:
from area under the ROC curve to reclassification and beyond. Stat. Med. 27, 157–172. https://doi.org/10.1002/sim.2929 (2008)
(discussion 207-112).
27. Pencina, M. J., D’Agostino, R. B. Sr. & Steyerberg, E. W. Extensions of net reclassification improvement calculations to measure
usefulness of new biomarkers. Stat. Med. 30, 11–21. https://doi.org/10.1002/sim.4085 (2011).
Scientific Reports | (2020) 10:13715 | https://doi.org/10.1038/s41598-020-70624-8 9
Vol.:(0123456789)www.nature.com/scientificreports/
Acknowledgements
This research was supported by the Basic Science Research Program through the National Research Foundation
of Korea (NRF) funded by the Ministry of Education (No. 2017R1D1A1B03034584) and a clinical research grant-
in-aid from the Seoul National University Boramae Medical Center (Grant/Award Number: 03-2016-11), which
had no roles in the study design, data collection, analysis, interpretation or in manuscript writing.
Author contributions
J.P.L., M.H.K designed the study. M.H.K., Y.H.L., H.J.B. collected data sources. J.S.C., M.H.K., Y.C.K., J.H.N.,
J.Y.P., J.P.L. analyzed and interpreted the data. J.S.C., M.H.K., J.Y.P., J.P.L. wrote the manuscript. J.S.C., M.H.K.,
J.Y.P., D.K.K., J.P.L. reviewed and revised the manuscript.
Competing interests
The authors declare no competing interests.
Additional information
Correspondence and requests for materials should be addressed to J.P.L.
Reprints and permissions information is available at www.nature.com/reprints.
Publisher’s note Springer Nature remains neutral with regard to jurisdictional claims in published maps and
institutional affiliations.
Open Access This article is licensed under a Creative Commons Attribution 4.0 International
License, which permits use, sharing, adaptation, distribution and reproduction in any medium or
format, as long as you give appropriate credit to the original author(s) and the source, provide a link to the
Creative Commons license, and indicate if changes were made. The images or other third party material in this
article are included in the article’s Creative Commons license, unless indicated otherwise in a credit line to the
material. If material is not included in the article’s Creative Commons license and your intended use is not
permitted by statutory regulation or exceeds the permitted use, you will need to obtain permission directly from
the copyright holder. To view a copy of this license, visit http://creativecommons.org/licenses/by/4.0/.
© The Author(s) 2020
Scientific Reports | (2020) 10:13715 | https://doi.org/10.1038/s41598-020-70624-8 10
Vol:.(1234567890)You can also read