How Walkable is Melbourne? - Australian Urban Observatory
←
→
Page content transcription
If your browser does not render page correctly, please read the page content below
How Walkable is Melbourne?
The Development of a Transport Walkability Index For
Metropolitan Melbourne.

 Place, Health and Liveability Research Program

 Billie Giles-Corti, Suzanne Mavoa, Serryn Eagleson,
 Melanie Davern, Rebecca Roberts & Hannah Badland
Recommended citation:
Giles-Corti, B., Mavoa, S., Eagleson, S., Davern, M., Roberts B., Badland, H.M., (2014) Transport Walkability
Index: Melbourne. McCaughey VicHealth Centre for Community Wellbeing,
Melbourne: The University of Melbourne.

ISBN Numbers:
978-0-9804620-3-6 (Digital); 978-0-9804620-4-3 (Print)

Photography:
Jana Petrakov
CONTENTS

Executive Summary ..............................................................................................................................5
Nomenclature .........................................................................................................................................7
Introduction ............................................................................................................................................9
   Calculating the Transport Walkability Index .................................................................................10
   Input Data .........................................................................................................................................10
       Residential Density ........................................................................................................................10
       Street Connectivity ........................................................................................................................10
       Land Use Mix ......................................................................................................................... 10 - 11
       Bringing the Data Together to Form the Transport Walkability Index ...........................................11
Mapping the Transport Walkability Index .........................................................................................13
Challenges and Recommendations ...................................................................................................15
Next Steps ............................................................................................................................................15
Acknowledgements .............................................................................................................................17
References...........................................................................................................................................19

                                                                      3
4
EXECUTIVE SUMMARY

Creating walkable compact cities is a global priority,        This report outlines the development of a Transport
and also a priority in Melbourne. There is a growing          Walkability Index. Drawing on research initiated in the
body of evidence showing that city design has a               United States and further developed in Adelaide and
profound impact on the willingness and ability of             Perth, we have developed and mapped a walkability
residents to walk for transport. Higher density, mixed        index with three components found to be associated
use developments with connected street networks               with walking for transport: mixed use planning,
encourage more local walking for transport.                   population density and street connectivity. This could
Encouraging active forms of transportation is not only        be used by decision-makers to identify areas for
beneficial for traffic management and the                     renewal to increase local walkability; and to monitor
environment, but is also very beneficial for the health       progress      towards   creating    more      walkable
and wellbeing of residents.                                   neighbourhoods over time.

                                                              We welcome feedback about the transport walkability
                                                              index and its use to inform policy and practice.

                                                          5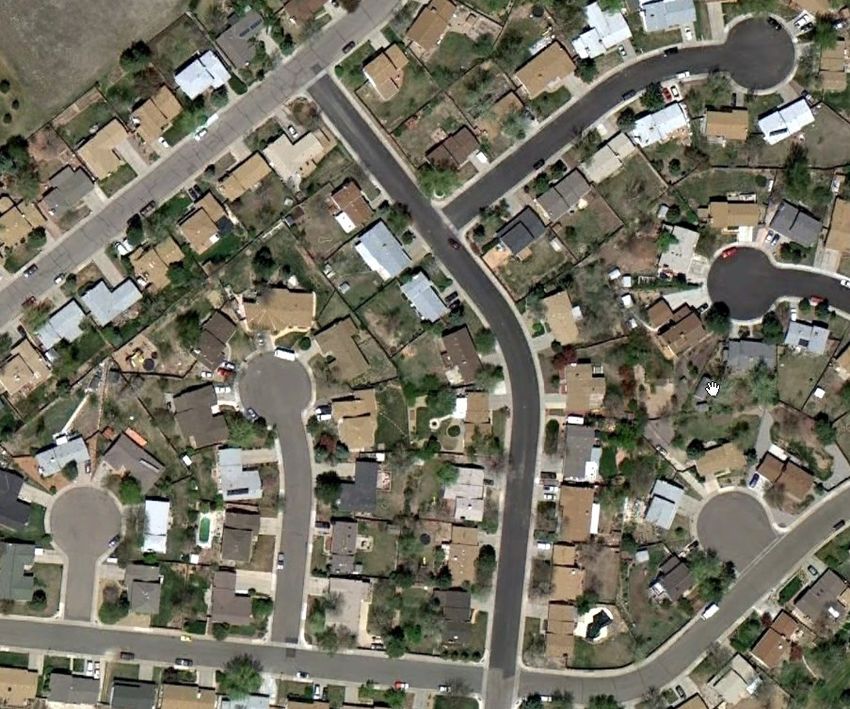
6
NOMENCLATURE

ABS     Australian Bureau of Statistics

ANDS    Australian National Data Service

AURIN   Australian Urban Research Infrastructure Network

GIS     Geographical Information System

LGA     Local Government Area

MPA     Metropolitan Planning Authority

RMF     Regional Management Forum

SA1     Statistical Area 1

                                                 7
8
INTRODUCTION

Creating walkable neighbourhoods is a global priority          There is consistent evidence that the combination of
and a priority in Melbourne.1 Compact walkable                 higher residential densities, well-connected street
neighbourhoods promote active modes of transport               networks and mixed land uses are positively
including walking, cycling and public transport use. 2         associated with people walking for transport to local
Walkable neighbourhoods provide individuals and                destinations.10, 11, 15 Hence, across the world, these
communities with a range of tangible health,                   variables have been combined into a transport
economic and environmental benefits3 by: increasing            walkability index using a methodology first developed
physical activity levels,2 which reduces the risk of           by Frank in the United States,4, 16 then trialled in
obesity;4 improving neighbourhood social capital5 and          Adelaide Australia for the PLACE study17 and further
sense of community,6 lowering the risk of traffic              developed in Perth for the RESIDE study.11, 18 Using
incidents,7 increasing local economic spend8 and               this index, people living in neighbourhoods with
reducing greenhouse gas emissions.9 Hence, there               connected street works, higher population density and
is growing recognition that creating walkable                  a variety of local destinations (e.g., jobs, shops,
communities would not only be good traffic                     services,) score higher on the transport walkability
management and the environment, but would also                 index. In contrast sprawling areas with cul-de-sacs,
produce important health benefits.2                            lower population densities and fewer local destinations
                                                               receive a lower score.
Walking for transport is defined as walking en route to
destinations or to public transport. There are a variety       The Transport Walkability Index has numerous
of reasons why people choose walking as a means of             applications including the ability to inform policymakers
transport: it is low cost, easier than driving for some,       and planners where investment is required to improve
some have no choice because they are unable to                 the walkability of an area. If repeated over time, it can
drive (e.g., children, adolescents or older adults),           be used to monitor progress over time.            Can the
while for others it is convenient. However, the ability        walkability of an area be enhanced? Some of the
of residents to walk locally, depends on the way their         options available to improve walkability include
neighbourhood is designed. Walking for transport is            improving the street network connections for walking;
more likely if neighbourhoods have well-connected              focussing urban densification and development around
street networks, a variety of local destinations               public transport hubs which provide local shops and
including public transport, and there is adequate              services; and designing new greenfield developments,
residential and employment density to support local            and retrofitting sprawling neighbourhoods, with
shops, services and public transport.10        Evidence        medium to high density developments with active
from Australia and across the world shows that                 street frontages.19 The walkability index could
residents of more walkable neighbourhoods (i.e.,               therefore be used to provide input into planning future
connected street networks, mixed use planning and              communities and urban renewal. Hence this report
higher densities) are around twice as likely to walk for       describes the development of a Transport Walkability
transport as those living in ‘low’ walkable                    Index for Metropolitan Melbourne. The index was
neighbourhoods.11-14                                           calculated using spatial data in Metropolitan
                                                               Melbourne and visualised in a thematic map.

                                                           9
Calculating the Transport Walkability Index Residential density
The Transport Walkability Index has been calculated Residential density is an important variable for the
based on the collaboration between health creation of walkable neighbourhoods. Higher density
researchers and geographical information specialists neighbourhoods generally result in the creation of
working together to answer the question “What more uses of land decreasing the distance between
makes a pedestrian-friendly neighbourhood and how home and local destinations.
can it be measured?” The goal is to measure
transport walkability, the importance of the input For the Transport Walkability Index the gross dwelling
datasets and measurement procedures. density was calculated by dividing the number of
dwellings within a small statistical area (defined by the
ABS) by the area of the statistical area. More
semi-rural areas with very low gross residential
Input data densities of less than 3 dwellings per hectare were
Calculating the Transport Walkability Index required excluded from the analysis along with areas without a
the input of three main datasets residential density, population because they were deemed to represent
street connectivity and land use mix. Figure 1 below either a peri-urban or non-relevant environment.
outlines the source and geography of these datasets
each of which have been imported and harmonised Street connectivity
within a Geographic Information Systems (GIS)
platform. One factor used to assess the degree of sprawl in a
community is the degree to which streets networks are
Further information relating to the importance of each connected. Well connected street networks facilitate
dataset and the method used to calculate the both the provision of direct pedestrian routes as well
transport walkability index is outlined below. as supporting route diversity when travelling between
an origin and destination. Higher levels of street
connectivity have been positively associated with
Not Applicable Areas walking for transport.21 The two examples provided in
Figure 2 below illustrate the different distances able to
Areas determined as being not applicable for walking
be walked in areas of high and low walkable areas.
for transport have been modelled based on the
Australian Bureau of Statistics (ABS) SEIFA index 20 For the transport walkability index street, connectivity
and the criteria for this includes: was calculated by identifying intersections with 3 or
streets forming an intersection. The number of
has no usual addresses;
intersections meeting this criterion was then divided by
the usual resident population is less than or the area of the SA1. Intersections were extracted from
equal to 10; road network data 22.
the area is classified as off-shore or
migratory;
Land use mix
there are less than 6 employed persons;
there are less than 6 classifiable occupied Neighbourhoods which support walking for transport
also include a range of complementary land uses that
private dwellings;
are located together in a balanced mix, including
the proportion of people in private dwellings is residential development, shops, employment, and
less than or equal to 20% and community and recreation facilities. This is because
the denominator of a variable in the index is the diversity of destinations means that people are
less than 6. able to walk to services and jobs.
Transport Walkability Index
Area Filter (Not Applicable Areas)
Residential Density Street Connectivity Land Use Mix
Source: ABS 2011 Population Census Source: VicMapTransport 2012 road Source: Valuer General 2010
Geographic Area: Statistical Area 1 network Geographic Area: Land Parcel
Geographic Area: Road Segments
Figure 1: Schematic Diagram of data inputs in to the Transport Walkability Index
10Other benefits of a high level of mixed land use for Land use mix for a given SA1 area was calculated
walking are the enhanced vitality and perceived using an entropy formula,16 which produces a value
security of areas; these are improved through the between 0 and 1. A score of 0 means that the SA1
increase in natural surveillance, which can be contained a single land use. In contrast a land use mix
attributed to the higher number of people on the score of 1, means that the SA1 contained an equal
street and in public spaces. area of all land uses.
For the Transport Walkability Index, land use mix was
derived based on the Valuer-General Victoria (2010)
dataset23. Using the Australian Valuation Property Bringing the data together to form the
Classification Code (AVPCC) each land parcel was Transport Walkability Index
classified according to five categories: residential,
retail, commercial, community (e.g. schools, Each of the values for the input datasets (Residential
libraries), and recreation facilities (excluding public Density, Street Connectivity and Land Use Mix) were
open space). The land use categories were selected normalised (via z-scores), and all the values were then
based on research that has shown that these types of brought into the range 0-1. The final Transport
land use are associated with walking for transport.11 Walkability Index was calculated by summing the
Each land parcel was assigned a single land use. z-scores for dwelling density, street connectivity, and
Where there are multiple land uses in a single parcel land use mix (this method has been adapted to the
(e.g., a building with a shop on the ground floor, and data available in Melbourne, however it follows a
apartments above) a single land use was selected similar method as previous studies presented by
based on the following priority: retail, commercial, Christian and colleagues11 and Frank and
community, recreation (excluding public open space), colleagues.16.
residential, and other. Land use classes were based For ease of interpretation, the Transport Walkability
on classes used by the Western Australia Ministry for Index scores have been scaled so they can be
Planning 24. The priority was determined by interpreted as deciles for visualisation and analysis,
researchers who considered the likelihood of the land rather than using the sum of the z-scores. The
use being treated as a destination to walk to and was individual index scores are still provided for research
based on previous analyses by Christian and purposes within the output, and can still be
colleagues.11 interrogated within a GIS platform.
Figure 2a: Highly connected Figure 2b: Low connectivity
(Data sourced from VicMap
Transport, 2012)
1112
MAPPING THE TRANSPORT WALKABILITY INDEX
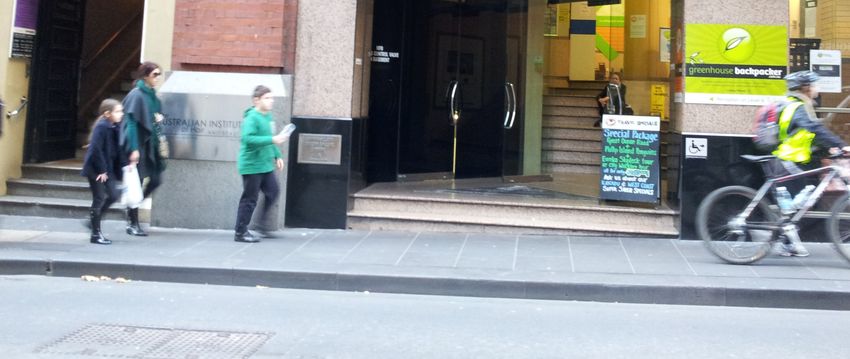
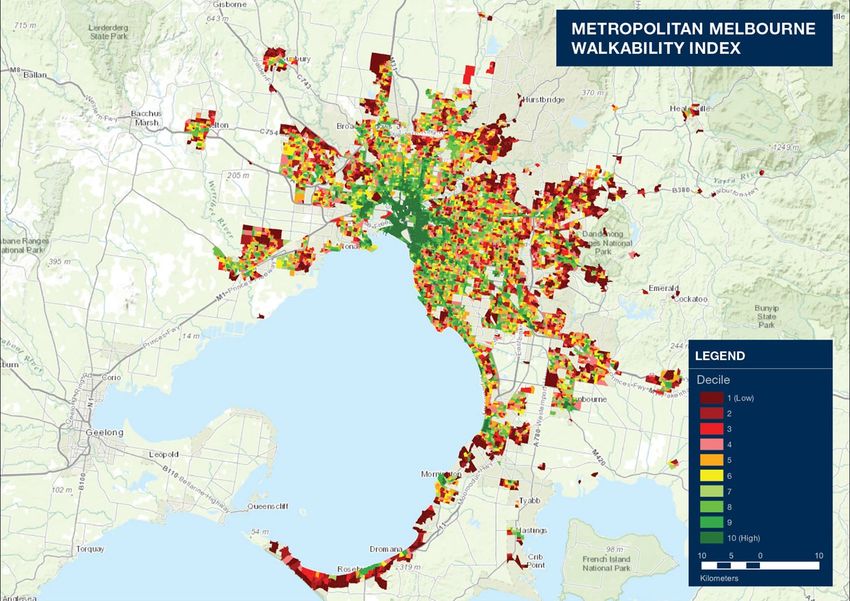
Maps provide the ability to visualise the Transport Within the map it is possible to detect anomalies in
Walkability Index in a geographic context. The which the map deviates from expected results. For
following series of walkability maps illustrate the example the Docklands located on the edge of the
results of the index across Metropolitan Melbourne. Melbourne CBD has been developed as a shopping
Levels of transport walkability are presented as and entertainment precinct. However, the statistical
‘deciles of walkability’ with the more walkable areas area to the west of the Docklands is scored within the
indicated in shades of green, with the most walkable third least walkable areas in Metropolitan Melbourne.
areas in darkest green. Low walkable areas, on the This score is the result of a number of factors including
other hand, are shown in shades of orange (i.e., less the road network which is relatively linear and does not
walkable) to red (i.e., least walkable). As can be contain many intersections, the relatively low land use
seen, most of the outer areas generally exhibit low mix (at the time of data collection), and the large
transport walkability, while inner Melbourne is geographic area. It is understood that this area is
generally shown in shades of green indicating much undergoing rapid change and development and we will
higher transport walkability. monitor progress overtime, when we update the
Transport Walkability Index in the future.
Figure 3: Metropolitan Melbourne Transport Walkability Index
1314
CHALLENGES AND RECOMMENDATIONS

When developing the Transport Walkability Index a                Finally, the Transport Walkability Index we have
number of challenges and limitations were faced.                 developed includes only three variables:         street
Here we list some of the most important challenges               connectivity, mixed land use and density. A number of
and some recommendations on how to overcome                      other variables could be added: for example, traffic
them in the future.                                              exposure, access to footpaths and access to public
                                                                 transport are also important. Future iterations of the
First, the quality of the output rests on the quality and        Transport Walkability Index could be validated to
completeness of each of the input data layers. The               include other environmental characteristics known to
datasets used in the analysis originate from data                be associated with whether or not residents walk.
collections undertaken in 2010, 2011, and 2012 and
this will impact the results. We strongly recommend
that agencies make the relevant data readily
available for use as developed as this will enable the
production of the most up-to-date maps possible.

                                                                                              NEXT STEPS

Translating the results of research into policy and              the meantime, the results of the study are currently
practice is the key driver for developing the walkability        being formatted into Local Government Areas and will
index.       We look forward to local and state                  shortly be distributed through Community Indicators
government feedback in this next phase. However, in              Victoria (www.communityindicators.net.au).

                                                            15
16
ACKNOWLEDGMENTS

Our industry partners for the Place Health and                 Council (NHMRC) Principal Research Fellowship
Liveability Program, the Department of Health NW               (#1004900) and VicHealth. HB is supported by the
Region and the NW Regional Management Forum                    NHMRC CRE in Healthy Liveability Communities
are acknowledged. In particular, the assistance of             (#1061404). In addition, this      project would not be
the former Chair of the NW RMF, Mr Jim Betts, in               possible without the support of the GIS team at the
facilitating access to the data used in this project is        UWA Centre for the Built Environment and Health
gratefully acknowledged. This project is an off-shoot          (CBEH). The CBEH’s RESIDE study team have
of other walkability projects funded by the Australian         contributed to intellectual capital that underpins this
Urban Research Infrastructure Network and this                 project and this expertise and contribution is gratefully
funding is gratefully acknowledged, together with the          acknowledged. In particular, the advice and support
technical and leadership AURIN teams members,                  provided by Dr Bryan Boruff and Mr Nick Middleton
(particularly Professor Bob Stimson, Associate                 (NJM Spatial) are gratefully acknowledged.
Professor Chris Pettit, Dr Martin Tomko, Gus
Macaulay and Dr William Voorsluys for their                    Finally, the walkability index is comprised of three
assistance with this project). Details of this project         main datasets and we would like to acknowledge each
can be found on the AURIN website http://                      of the data custodians: the Office of the Valuer
docs.aurin.org.au/help/analysing-your-data/walkability         General for the Land Use data, Victorian Government
-tools/.     MD, SM and RB are supported by                    for the Roads layer and the Australian Bureau of
Community Indicators Victoria, which is funded by              Statistics (ABS) for the residential density.
VicHealth. BGC by a National Health and Medicine
Research

                                                          17
18
REFERENCES

1.  State of Victoria. Plan Melbourne - Metropolitan          13.   Witten K, Blakely T, Bagheri N, et al.
    Planning Strategy. In: Department of Transport                  Neighborhood built environment and transport
    Planning and Local Infrastructure, ed. Treasury                 and leisure physical activity: findings using
    Place, Melbourne: Victorian Government; 2014.                   objective exposure and outcome measures in
2. Transportation Research Board. Does the built                    New Zealand. Environ Health Perspect. Jul
    environment      influence    physical   activity?              2012;120(7):971-977.
    Examining the evidence. Washington, DC: TRB;              14.   Kerr J, Sallis JF, Owen N, et al. Advancing
    2005.                                                           science and policy through a coordinated
3. Giles-Corti B, Foster S, Shilton T, Falconer R.                  international study of physical activity and built
    The co-benefits for health of investing in active               environments: IPEN adult methods. J Phys Act
    transportation. New South Wales Public Health                   Health. May 2013;10(4):581-601.
    Bulletin. 2010;21:122-127.                                15.   Frank L. How land use and transportation
4. Frank LD, Andresen MA, Schmid TL. Obesity                        systems impact public health: a literature review
    relationships with community design, physical                   of the relationship between physical activity and
    activity, and time spent in cars. Am J Prev Med.                built form. Atlanta: Centers for Disease Control
    Aug 2004;27(2):87-96.                                           and Prevention; 2000.
5. Leyden KM. Social capital and the built                    16.   Frank LD, Schmid TL, Sallis JF, Chapman J,
    environment: the importance of walkable                         Saelens BE. Linking objectively measured
    neighbourhoods. American Journal of Public                      physical activity with objectively measured urban
    Health. 2003;93(9):1546-1551.                                   form: findings from SMARTRAQ. Am J Prev
6. Wood L, Frank LD, Giles-Corti B. Sense of                        Med. 2005;28(2 Suppl 2):117-125.
    community and its relationship with walking and           17.   Leslie E, Coffee N, Frank L, Owen N, Bauman A,
    neighborhood design. Soc Sci Med. 2010;70                       Hugo G. Walkability of local communities: using
    (9):1381-1390.                                                  geographic information systems to objectively
7. Litman T. Transportation and public health.                      assess relevant environmental attributes. Health
    Annu Rev Public Health. 2013;34:217-233.                        Place. Mar 2007;13(1):111-122.
8. Heart Foundation of Australia. Good for                    18.   Learnihan V, Van Niel KP, Giles-Corti B,
    business. The benefits of making streets more                   Knuiman M. Effect of Scale on the Links
    walking and cycling friendly. Discussion Paper.                 between       Walking     and     Urban   Design.
    Adelaide: Heart Foundation of Australia,; 2011.                 Geographical Research. May 2011;49(2):183-
9. Frank LD, Greenwald MJ, Winkelman S,                             191.
    Chapman J, Kavage S. Carbonless footprints:               19.   Adams R. Transforming Australian Cities. For a
    promoting health and climate stabilization                      more financially viable and sustainable future.
    through active transportation. Prev Med. Jan                    Transportation and urban design. Melbourne:
    2010;50 Suppl 1:S99-105.                                        City of Melbourne and Places Victoria; 2010.
10. Ewing R, Cervero R. Travel and the Built                  20.    Talen E. The walkable neighborhood: A
    Environment. A meta-analysis. J Am Planning                      literature review. Int J Sustainable Land Use
    Assoc. 2010;76(3):265-294.                                       and Urban Planning. 2013;1(1):42-63.
11. Christian HE, Bull FC, Middleton NJ, et al. How           21.    Talen E. The walkable neighborhood: A
      important is the land use mix measure in                       literature review. Int J Sustainable Land Use
      understanding walking behaviour? Results                       and Urban Planning. 2013;1(1):42-63.
      from the RESIDE study. Int J Behav Nutr Phys            22.    State Government of Victoria. VicMap
      Act. 2011;8:55.                                                Transport; 2012.
12. Knuiman MW, Christian HE, Divitini ML, et al. A           23.    Valuer General Victoria. Property Sales and
     Longitudinal Analysis of the Influence of the                   Valuations (PSV). Melbourne; 2010.
     Neighborhood Built Environment on Walking for            24.    Ministry for Planning Western Australia.
     Transportation: The RESIDE Study. Am J                          Commercial Land Use Survey 1997: Perth
     Epidemiol. Sep 1 2014;180(5):453-461.                           Metropolitan Region. W.A.P. Commission:
                                                                     Perth; 2000.

                                                         19
McCaughey VicHealth Community Wellbeing Unit Centre for Health Equity Melbourne School of Population and Global Health Level 5, 207 Bouverie Street University of Melbourne, Victoria 3010 Australia T: +61 3 8344 9101 E: info-mccaughey@unimelb.edu.au www.mccaugheycentre.unimelb.edu.au
You can also read