Predicting neurological deficit in patients with spinal tuberculosis - A single-center retrospective case-control study
←
→
Page content transcription
If your browser does not render page correctly, please read the page content below
SICOT-J 2021, 7, 7
Ó The Authors, published by EDP Sciences, 2021
https://doi.org/10.1051/sicotj/2021002
                                                                                                                                   Available online at:
                                                                                                                                     www.sicot-j.org

    ORIGINAL ARTICLE                                                                                                                 OPEN        ACCESS

Predicting neurological deficit in patients with spinal
tuberculosis – A single-center retrospective case-control study

Samarth Mittal1, Gagandeep Yadav2, Kaustubh Ahuja1, Syed Ifthekar1, Bhaskar Sarkar3,
and Pankaj Kandwal4,*
1
    Senior Resident, AIIMS Rishikesh, 249203 Rishikesh, Uttarakhand, India
2
    Department of Orthopaedics, AIIMS Rishikesh, 249203 Rishikesh, Uttarakhand, India
3
    Assistant Professor, AIIMS Rishikesh, 249203 Rishikesh, Uttarakhand, India
4
    Additional Professor, Consultant Spine Surgeon, AIIMS Rishikesh, 249203 Rishikesh, Uttarakhand, India

              Received 16 December 2020, Accepted 26 January 2021, Published online 5 March 2021

              Abstract – Background: Identifying the risk factors for the neurological deficit in spine tuberculosis would help
              surgeons in deciding on early surgery, thus reducing the morbidity related to neurological deficit. The main objective
              of our study was to predict the risk of neurological deficit in patients with spinal tuberculosis (TB). Methods: The
              demographic, clinical, radiological (X-ray and MRI) data of 105 patients with active spine TB were retrospectively
              analyzed. Patients were divided into two groups – with a neurological deficit (n = 52) as Group A and those without
              deficit (n = 53) as Group B. Univariate and multivariate logistic regression analysis was used to predict the risk factors
              for the neurological deficit. Results: The mean age of the patients was 38.1 years. The most common location of disease
              was dorsal region (35.2%). Paradiscal (77%) was the most common type of involvement. A statistically significant
              difference (p < 0.05) was noted in the location of disease, presence of cord compression, kyphosis, cord oedema, loss
              of CSF anterior to the cord, and degree of canal compromise or canal encroachment between two groups. Multivariate
              analysis revealed kyphosis > 30° (OR – 3.92, CI – 1.21–12.7, p – 0.023), canal encroachment > 50% (OR – 7.34,
              CI – 2.32–23.17, p – 0.001), and cord oedema (OR – 11.93, CI – 1.24–114.05, p – 0.03) as independent risk factors
              for predicting the risk of neurological deficit. Conclusion: Kyphosis > 30°, cord oedema, and canal encroachment
              (>50%) significantly predicted neurological deficit in patients with spine TB. Early surgery should be considered with
              all these risk factors to prevent a neurological deficit.

              Key words: Spinal tuberculosis, Pott’s paraplegia, Neurologic deficit, Risk factors.

Introduction                                                                      sequestra, granulation tissue, caseous material, localized
                                                                                  pressure by internal gibbus, and/or pathological subluxation/
     Tuberculosis (TB) of the spine is most common among                          dislocation of the vertebrae. The spinal cord can undergo
osteoarticular tuberculosis, accounting for about 50% of cases                    inflammatory edema and intrinsic changes like cord atrophy,
[1]. The WHO has reported an estimated incidence of around                        gliosis, syrinx, or myelomalacia all accounting for neural deficit
10 million (range, 9.0–11.1 million) new cases in its global                      [4]. More than one factor may be responsible at a time. Also,
tuberculosis report in 2019 [2]. Delay in diagnosis or manage-                    the location of the disease bears importance concerning
ment of spondylodiscitis may cause serious long-term morbid-                      susceptibility to neural deficit [4]. The insidious course of the
ity [3]. Spinal TB has a slow and insidious onset, presents with                  disease, nonspecific inflammatory markers, lag of radiological
a constellation of symptoms like back pain, malaise, night                        findings on X-ray by 3–4 months can lead to progression of
sweats, fever, and/or weight loss. Neurological deficit is one                     the disease, causing the neurological deficit. The recovery
of its most feared complications, can occur in 10–30% of cases                    pattern after neurological deficit has developed in cases of
[4–7]. It can present as; (a) paraplegia of active disease                        spinal TB is unpredictable.
(early onset) and (b) paraplegia of healed disease (late-onset)                       Some authors have correlated CT and MRI findings to
[6, 7]. Usual causes of neurological complications in caries                      neurological deficit [8, 9] or clinical course of disease
spine include mechanical compression by an abscess, tubercular                    [10, 11] in Pott’s spine. Diffusion tensor imaging (DTI) has also

    *Corresponding author: pankaj.orth@aiimsrishikesh.edu.in, pankajkandwal27@gmail.com

     This is an Open Access article distributed under the terms of the Creative Commons Attribution License (https://creativecommons.org/licenses/by/4.0),
                  which permits unrestricted use, distribution, and reproduction in any medium, provided the original work is properly cited.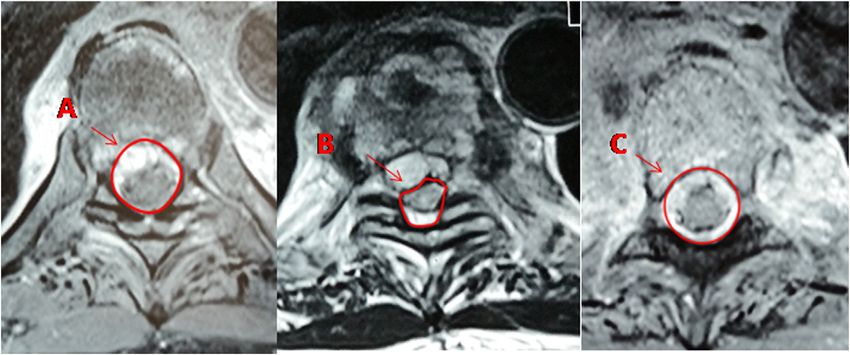
2 S. Mittal et al.: SICOT-J 2021, 7, 7
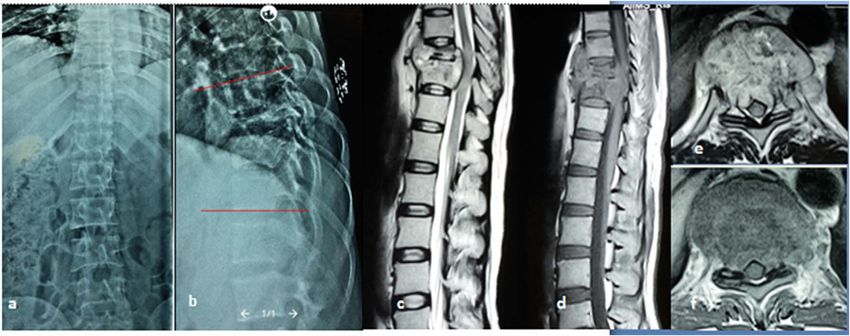
Figure 1. Measurement of canal encroachment in axial section of MRI. A = cross-sectional area of canal one level above the site of maximum
compression, B = area occupied by spinal cord at maximum compression, C = cross-sectional area of canal one level below site of maximum
compression. Average canal area (D) = A + C/2. Percentage of canal encroachment = D B/D 100.
been investigated to show correlation with a neural deficit in TB height from the presumed height for each vertebra, which was
spine in past, however epidural collection and its organized then summed to obtain the total height loss. AVH loss percent-
inflammatory tissue precludes accurate assessment of diffusion age was then calculated as Total height loss/Presumed
characteristics of the compressed cord [12]. Very few studies in AVH 100. Kyphotic angle was calculated using cobbs
the literature have attempted to predict risk factors for the method [18] as the angle between the upper border of upper
neurological deficit in the TB spine [13–15]. Sparse literature normal vertebrae and lower border of lower normal vertebrae.
and lack of objective measurements of canal compression/ Kyphosis more than 30° were compared between two groups
encroachment in MRI in previous studies made us to conduct as a predictive risk factor [15, 19].
this study to identify the risk factors for the neurological deficit MRI was reviewed by two independent observers to
which would help surgeons in making decisions for early sur- decrease interobserver variability and a common agreement
gery and thus avoiding the various complications/morbidity was reached. Observations in MRI included the cause of com-
arising due to neurological deficit in cases of spinal TB. pression (abscess, granulation tissue, disc, vertebral body bulge,
or combination of above), Loss of CSF anterior and posterior to
the cord, cord signal changes, and canal encroachment. Canal
encroachment area was calculated on the axial image at the site
Material and methods of maximum compression using Surgimap software. Percentage
A retrospective case-control study was conducted in the of canal encroachment was calculated by the formula: The
department of orthopaedics after institutional ethical committee average of canal area Spinal cord area/Average of canal
approval. Clinical and radiological data of 105 patients with area 100. Average canal area was calculated by taking the
spinal tuberculosis confirmed on basis of histopathology and/or average canal area of proximal and distal vertebrae to the
culture who presented to our institution from 2016–2019 was diseased segment (Figure 1) [8].
analyzed. Patients with implants not compatible with MRI, Logistic regression analysis was used to predict risk factors
active malignancy, healed disease, paraplegia of late-onset, for the neurological deficit. As the spinal cord ends at the level
spinal tumour syndrome were excluded from our study. of L1 vertebrae, we excluded the cases with “below conus
Neurological deficit was graded as per the ASIA Impairment disease” (lumbar and lumbosacral spine cases) for predicting
scale [16]. Patients with a neurological deficit (ASIA grade the effect of spinal cord changes (cord oedema, loss of CSF
A, B, C, D) were included in Group A (n = 52) and those with- anterior and posterior to the cord) along with other risk factors
out deficit (neurologically intact [NI]) in Group B (n = 53). on the neurological deficit while performing logistic regression
Data included patient demographic characteristics, ASIA grade, analysis.
location of disease (cervical, thoracic, thoracolumbar, lumbar,
lumbosacral), type of involvement (anterior subligamentous, Statistical analysis
central, paradiscal, posterior, panvertebral), number of vertebral
bodies affected, presence or absence of skip lesion, posterior All data were analyzed using IBM, SPSS statistics version
element involvement. 17.0. Descriptive statistics such as mean, standard deviation,
Anterior vertebral Height loss percentage (AVH loss) and percentages, frequencies, cross-tabulations were used for base-
Kyphotic angle were recorded from X-rays. AVH loss percent- line characteristics. An independent t-test was used for compar-
age was calculated by the method described by Jain et al. [17]. ing quantitative data while non-parametric tests were used for
In this method, the mean of the anterior heights of the upper and comparing categorical data. Significance was considered at a
lower normal vertebral bodies were taken as presumed anterior P-value < 0.05. Univariate and multivariate logistic regression
vertebral height (AVH). The loss of the anterior height of analysis was performed. Potentially predictive variables found
affected vertebrae was calculated by subtracting the measured significant in univariate analysis (p < 0.2) [20] were included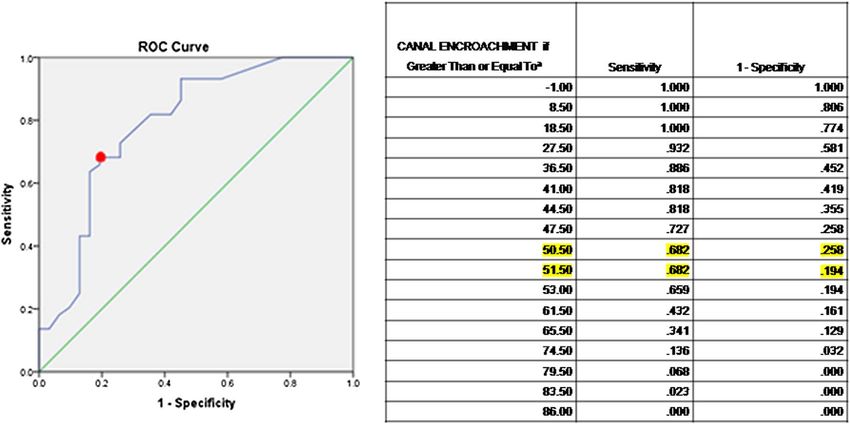
S. Mittal et al.: SICOT-J 2021, 7, 7 3
in multivariate analysis. Methods using forward stepwise
logistic regression was performed to determine statistically
significant risk factors (p < 0.05).
Results
Out of 105 active TB cases who were enrolled in our study,
40/105 (38.1%) were male while 65/105 (61.9%) patients were
female. The mean age of the patients was 38.1 years (range,
12–69 years). The most common location of disease was the
dorsal region (35.2%) followed by Dorsolumbar (27.6%),
Figure 2. Location of lesion in patients with spine TB (n = 105).
Lumbar (24.8%), Cervical (8.6%), and Lumbosacral (3.8%)
Group A – patients with neurological deficit (n = 52). Group B –
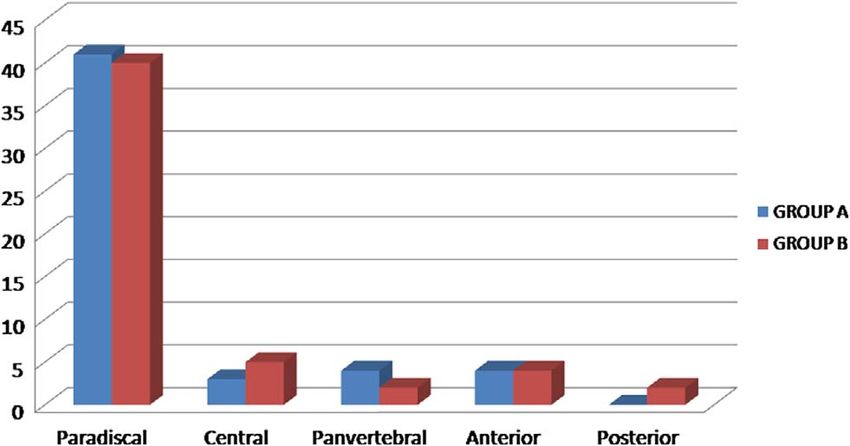
(Figure 2). Paradiscal was the most common type of involve-
patients without deficit (n = 53).
ment seen in 77.1% cases (n = 81) followed by Central type
(n = 8, 7.6%), Anterior subligamentous (n = 8, 7.6%), Pan
vertebral (n = 6, 5.7%), and Posterior type (n = 2, 1.9%)
(Figure 3). Posterior element involvement was seen in 8 cases
(7.6%). Skip lesions were noted in only 5.7% (n = 6) cases.
The average number of vertebral bodies involved was 2.39,
ranging from 1 to 7 in number. The descriptive data of patients
in the two groups is summarized in Table 1. A statistically
significant difference (P < .05) was noted between two groups
in the location of disease, presence of cord compression
kyphotic deformity, cord oedema, loss of anterior CSF around
the cord, and canal encroachment (Table 1).
Age, location of disease (dorsal), AVH loss, kyphosis > 30°,
loss of CSF anterior to the cord, cord oedema, and canal
encroachment were found to be possible risk factors for the Figure 3. Type of involvement of lesion in patients with spinal
neural deficit in univariate analysis (p < 0.2) in our study tuberculosis (n = 105). Group A – patients with neurological deficit
(Table 2). ROC Curve was plotted to assess the overall (n = 52). Group B – patients without deficit (n = 53)
accuracy and the value of canal encroachment above which
had a maximum association with a Neurological deficit. Canal
encroachment value equal to or greater than 50.5–51.5% as the the mean age of the patients was 38.1 years. The dorsal spine
cutoff was best associated with neurological deficit (Figure 4). was the most common region affected (35.2%) followed by
Multivariate logistic regression analysis showed kyphosis > 30° Dorsolumbar (27.6%) region. Literature has also shown the
(OR – 3.92, CI – 1.21–12.7, p – 0.023), canal encroach- dorsal [11, 22] or dorsolumbar region [23, 24] to be the most
ment > 50% (OR – 7.34, CI – 2.32–23.17, p – 0.001), and cord commonly affected site. Paradiscal type of involvement is the
oedema (OR – 11.93, CI – 1.24–114.05, p – 0.03) as indepen- most common type of presentation reported [14, 21, 25], which
dent risk factors for neurological deficit with Nagelkerke R2 was also found in our study (77.1%).
ranging from 0.26 to 0.42 (Table 3). A large number of patients still present in advanced stages
of the disease for the first time. Delay in the start of treatment
leads to the progression of the natural course of the disease and
Discussion worsening of neurological deficit in Spinal TB, ranges from 10
to 43% in various studies [25, 26]. In our study 49.5% of
TB spine is a medical disease with reserved surgical indica- patients presented with a neurological deficit which is likely
tions [4]. Problems arising from immobilization due to neuro- due to complicated cases referred for management in our
logical deficit can complicate the disease and might become tertiary care center. The cause of deficit in active TB cases
greater problems than the primary disease itself. Thus, it can be mechanical compression by an abscess, sequestra, case-
becomes important to identify the clinic-radiological risk factors ous tissues, debris, and granulation tissue. Mechanical instabil-
beforehand that can predict the worsening of neurology so that ity, inflammatory oedema of the cord, intrinsic cord changes
timely surgical intervention could be added to the medical can also occur leading to neural deficit [6]. We considered all
treatment. As per the Global tuberculosis report 2019, India these risk factors while evaluating for the neurological deficit
accounts for 27% of the global total making it among the top in our study. The limitation of our study is the small sample size
eight countries which accounts for two-thirds of the global in each group after the exclusion of lumbar and lumbosacral
tuberculosis burden [2]. Tuberculosis of the spine is an impor- cases for multivariate analysis. Also, the ASIA grading has
tant health problem, especially in developing countries like its own limitation that it does not account for pain, spasticity,
India due to poverty, undernutrition, and the immigrant popula- or dysesthesia that might result from spinal cord injury or
tion [21]. TB affects both sexes of all age groups. In our study, compression.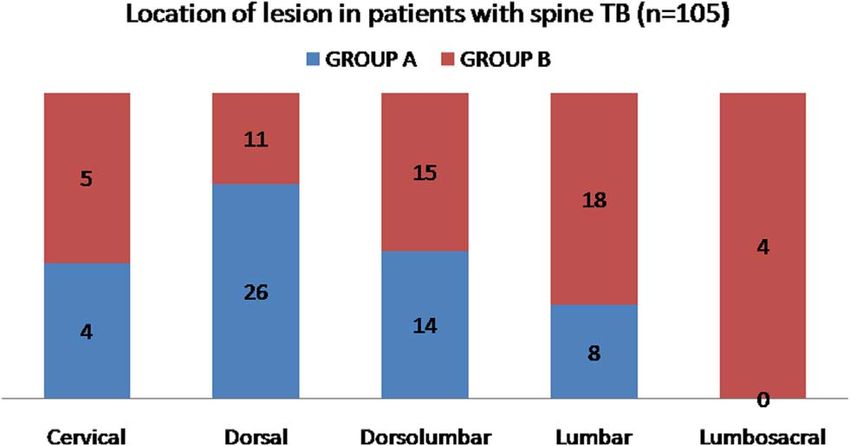
4                                                 S. Mittal et al.: SICOT-J 2021, 7, 7

Table 1. Descriptive data of the patients (N = 105).
Characteristic                                             Group A (n = 52)                       Group B (n = 53)                 P-value
Age (mean [SD])                                              40.31 (17.03)                          35.56(15.77)                    0.401
Sex (n, [%])                                                                                                                        0.939
  Male                                                            20 (38.5%)                         20 (37.7%)
  Female                                                          32 (61.5%)                         33 (62.3%)
Location (n, [%])                                                                                                                   0.007
  Cervical                                                         4 (7.7%)                           5   (9.4%)                     0.75
  Dorsal                                                          26 (50.0%)                         11   (20.8%)                   0.002
  Dorsolumbar                                                     14 (26.9%)                         15   (28.3%)                   0.874
  Lumbar                                                           8 (15.4%)                         18   (34.0%)                   0.027
  Lumbosacral                                                          0                              4   (7.5%)                    0.043
Neurological deficit (n, [%])
  Grade A                                                         13   (25.0%)
  Grade B                                                          5   (9.6%)
  Grade C                                                         14   (26.9%)
  Grade D                                                         20   (38.5%)
  Grade E                                                                                            53 (100%)
Type of involvement (n, [%])                                                                                                         0.53
  Paradiscal                                                      41   (78.8%)                       40   (75.5%)                   0.681
  Central                                                          3   (5.8%)                         5   (9.4%)                    0.479
  Panvertebral                                                     4   (7.7%)                         2   (3.8%)                    0.387
  Anterior                                                         4   (7.7%)                         4   (7.5%)                    0.978
  Posterior                                                              0                            2   (3.8%)                    0.157
Posterior element (n, [%])
  Involved                                                         5 (9.6%)                           4 (7.5%)                      0.705
Compression (n, [%])                                                                                                                0.001
  Abscess                                                         44(84.6%)                           35(66%)
  Granulation tissue                                               2 (3.8%)                           1 (1.9%)
  Disc                                                             3 (5.8%)                               0
  Vertebral body bulge                                             2 (3.8%)                           5 (9.4%)
  None                                                             1 (1.9%)                          12 (22.6%)
X-ray (mean [SD])
  Number. of vertebra                                             2.46 (1.07)                        2.32 (1.16)                    0.523
  AVH loss (%)                                                   43.45 (18.90)                      37.02 (21.22)                    0.8
  Kyphosis (°)                                                   26.92 (12.67)                      21.72 (11.89)                   0.032
MRI (n, [%])
  Loss of anterior CSF                                       31/44 (70.5%)                          7/31 (22.5%)
S. Mittal et al.: SICOT-J 2021, 7, 7                                                        5

Table 2. Univariate analysis.
Possible risk factors                          Crude odds ratio                        95% confidence interval                          P-value
Age                                                 1.03                                     1.00–1.06                                   0.07
Sex (%)                                             1.22                                     0.47–3.17                                  0.682
Location                                                                                                                                 0.14
  Cervical
  Dorsal                                              2.95                                    0.66–13.13                                0.155
  Dorsolumbar                                         1.17                                     0.26–5.24                                0.841
Type of involvement                                                                                                                      0.37
  Anterior
  Central                                             0.53                                     0.06–4.9                                 0.58
  Panvertebral                                         2.7                                    0.27–25.63                                0.39
  Paradiscal                                           2.6                                    0.52–12.85                                0.24
  Posterior                                          0.001                                      0.00–inf                                0.99
  Posterior element                                   1.45                                     0.25–8.46                                0.68
  Compression                                        >1000                                      0.00–inf                                0.99
X-ray
  No. of vertebrae                                   1.07                                      0.73–1.56                                0.722
  AVH loss                                           1.024                                     0.99–1.05                                 0.06
  Kyphosis > 30°                                     2.68                                      1.009–7.1                                 0.04
MRI
  Loss of anterior CSF                               6.86                                     2.44–19.26                                0.001
  Loss of posterior CSF                               2.2                                     0.22–22.15                                0.505
  Cord oedema                                        11.25                                    1.38–91.86                                0.024
  Canal encroachment                                 1.06                                      1.03–1.09                                0.001

Bold values represent p-values that are significant (p < 0.05).

Figure 4. Receiver operating characteristic (ROC) curve to find the threshold value of canal encroachment above which it had the maximum
association with neurological deficit. Y-axis (sensitivity) represents true positive while X-axis (1-specificity) represents false positives. The
threshold value is represented by red dot.

epidural abscess to be associated with neurological deficit.              disease was more commonly associated with neurological
A significant difference was reported between the two groups              deficit group (p – 0.002).
in the location of vertebrae involved and spinal compression                 Multivariate logistic regression analysis in our study
by Wang and Yang [13]. In our study, mean kyphosis, AVH                  revealed that kyphosis > 30°, cord oedema, and canal encroach-
loss, and canal encroachment were higher in the neurological             ment, which also implies a degree of spinal canal compression,
deficit group. Cord oedema was observed in MRI of 13 patients,            as independent risk factors for predicting neurological deficit in
12 of them had a complete neurological deficit (ASIA grade A)             patients with spine TB. Compared to previous studies (Table 4),
while one patient had intact neurology. Thoracic location of             Wang et al. in a retrospective study of 329 patients with spine
6                                                    S. Mittal et al.: SICOT-J 2021, 7, 7

Table 3. Multivariate analysis including showing Kyphosis > 30°, canal encroachment (>50%) and Cord oedema as independent risk factors
associated with neurological deficit B – unstandardized beta, SE – standard error of regression, Wald- type of statistic used in logistic
regression analysis, df – degrees of freedom, Sig. – significance value, Exp(B) – odds ratio, CI – confidence interval.
                                           B                 SE           Wald          df           Sig.           Exp (B)      95% CI for Exp (B)
                                                                                                                                Lower        Upper
Step 1
  Canal encroachment > 50%               2.037            .532           14.657         1            .000            7.667      2.702        21.751
  Constant                                 .651           .356           3.338          1            .068             .522
Step 2
  Canal Encroachment > 50%               1.919             .551          12.125         1            .000            6.817      2.314        20.083
  Oedema                                 2.174            1.118          3.781          1            .052            8.797       .983        78.736
  Constant                                 .843            .380          4.929          1            .026             .430
Step 3
  Canal encroachment > 50%               1.994             .586          11.554         1            .001           7.342       2.326        23.175
  Oedema                                 2.480            1.152          4.635          1            .031           11.935      1.249       114.054
  Kyphosis > 30°                         1.367             .600          5.198          1            .023           3.924       1.211        12.711
  Constant                                1.485            .508          8.529          1            .003            .227

Bold values in Table 3 represent Odds ratio of variables that are significant.

Figure 5. A 42-year-old female diagnosed as case of Potts spine D9–D10 with neurological deficit. (a) X-ray AP and (b) lateral view showing
fuzziness of end plates of D9–D10 with kyphosis of 16° measured using cobs method. (c) MRI sagittal T2WI, (d) sagittal T1WI, (e) axial
T2WI, (f) axial T1WI showing paradiscal involvement of D9–D10 vertebral bodies with endplate destruction and altered marrow signal
intensity, prevertebral and epidural collection causing loss of anterior CSF around cord and cord compression.

Table 4. Comparison of studies in literature predicting neurological deficit in TB spine.
                                                                                            Predictors of neurological deficit
                                Study             No. of                                                    Odds         95% confidence       P-value
Authors            Year         design            patients                                                  ratio            interval
Wang and           2016     Retrospective           329                        Age                          1.761         1.227–2.526        0.002
 Yang [13]                      study                                Worsening of sickness                  1.910         1.161–3.141        0.011
                                                                  Location (thoracic vs. cervical)          0.204         0.063–0.662        0.008
                                                                       Spinal compression                   1.672         1.020–2.741        0.042
Singh et al.       2019      Prospective            40                  Cord compression                    14.67         1.09–197.96        0.043
  [14]                          study                                      Cord oedema                      21.42         1.68–272.72        0.018
Sae-Jung           2019     Retrospective           125                 Cobbs angle > 30                    2.62            1.03–6.67         0.04
  et al. [15]                   study                                   Signal cord change                  3.31            1.50–7.3         0.003
Our study          2020     Retrospective           105                   Kyphosis > 30°                    3.92            1.21–12.7        0.023
                                study                              Canal encroachment > 50%                 7.34           2.32–23.17        0.001
                                                                           Cord oedema                      11.93         1.24–114.05         0.03
S. Mittal et al.: SICOT-J 2021, 7, 7 7
TB reported age (elderly), worsening of sickness, location Authors contribution
(cervical or lumbar vertebrae), and spinal compression as
predictive risk factors of Lower extremity motor or sensory 1. Conceptualization: Dr. Pankaj kandwal.
deficit [13]. Age and location of disease came out to be predic- 2. Methodology: Dr. Pankaj Kandwal, Dr. Samarth Mittal,
tors in univariate analysis in our study but they were not found Dr. Bhaskar Sarkar.
as independent risk factors in multivariate analysis. Moreover, 3. Formal analysis: Dr. Samarth Mittal, Dr. Gagandeep,
the dorsal location of the disease was more commonly associ- Dr. Kaustubh Ahuja, Dr. Syed Ifthekar.
ated with a deficit in our study as compared to cervical or 4. Writing – original draft: Dr. Samarth Mittal,
lumbar vertebrae. Singh et al. [14] in their study on 40 TB spine Dr. Gagandeep.
patients with neural deficit found cord oedema and cord 5. Writing – review and editing: Dr. Pankaj Kandwal,
compression as predictive risk factors. Sae-Jung et al. [15] Dr. Samarth Mittal, Dr. Bhaskar Sarkar, Dr. Kaustabh
identified signal cord change (OR – 3.31) and notable cobbs Ahuja.
angle (>30°) (OR – 2.62) as predictive factors for neurological
deterioration in his study of 125 patients with spine TB.
The clinical importance of findings observed in our study is Conflict of interest
that patients with spinal tuberculosis should undergo MRI of the
spine at the earliest to look for the location of disease, vertebral All authors certify that they have no affiliations with or
body destruction, kyphosis, cord compression, CSF anterior to involvement in any organization or entity with any financial
the cord, cord signal changes as all these findings are interest (such as honoraria; educational grants; participation in
significantly associated with neurological deficit in patients with speakers’ bureaus; membership, employment, consultancies,
spine TB. Kyphosis > 30°, cord oedema, and canal encroach- stock ownership, or other equity interest; and expert testimony
ment > 50% are important predictors of neurological deficit as or patent-licensing arrangements), or non-financial interest
evident by our study, hence should always be accounted for (such as personal or professional relationships, affiliations,
while planning management for a spine tuberculosis case. Cord knowledge or beliefs) in the subject matter or materials
oedema had the highest odds for neurological deficit among discussed in this manuscript.
three predictors. The odds for developing neurological deficit
are 12 times higher in patients presenting with cord oedema.
Patients with kyphosis > 30° have a 3.9 times risk of developing References
neural deficit than those who present with cobs angle < 30°. Risk
estimates of developing neural deficit are 7.3 times higher in 1. Jain AK (2010) Tuberculosis of the spine. J Bone Jt Surg Br
patients having canal compromise of more than 50%. 92-B, 905–913.
2. World Health Organization (2019) Global tuberculosis report
2019. Retrieved from https://www.who.int/tb/publications/
Conclusion global_report.
Tuberculosis of the spine is a medical disease with reserved 3. Kamal AM, El-Sharkawi MM, El-Sabrout M, Hassan MG (2020)
Spondylodiscitis: Experience of surgical management of compli-
indications for surgery, but identifying risk factors beforehand
cated cases after failed antibiotic treatment. SICOT-J 6, 5.
can help doctors to take a decision for early surgery to prevent
4. Jain AK, Kumar J (2013) Tuberculosis of spine: Neurological
morbidity due to neurological deficit. Hence, planning the deficit. Eur Spine J 22, 624–633.
management of spine tuberculosis case warrants attention
5. Jain AK (2002) Treatment of tuberculosis of the spine with
towards the presence of cord oedema, kyphosis more than neurologic complications. Clin Orthop Relat ResÒ 398, 75–84.
30°, and degree of canal compromise or canal encroachment 6. Seddon HJ (1935) Pott’s paraplegia: Prognosis and treatment.
as they are independent predictors of neurological deficit in case Br J Surg 22, 769–799.
of tuberculosis of the spine. 7. Hodgson AR, Skinsnes OK, Leong CY (1967) The pathogen-
esis of Pott’s paraplegia. JBJS 49, 1147–1156.
Declarations 8. Jain AK, Aggarwal A, Mehrotra G (1999) Correlation of canal
encroachment with neurological deficit in tuberculosis of the
Funding spine. Int Orthop 23, 85–86.
9. Dunn R, Zondagh I, Candy S (2011) Spinal tuberculosis:
None. Magnetic resonance imaging and neurological impairment.
Spine 36, 469–473.
Avaliablity of data and material 10. Jain AK, Jena A, Dhammi IK (2000) Correlation of clinical
course with magnetic resonance imaging in tuberculous
The datasets generated and/or analysed during the current myelopathy. Neurol India 48, 132–139.
study are available from the corresponding author on reasonable 11. Gupta AK, Kumar C, Kumar P, et al. (2014) Correlation
request. between neurological recovery and magnetic resonance imaging
in Pott’s paraplegia. Indian J Orthop 48, 366–373.
Code availabilty 12. Jain N, Saini NS, Kumar S, et al. (2016) Correlation of diffusion
tensor imaging parameters with neural status in Pott’s spine.
Not applicable. SICOT-J 2, 21.8 S. Mittal et al.: SICOT-J 2021, 7, 7
13. Wang H, Yang X (2016) Early predictive factors for lower- 20. Concato J, Feinstein AR, Holford TR (1993) The risk of
extremity motor or sensory deficits and surgical results of determining risk with multivariable models. Ann Intern Med
patients with spinal tuberculosis: A retrospective study of 329 118, 201–210.
patients. Medicine 95, e4523. 21. Rajasekaran S, Soundararajan DCR, Shetty AP, Kanna RM
14. Singh V, Zafar N, Paliwal V, et al. (2020) Correlation of MRI (2018) Spinal tuberculosis: Current concepts. Glob Spine J 8,
findings with neurological deficit in spinal tuberculosis. Int J 96S–108S.
Recent Sci Res 10, 36561–36565. 22. Dobson J (1951) Tuberculosis of the spine. J Bone Jt Surg Br
15. Sae-Jung S, Wongba N, Leurmprasert K (2019) Predictive 33, 517–531.
factors for neurological deficit in patients with spinal tubercu- 23. Jain AK, Sreenivasan R, Saini NS, et al. (2012) Magnetic
losis. J Orthop Surg 27, 2309499019868813. resonance evaluation of tubercular lesion in spine. Int Orthop
16. Kirshblum SC, Burns SP, Biering-Sorensen F, et al. 36, 261–269.
(2011) International standards for neurological classification of 24. Pertuiset E, Beaudreuil J, Lioté F, et al. (1999) Spinal
spinal cord injury (revised 2011). J Spinal Cord Med 34, tuberculosis in adults. A study of 103 cases in a developed
535–546. country, 1980–1994. Medicine 78, 309–320.
17. Jain AK, Aggarwal PK, Arora A, Singh S (2004) Behaviour 25. Rasouli MR, Mirkoohi M, Vaccaro AR, et al. (2012) Spinal
of the kyphotic angle in spinal tuberculosis. Int Orthop 28, tuberculosis: Diagnosis and management. Asian Spine J 6, 294.
110–114. 26. Kiran NAS, Vaishya S, Kale SS, et al. (2007) Surgical results in
18. Porto AB, Okazaki VHA (2017) Procedures of assessment on patients with tuberculosis of the spine and severe lower-
the quantification of thoracic kyphosis and lumbar lordosis by extremity motor deficits: A retrospective study of 48 patients.
radiography and photogrammetry: A literature review. J Body- J Neurosurg: Spine 6, 320–326.
work Movement Ther 21, 986–994. 27. Subhadrabandhu T, Laohacharoensombat W, Keorochana S
19. Rajasekaran S (2012) Kyphotic deformity in spinal tuberculosis (1992) Risk factors for neural deficit in spinal tuberculosis.
and its management. Int Orthop 36, 359–365. J Med Assoc Thailand = Chotmaihet Thangphaet 75, 453–461.
Cite this article as: Mittal S, Yadav G, Ahuja K, Ifthekar S, Sarkar B & Kandwal P (2021) Predicting neurological deficit in patients with
spinal tuberculosis – A single-center retrospective case-control study. SICOT-J 7, 7You can also read