Rip Current Awareness & Knowledge
←
→
Page content transcription
If your browser does not render page correctly, please read the page content below
Rip Current Awareness & Knowledge
              A Study of What Beachgoers know about Rip Currents &
The Effectiveness of the NOAA, Sea Grant and LAA Outreach and Education Program

            A Study Conducted on Long Beach Island, New Jersey, 2006

                      By the “Rip Current Scienteers”
         (Lukas Brummer, Ricky Dunphey, Daniel Koppa, Korey Kubricki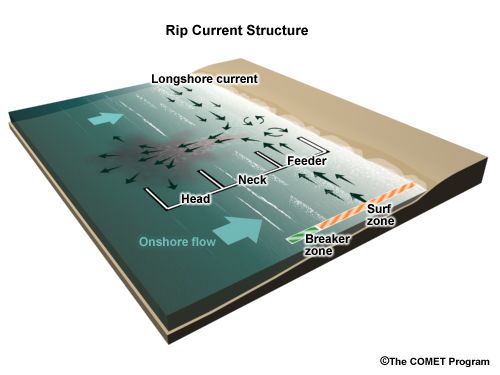
Rip Current Awareness & Knowledge
                A Study of What Beachgoers know about Rip Currents &
  The Effectiveness of the NOAA, Sea Grant and LAA Outreach and Education Program

                A Study Conducted on Long Beach Island, New Jersey, 2007

                          By the “Rip Current Scienteers”
             (Lukas Brummer, Ricky Dunphey, Daniel Koppa, Korey Kubricki

                                      Abstract
        Rip currents are defined as a strong current of water flowing away from the
shoreline. Reports show that over 80 percent of water rescues are attributed to these
dangerous currents (United States Lifesaving Association, 2005). This is a growing
problem, since over 180 million Americans visit coastal communities each year. In this
study, beach goers in Long Beach Island, New Jersey completed a survey, which tested
their knowledge and awareness of rip currents. Twelve hundred surveys were distributed
throughout the day during the summer months of June, July and August of 2007 in all six
municipalities on Long Beach Island. The results from this study will indicate whether
the National Oceanic and Atmospheric Administration’s (NOAA), Sea Grant and the
United States Lifesaving Association (USLA) “Awareness Campaign” has had been
successful as an effective outreach program. It will also provide insight into what areas
of rip current awareness and knowledge need to be emphasized in future rip current
outreach efforts.

                                      Introduction
       The National Oceanic and Atmospheric Administration (NOAA) Office of Ocean

and Coastal Resource Management estimates that over 180 million Americans visit

coastal communities each year. This dramatic influx of people increases the chances of

drowning while swimming in the ocean. While there are many dangers of swimming in

the ocean, rip currents pose one of the most deadly threats (Figure 1). These powerful

channelized currents of water pull swimmers away from shore and often result in

drowning.
Figure 1.      A Diagram of a Rip Current.

Notice the flow of water away from the shoreline.

Source: Nearshore Fundamentals, http://meted.ucar.edu/marine/ripcurrents/NSF/print.htm

        This report is the first that describes the effectiveness of a rip current national

outreach campaign instituted by NOAA’s National Weather Service, the National Sea

Grant Program and the United States Lifesaving Association to inform the public of rip

current dangers. Through the efforts of these organizations, safety signs and brochures

were provided to local towns and municipalities throughout New Jersey and the United

States. Has the information reached the public? What does the average beachgoer

know about rip currents? What still needs to be done in educating the public? These are

the important questions, which this report hopes to address and provide some valuable

insights.
Methodology
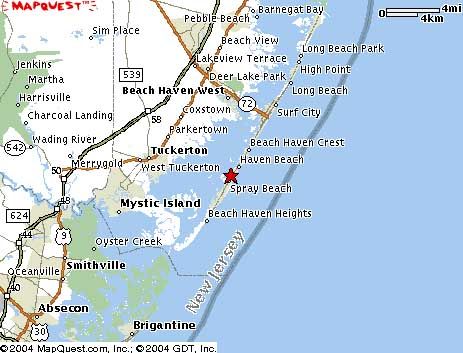
Survey Location: Long Beach Island, New Jersey
Figure 2. This is a map of Long Beach Island (LBI).
Source: Provided by Mapquest.com
Long Beach Island is an 18-mile barrier island that is home to six municipalities.
The southern tier of Long Beach Island stretches 11 miles, from Ship Bottom to Beach
Haven Inlet and consists of three municipalities: Long Beach Township, Ship Bottom,
and Beach Haven. The northern tier stretches 7 miles from Surf City to Barnegat Light
and consists of three additional municipalities: Surf City, Harvey Cedars, Barnegat
Light, as well as portions of Long Beach Township. Its largest municipality, LongBeach Township, is fragmented into four sections. You cannot get from Barnegat Light to Harvey Cedars in the north without going through Long Beach Township, and you cannot get from Ship Bottom to Beach Haven in the south without going through….…yep, Long Beach Township. Covering 12 miles, or two-thirds of LBI, Long Beach Township is the largest of the six municipalities on LBI. Long Beach Island is the longest lifeguard protected beach in the United States. All municipalities on the Island were provided with rip current beach safety signs and brochures through the outreach campaign instituted by NOAA’s National Weather Service, the National Sea Grant Program and the United States Lifesaving Association. Of the six municipalities, Long Beach Township chose not to place the signs on the beaches and decided to produce their own brochure to distribute to the public. Sampling Method and Sample Size: Data for the study was obtained using a stratified-cluster sampling technique. Twelve hundred individuals were surveyed during the months of June, July, and August. Four hundred surveys were administered each month at various times of the day and at various locations in all six municipalities. After administering the questionnaire, the members of the “Rip Current Scienteers” provided each person surveyed with a rip current brochure. The brochures were obtained from contacts made with NOAA and Sea Grant rip current researchers and personnel. While the sample does not constitute an area probability sample for the island, it does provide a representative sample of those visiting LBI during the summer 2007 season and more than adequately represents beachgoer’s
locations on the island. The following tables provide an overview of where and when

the survey was administered.

Table A: Month of Survey:
June                   July                                 August
400                    400                                  400
33.33%                 33.33%                               33.33%

Table B: Time of Day Survey Administered:
Morning                Afternoon                            Evening
293                    828                                  79
24%                    69%                                  7%

Table C: Place of Survey on Long Beach Island:
Barnegat Beach          Harvey     Long                     Ship           Surf City
Light       Haven       Cedars     Beach                    Bottom
                                   Twp.
181         294         100        298                      113            214
15%         24%         8%         25%                      10%            18%

Based on the scientific sampling method that was employed in the study, the overall

sampling error for the study is less than 3%. See Appendix D for a more detailed

explanation and determination of the margin of error.
Measurement Instrument: Questionnaire Design
The questionnaire was developed after extensive research on rip currents and after careful
consideration of what information was crucial for the safety of beachgoers.
The survey consisted of 20 questions, which measured demographics, behaviors, and
knowledge of the simple facts concerning rip current safety as well as information on the
exposure to rip current beach signs and brochures. Appendix A contains the
questionnaire that was used to collect the data for the study.
Major Findings
Though an extensive amount of data was collected during the study, the findings
presented here focuses on effectiveness of the outreach campaign of providing rip current
signs and brochures to beach towns along the Jersey Shore as well as the identification of
what those surveyed knew and did not know about rip currents. Appendix B contains
simple summary results for the questions while Appendix C contains additional graphs
and tables that provide supplementary information.
Awareness Brochure Effectiveness
The number of people who indicated that they had received a rip current
awareness brochure is shown in Graph 1. The majority of beach goers (86%) did not
obtain a brochure. This is of great concern and clearly expresses the inability to get the
brochures to the public. Graph 1 also shows how and where the brochures were obtained.Graph 1: Percentage of those who had or had not previously received a rip current
brochure.
Have you received any rip current materials
such as a brochure?
5%
NO, 86%
3%
6%
No Yes, Bought Badge
Yes, Local Business Yes, Other
Note: The survey consisted of n=1200 participants, however, this data was obtained from n=1192 as eight
respondents failed to answer this question.
Sampling Error = +/- 3%
According to the graph, it can be seen that an
overwhelming majority (86%) of the public going to LBI
beaches have not received any brochures or materials about
rip current safety. Of the people that did receive safety
information, most of them received it upon buying their
badge. Most of the public attending LBI beaches did not
have either access to safety brochures or the material and
brochures were not placed in locations where most of the
public would see and take one.Safety Sign Awareness
The outreach campaign also consisted of posted signs at beach entrances or lifeguard
signs. The effectiveness of this approach is displayed in Graph 2.
Graph 2: Percentage of those who had or had not previously seen a Rip Current
Safety Sign:
Have you seen any rip current safety
signs on Long Beach Island?
13% 1%
NO: 63%
23%
No Yes, at Beach Entrance
Yes, at Lifeguard Stand Yes, Other
Note: The survey consisted of n=1200 participants, however, this data was obtained from n=1185
as 15 people failed to respond to this question.
According to the graph, 63% of those surveyed did not
see a rip current sign as they entered the beach or on the
beach. It is not surprising that most have not. It is not
mandatory for safety signs to be posted at all locations.
Furthermore, Long Beach Township, which accounts for 12
miles or about 66% of the shoreline, has refused to post
any signs on its beaches. In addition, the placement of
signs, and brush overgrowth have made many signs hard to
spot. Missing and stolen signs has also reduced the numberThe Effectiveness of Safety Signs and/or Brochures
While it appears that posting safety signs has been more effective than providing rip
current safety brochures, the impact of providing both can be seen from Table D and
Table E.
Table D:
Those who Received Brochures and/or saw posted Safety Signs: Counts
Brochures
NO YES TOTAL
Safety Signs NO 670 82 752
YES 345 87 432
TOTAL 1015 169 1184
Table E:
Those who Received Brochures and/or saw posted Safety Signs: %
Brochures
NO YES TOTAL
Safety Signs NO 57% 7% 64%
YES 29% 7% 36%
TOTAL 86% 14% 100%
Note: The survey consisted of n=1200 participants, however, this data was obtained from n=1184
as 16 people failed to respond to both questions.
According to the tables out of the 1184 people who
answered both questions, 57% of the respondents neither
received a brochure nor saw a safety sign. Only 7% had
seen a sign and received a brochure. This suggests that
there is still a lot of work to be done in getting the
information out to the general public about the dangers of
rip currents.Knowledge and Rip Currents
The survey consisted of 10 general information questions that dealt with various aspects
of rip current knowledge. Table F and Graph 3 provide a visual summary
Table F & Graph 3: Illustration of Summary of Percent with Correct Response
Knowledge Question % Who Answered Correctly
Q11. What is a rip current? 71%
Q12. What is a sure sign that a rip current is 51%
underway?
Q13. If caught in a rip current, you should…… 24%
Q14. When do rip currents occur? 73%
Q15. In the US, rip currents cause this number 40%
of deaths.
Q16. Rip currents account for what percent of 26%
lifeguard or beach rescues?
Q17. Rip currents can last for a maximum of 21%
how long?
Q18. What should you do if you see someone 73%
caught in a rip current?
Q19. In New Jersey, rip currents kill more 82%
people every year than?
Q20. Rip currents do what? 41%
Percent who correctly answered Survey Question
100
81
80 71 73 74 %
% % %
% 60 51
% 40 41
40 % %
24 26
21
20 % %
%
0
1 1 1 1 1 1 1 1 1 2
1 2 3 4 5 6 7 8 9 0
Question NumberTable F suggests the following:
There were some questions where a majority of those
surveyed was able to identify the correct answer.
There were some questions where the percentage of
people who identified the correct answer was
considerably under a majority.
It is unclear whether these differences can be attributed to the
difficulty of the questions. It is possible that the answers to
some questions were more obvious and therefore a higher
percentage of people provided the correct response just by
logical guessing.
It can be seen that the overall knowledge that the public
possesses about rip currents is inconsistent. It is not as
important that the public know some of the facts such as how many
rip current deaths occur annually or that rip currents kill more
people in NJ than hurricanes, tornadoes and lightning combined.
However, it is extremely important that they are aware of and can
recognize when a rip current is present, that they know what to
do if caught in a rip current and that they know what do if
someone else is caught in a rip current. The fact that 3 out 4
of those surveyed do not know what to do if caught in a rip
current and that almost half of those surveyed believe that rip
currents pull you under the water is problematic.
Overall, there is strong evidence to suggest that the job of
educating the public on rip current dangers still needs greater
outreach effort.
A question-by-question tabular summary is provided in Appendix B and additional
graphs are provided in Appendix C. These provide a detailed picture and explanation of
the survey responses for the study, which have also been referred to in the following
summary section.Summary Remarks The survey revealed that 63% of these people have not seen any of the warning signs that were posted at the entrances to the beaches, on the back of lifeguard stands, on flags by the water or on rental units. The brochures and other rip current awareness materials were ineffective; people simply did not receive them. A high percentage of people did not receive any awareness materials: 71% of the people from Long Beach Island; 90% of the people from other towns in New Jersey, 80% of the people from Ocean County; and 88% of the people from out of state. Yes, the majority of the people surveyed are in danger. They were asked what activities they do while at the beach. They were given the choices of: sun bathing; reading; playing games or playing in the sand; wading in the ocean; playing a water sport; swimming; sleeping; and ‘other.’ The survey indicates that 90% of the people who responded enjoy at least one activity that involves being in the ocean. Since they are in the ocean, they are in danger. But to what extent are they in danger?
Many of the people surveyed who are in the ocean while at the
beach minimize the danger they are in by swimming with
lifeguards present. Only 2% indicated that they swim while
there is never a lifeguard present; and 57% said that there is
always a lifeguard present while they swim. However, just
because lifeguards are present does not mean that you are not
at risk of being caught in or drowned by a rip current. How
much do people know about rip currents? Can they save
themselves if a lifeguard cannot get there in time?

The survey asked “if caught in a rip current, you should (check
all that apply).” The possible answers were: “A,” stay calm;
“B,” float, tread water or swim out of the current; “C,” relax
and swim towards the shore; and “D,” call or signal for help.
The correct answers are “A,” “B” and “D”. Only 24% of the
people surveyed answered the question completely correct.
This means that many people are not completely sure what to
do to save themselves if they are caught in a rip current.

 56% of the people surveyed listed the correct way; letter “B,”
to swim out of the current as one of their answers.

17% of the people surveyed listed the wrong way, letter “C,”
to swim toward the shore.

11% of the people surveyed answered both the correct and
incorrect way to swim out of a rip current as one of their
answers; meaning that they are not sure and are subject to
danger.
But what about helping someone else caught in a rip current?

The survey asked, “What would you do if you see someone
caught in a rip current or struggling in the water?” The correct
answer was letter “E”, (B) call for help and (C) throw a flotation
device. 74% of the people answered the question completely
correct (answering with letter “E”), while another 3% answered
the question partially correct (answering with either letter “B”
or “C”).

Many people know how to save someone else that is caught in
a current, but would struggle to save themselves if they were
caught in a current. Since there is not a lot of knowledge about
how to react while caught in the current, how many people can
recognize that a rip current may be present before they get in
the water?

Letter “E” says “all of the above or none of the above,” With
that in mind, it can be said that 49% of the people are not able
to recognize all the signs of a rip current that may be present.

It is unclear what percentage of the 51% of the people that
answered “E” meant “all of the above” or meant “none of the
above.”
This study set out to find the effectiveness of a rip current national outreach

campaign instituted by NOAA’s National Weather Service, the National Sea Grant

Program and the United States Lifesaving Association to inform the public of rip current

dangers.   The effectiveness of the campaign could have been measured by examining

the change in public awareness and knowledge before and after the campaign. Since

there is no data for the publics’ general rip current knowledge before the NOAA’s study,

a comparison of this nature could not be done.

       The study clearly shows that the message did not reach the public. This is evident

in the large number of people who did not receive a brochure. The results of this study

suggest that new strategies for informing the public about rip currents need to be in place.

The present data also suggest that there is a need to inform the public about the dangers

of rip currents, and in doing so, heighten swimmers’ awareness in identifying their

presence and ways of escaping the current if caught in one. Peoples’ conscious

awareness of rip currents will help them swim in safe areas and give them the tools they

need if they find themselves in a rip current. Continued outreach efforts are clearly

needed in order to get a “Grip on the Rip”.
APPENDIX A: Rip Current Survey Questionnaire
RIP CURRENT AWARENESS SURVEY
We need your help to save lives. We are an Ecybermission research team, and we are doing a study of Rip
Currents. Part of our study deals with rip current awareness. If you can take a few minutes to check off the
answers to this survey, it would provide us with valuable information for our study. Thank you for your
cooperation.
Rip Current Research Team: Lukas Brummer, Daniel Koppa, Ricky Dunphey, Korey Kubricki
Question #1: What is your gender:
◘ a) Male
◘ b) Female
Question #2: What is your age category
◘ a) 13 to 18
◘ b) 19 to 29
◘ c) 30 to 44
◘ d) 45 to 59
◘ e) 60 and over
Question #3: Where do you live?
◘ a) Long Beach Island
◘ b) Ocean County
◘ c) New Jersey
◘ d) Out of State
Question #4: What is your Educational Level
◘ a) Middle School
◘ b) High School
◘ c) High School Graduate
◘ d) Some College
◘ e) College Graduate
◘ f) Post Graduate
Question #5: How Often do you go to the Beach?
◘ a) rarely
◘ b) a few times a month
◘ c) a few times a week
◘ d) other: _____________________Question #6: Which Activities do you do while at the beach? (Check all that apply) ◘ a) sun bathe ◘ b) read ◘ c) play games or play in the sand ◘ d) wade in the ocean ◘ e) water sport ◘ f) swimming ◘ g) sleeping ◘ h) other: ___________________ Question #7: Are you a ◘ a) Strong swimmer ◘ b) Average swimmer ◘ c) Beginning swimmer ◘ d) Can't swim at all Question #8: Are lifeguards present when you swim? ◘ a) always ◘ b) sometimes ◘ c) never Question #9: Have you seen any rip current safety signs on Long Beach Island? ◘ a) No ◘ b) Yes, as I entered the beach ◘ c) Yes, on the Lifeguard stand ◘ d) Yes, other: _____________________ Question #10: Have you received any rip current awareness materials such as a brochure? ◘ a) No ◘ b) Yes, when I bought my badge ◘ c) Yes, from the town municipal office ◘ d) Yes, from a local business establishment ◘ e) Yes, other: ____________________ Question #11: A rip current is ◘ a) the same as a rip tide ◘ b) the same as an undertow ◘ c) a powerful current of water moving toward the shore ◘ d) a powerful current of water moving away from the shore Question #12: What is a sure sign that a rip current is underway? ◘ a) A line of foam, seaweed, or debris moving steadily seaward ◘ b) A break in the incoming wave pattern ◘ c) A channel of churning, choppy water ◘ d) An area having a notable difference in water color ◘ e) All of the above or none of the above
Question #13: If caught in a rip current, you should (check all that apply)
◘ a) Stay calm
◘    b) Float, tread water or swim out of the current
◘    c) Relax and swim towards the shore
◘    d) Call or signal for help

Question #14: Rip currents
◘ a) Occur every day on many beaches
◘    b) Occur only during high tide
◘    c) Occur only during low tide
◘    d) Occur only after major storms at sea

Question #15: In the United States, rip currents cause
◘ a) under 100 drownings per year
◘    b) between 100 and 200 drownings per year
◘    c) Between 200-500 drownings per year
◘    d) Over 500 drownings per year

Question #16: Rip currents account for what % of lifeguard or beach rescues?
◘ a) 20%
◘    b) 40%
◘    c) 60%
◘    d) 80%

Question #17: Rip currents can last for a maximum of
◘ a) One hour
◘    b) One Day
◘    c) One Week
◘    d) Several Months

Question #18:  What would you do if you see someone caught in a rip current or struggling in the water?
◘ a) Go in after them
◘    b) Call for help
◘    c) Throw a life saving device to them
◘    d) Both a and b
◘    e) Both b and c

Question #19: In New Jersey, rip currents kill more people every year than
◘ a) Hurricanes
◘    b) Tornadoes
◘    c) Lightning
◘    d) All of the above
Question #20: Rip Currents
     ◘ a) Pull people under the water
     ◘   b) Pull people away from the shore
     ◘   c) Pull people away from the shore and under the water
     ◘   d) None of the above

Administered by: _____________________________ Date: _____________

           Time: ___________             Location: ________________________
APPENDIX B: SUMMARY TABLE RESULTS
Percentage Results for
Survey Questions
Demographic Questions
Question 1: What is your gender?
Male 37%
Female 63%
Question 2: What is your age category?
13 to 18 14%
19 to 29 16%
30 to 44 26%
45 to 59 31%
60 and over 13%
Question 3: Where do you live?
Long Beach Island 9%
Ocean County 18%
New Jersey 40%
Out of State 33%
Question 4: What is your Education Level?
Middle School 3%
High School 13%
High School Graduate 12%
Some College 23%
College Graduate 29%
Post Graduate 20%Question 5: How often do you go to the Beach?
Rarely 19%
A few times a month 31%
A few times a week 26%
Other 24%
Other includes such responses as “All Summer, Once a Year, Twice a Year…. This
question could have had better categorical choices.
Question 6: Which Activities do you do while at the Beach?
Activities that involve being in the Ocean 91%
Activities not involved with being in the Ocean 09%
91% of those who go to the beach engage in some sort of water activity which puts them
in danger of being exposed to a Rip Current.
Safety Awareness Questions
Question 7: How strong of a swimmer would you consider yourself to be?
Strong swimmer 27%
Average swimmer 62%
Beginning swimmer 8%
I cant swim at all 3%
Question 8: Are lifeguards present when you swim?
Always 57%
Sometimes 41%
Never 2%Question 9: Have you seen any rip current safety signs on or near the beach?
No 63%
Yes, as I entered the beach 23%
Yes, on the lifeguard stand 13%
Yes, other** 1%
**other includes in rental unit, and on flags
Question 10: Have you received any rip current awareness materials such as a
brochure?
No 86%
Yes, when I bought my badge 6%
Yes, from the town municipal office 2%
Yes, from a local business establishment 3%
Yes, other** 3%
**other includes from a boy scout, from a friend, in Australia, from parents, lifeguard
training, newspaper article, school, and TV report
Rip Current Knowledge Questions
Question 11: A rip current is….
The same as a rip tide 11%
The same as an undertow 9%
A powerful current of water moving toward the shore 9%
A powerful current of water moving away from the shore 71%
Correct Answer: A powerful current of water moving away from the shoreQuestion 12: What is a sure sign that a rip current is underway? A line of foam, seaweed or debris moving steadily seaward 9% A break in the incoming wave pattern 17% A channel of churning, choppy water 18% An area having a notable difference in water color 5% All of the above or none of the above 51% Correct Answer: All of the above or none of the above: Question 13: If caught in a rip current, you should…..(check all that apply) Stay clam 13% Float, tread water or swim out of the current 13% Relax and swim towards the shore 5% Call or signal for help 9% Some combination of the above listed answers 60% Question 14: Rip currents occur….. Occur every day on many beaches 73% Occur only during high tide 9% Occur only during low tide 3% Occur only after major storms at sea 14% Correct Answer: Occur every day on many beaches Question 15: In the United States, rip currents cause how many drownings per year? Under 100 drownings per year 19% Between 100 and 200 drownings per year 40% Between 200-50 drownings per year 26% Over 500 drownings per year 15% Correct Answer: Between 100 and 200 drownings per year.: Question 16: Rip currents account for what % of lifeguard or beach rescues? 20% of the rescues 8% 40% of the rescues 30% 60% of the rescues 36% 80% of the rescues 26% Correct Answer: 80% of the rescues
Question 17: Rip currents can last for a maximum of…

 One hour          22%
 One day           31%
 One week          26%
 Several months    21%
Correct Answer: Several months:

Question 18: What would you do if you see someone caught in a rip current or
struggling in the water?

 Go in after them                                1%
 Call for help                                   16%
 Throw a life saving device to them              3%
 Both A and B                                    7%
 Both B and C                                    73%
Correct Answer: Both B and C

Question 19: In New Jersey, rip currents kill more people every year than …..

 Hurricanes       5%
 Tornadoes        3%
 Lightning        10%
 All of the above 82%
Correct Answer: All of the above

Question 20: Rip currents do what?

 Pull people under the water                                      7%
 Pull people away from the shore                                  41%
 Pull people away from the shore and under the water              50%
 None of the above                                                2%
Correct Answer: Pull people away from the shore
APPENDIX C: GRAPHICAL SUMMARY RESULTS

                What is a Rip Current?

                                                                              11%

                                                                                                      9%

                                                                                                                9%

                71%

  same as a rip tide   same as an undertow   current of water moving toward shore   current of water moving away from shore

This pie chart indicates that an overwhelming 71% of
people surveyed know that a rip current is a powerful
current of water moving away from the shore. The
remaining people surveyed pretty much divided their
answers between the three other responses.
Signs of a Rip Current
Break in wave
channel of choppy water
difference in water color
line of foam
17% all or none of the above
52% 17%
5%
9%
This graph describes whether people know the signs
of a rip current. Over half of the people surveyed
answered this question correctly in saying that there
are multiple warning signs of a rip current, such as a
break the wave pattern, a channel of choppy water, a
difference in water color, and/or a line of foam
moving steadily seaward. All of the other people
surveyed knew at least one of the rip current warning
signs.When do Rip Currents Occur?
73%
80%
60%
40%
14% 10%
20% 3%
0%
everyday on beaches only at high tide
only after storms only at low tide
This bar graph is used to show how often rip currents
occur. Once again, an overwhelming 73% of people
surveyed correctly answered that rip currents occur
every day on many beaches. Fourteen percent of
people thought rip currents occur only after storms,
ten percent believe rip currents occur only at high
tide, and a low three percent think they occur at low
tide.Rip Current Drownings Per Year
Over 500
15%
Between 200 and 500
26%
40% Between 100 and 200
19% Under 100
0% 5% 10% 15% 20% 25% 30% 35% 40%
Percentages
This graph shows the number of deaths caused by rip
currents in the United States. 40% of people
surveyed correctly answered that rip currents kill
between 100 and 200 people per year. 15% believe
that rip currents kill over 500 people per year. 26%
believe that they kill between 200 and 500 people,
and 19% believe that they kill fewer than 100 people
per year.Number of Lifeguard Rescues
per Year Due to Lifeguards
8%
20 percent 26%
40 percent
60 percent 30%
80 percent
36%
Out of all the people surveyed, the largest percent of
people thought that rip currents account for 60% of
lifeguard or beach rescues. Only 26% knew that in fact
rip currents account for 80% of lifeguard rescues. 30%
of people surveyed thought the correct answer was
40% and only 8% thought that rip currents are the
cause of 20% of lifeguard or beach rescues.How Long Can Rip Currents Last
Several Months One Hour
21% 22%
One Hour
One Day
One Week
Several Months
One Week
26% One Day
31%
This graph shows how long rip currents can occur.
Only 21% of people surveyed answered this
question correctly by saying that rip currents can
occur for several months at a time, as opposed to
the other 79% that said they occur for one hour,
one day or one week at a time.What exactly do Rip Currents Do?
2% 7%
Pull under the
water
Pull away from
shore
50% 41%
Pull away and
under
None of the Above
This graph shows that half of the people surveyed
incorrectly think that a rip current pulls people away
from the shore and under the water. 41% of the
surveyed people answered correctly by saying rip
currents pull people away from the shore. 7% think it
pulls people under the water and 2% think rip currents
do something other than those three things.What do People do at the Beach?
Percent of the Total People Surveyed Whose Beach
Activities Involve being in the Ocean
90%
10%
Involves the Ocean
Does Not Involve the Ocean
Yes, the majority of the people surveyed are in danger.
They were asked what activities they do while at the
beach. They were given the choices of sun bathing;
reading; playing games or playing in the sand; wading in
the ocean; playing a water sport; swimming; sleeping; and
‘other.’ The survey indicates that 90% of the people who
responded enjoy at least one activity that involves being in
the ocean. Since they are in the ocean, they are in danger.
But to what extent are they in danger?Are Lifeguards Present?
Percent of all Swimmers Surveyed Who Swim With Lifeguards
Present
Always with a
Lifeguard Present
41%
Never with a
Lifeguard Present
57%
Sometimes with a
Lifeguard Present
2%
Many of the people surveyed who are in the ocean while at
the beach minimize the danger they are in by swimming
with lifeguards present. Only 2% indicated that they
swim while there is never a lifeguard present; and 57%
said that there is always a lifeguard present while they
swim. However, just because lifeguards are present does
not mean that you are not at risk of being caught in or
drowned by a rip current. Can they save themselves or
others if a lifeguard cannot get there in time?What if you are caught in a Rip?
19% 24 %
17%
13%
9%
5% 13%
a) Stay calm; b) float, tread water or swim
out of the current; d) call or signal for help
a) Stay calm
b) Float, tread water or swim out of the current
c) Relax and swim towards the shore
d) Call or signal for help
Answers containing c)
Other answer combinations
Only 24% of those surveyed selected the three things to do
when caught in a rip current. While some recognized one
of the things to do, 22% selected the answer or
combination of answers which said to “Relax and swim
towards the shore.” This is one of the major reasons of
why people die trying to fight against the force of the rip
current.What if someone is caught in a Rip?
What People Would Do If Someone Was Caught In A Rip Current
80%
E
70%
A = Go in
74% After Them
60%
B = Call for
Help
50%
C = Throw
40% Flotation
Device
30% D ( A and B) =
Go in After
them & Call for
Help
20%
D E (B and C) =
Call for Help &
A B C 7% Throw
10%
16% 1% 2%
0%
What about helping someone else caught in a rip current?
The survey asked, “What would you do if you see someone
caught in a rip current or struggling in the water?” The
correct answer was letter “E”, (B) call for help and (C)
throw a flotation device. 74% of the people answered the
question completely correct. 23% indicated that they
would go in after the person, which is the worst possible
thing to do.How good can they Swim?
Swimming Ability
Average Swimmer
100%
Strong Swimmer
80% 62%
60% Beginning Swimmer
26%
40%
8% Can't Swim at All
4%
20%
0%
While 88% of those surveyed indicated that they were
either an average or strong swimmer, even an Olympic
caliber swimmer would have difficulty escaping a strong rip
current. Being a strong or average swimmer can give a
person a false sense of security in trying to swim against
a rip current.How Deadly are Rip Currents?
In NJ, Rip Currents kill more than...
3%
10%
5%
82%
All of the Above Hurricanes Lighting Tornadoes
In New Jersey, rip currents kill more people than
hurricanes, lightning, and tornadoes combined.
Surprisingly, 82% of respondents were able to correctly
answer this question.While this information is not crucial in looking at rip
current knowledge or awareness, the following graphs
provide a summary of the demographic results from the
survey.
Gender
37% According to the data, a
Male
Female
majority of the
63% participants were female
Source: Rip Current Awareness Survey
Age Categories
13% 14% 13 to 18
16% 19 to 29
They ranged mostly in
30 to 44
between the ages of 45 31% 45 to 59
years old to 59 years old. 26% 60 and over
Source: Rip Current Awareness Survey400
P a r t ic ip a n t s
350
300
250
200
150
100
50
0
College
High Graduate
High School
M iddle School
Post School Graduate
Some Graduate
College
This chart illustrates the education level of the participants of the Rip Current
Survey. It is clear that most of the participants are educated individuals, with
35% high school graduate and some college, while 49% have graduated
and/or continued their post college educating.- - - - - - - - - - - - - P a r t ic ip a n t s
500
400
300
200
483
100 108 218 391
0
LBI
NJ
Ocean County
Out of State
----------------------------------------Residence
New Jersey, known for it’s popular ‘Jersey Shore,’ is home to 67% of all participants,
with only 33% living out of state.APPENDIX D:
Determination of Sampling Validity and Sampling Error
A common goal of survey research is to collect data representative of a population.
Sampling validity is required to insure that the sample represents the population of
interest for any study or survey. The population of interest for our study was summer
beachgoers to Long Beach Island, NJ. In order to insure the validity of the sample, a
multi-stage cluster- stratified sampling scheme was the method of choice. Multi-stage
sampling is where the researcher divides the population into strata, samples the strata,
then stratifies the samples, and then resamples, repeating the process until the ultimate
sampling units are selected .When the strata are geographic units, this method is
sometimes called cluster sampling.
The first stage of our sampling scheme was to divide LBI into cluster areas based on
the townships that are incorporated on the Island. Respondents were selected from
Barnegat Light, Beach Haven, Harvey Cedars, Long Beach Township, Ship Bottom and
Surf City. The number of individuals from each township was neither proportional to
their area or population but was selected in order to represent to the extent possible the
size of the beach going population in each township. Twelve hundred (n=1200) surveys
were collected in total. Four hundred surveys were collected in each of the summer
months. Additionally the time of day was used to stratify the sample further. While the
results of this study may not be extended to other beach areas of New Jersey or other
beaches on the East Coast, the results provided are representative for Long Beach Island,
the longest continuous beach area in New Jersey. It should be noted that it is common
practice to treat data from multi-stage cluster sampling as if it were randomly sampled
data.
Overall, multi-stage or cluster sampling is usually less precise than simple random
sampling, which in turn is less precise than one-stage stratified sampling. Since
multistage sampling is the most prevalent form for large, national surveys, and since most
computer programs use standard error algorithms based on the assumption of simple
random samples, the sampling error reported in this study may underestimate the exact
error of the study.
An approximate upper bound estimate of the sampling error is provided by the general
formula:
⎛ 1⎞
S.E. = ⎜ N ⎟ × 100
⎜ ⎟
⎝ ⎠
For a sample size of n = 1200 the corresponding calculation yields a SE of +/- 2.88%.A more exact formulation of the Sampling error for a random sample is provided by the formula: S. E. = (√ (p) * (1-p)/n) * 100 This estimate is dependent on the percent p that respond to a particular quantitative question. The below table shows the various sampling error estimates for the range of percent values that were obtained in this study. Sample Percentage Sampling Error for a sample of Size 1200 .10 or .90 Plus or minus 0.86% .20 or .80 Plus or minus 1.15% .30 or .70 Plus or minus 1.33% .40 or .60 Plus or minus 1.41% .50 Plus or minus 1.44% While these calculations again are based on a random sample, the multi-stage cluster stratified sample that was used will have a sampling error that does not differ much from these values. At the very worst, the sampling error should be no more than +/- 3%, and is likely to be considerably less.
APPENDIX E:

Acknowledgements and References:

Our team, the “Rip Current” Scienteers spent most of the summer, not only administering
this survey; but also researching and investigating rip currents. We had the privilege to
interview and meet with several individuals who are heavily involved with rip current
research and outreach. Through these contacts, we were able to learn a lot about rip
currents and what others are doing to help with this problem. Specifically, we would like
to thank the following to take the time to talk and visit with us and provide us with
important insights.

Dr. Wendy Carey, University of Delaware Sea Grant
James Eberwine, National Weather Service Office, Mount Holly
Dr. Stewart Farrell, Director, Coastal Research Center, Richard Stockton College
Dr. Thomas Herrington, NJ Sea Grant, Stevens Institute of Technology
Bob Irvine, Long Beach Township Rip Current Advocate
Jack Puleo, University of Delaware Center for Applied Coastal Research
Timothy Schott, NOAA, Marine & Coastal Weather Services

Rip Current Major Internat Research Sites utilized:

1. Nearshore Fundamentals, http://meted.ucar.edu/marine/ripcurrents/NSF/htm.,
       2005-2006.

2. Rip Current Education, http://www.ocean.udel.edu/wcarey/monthlyquestion, 2003

3. NOAA’s Office of Climate, Water, and Weather Services, www.ripcurrents.noaa.gov,
     2005-2006.

4. Rip Currents: Don’t Panic, A report by Katie Mosher, North Carolina Sea Grant,
       2002

5. Rip Currents: A Field Experiment. http://www.oc.nps.navy.mil/~thornton/ripex/

6. Rip Current Information: http://www.usla.org

7. How Rip Currents Work:: http://science.howstuffworks.com/rip-current.htm

8. Rip Currents: http://epod.usra.edu/archive/epodviewer.php3?oid=109088
You can also read