Saffron yield and quality as influenced by different irrigation methods - SciELO
←
→
Page content transcription
If your browser does not render page correctly, please read the page content below
DOI: http://dx.doi.org/10.1590/1678-992X-2019-0084
Crop Science

               ISSN 1678-992X                                                                                                                            Research Article

               Saffron yield and quality as influenced by different irrigation methods
               Abdullah Mollafilabi1* , Kamran Davari2 , Majid Amini Dehaghi3

               Research Institute of Food Science and Technology – Dept.
               1
                                                                            ABSTRACT: Dried stigma of saffron is the most expensive spice in the world. In Iran, the ma-
               of Food Biotechnology, km 12 Mashhad, Quchan Highway –       jority of saffron farms use the traditional basin method for irrigation, which, together with other
               PO Box 91895 – 157356 – Mashhad – Iran.                      irrigation methods may soon face serious problems because of droughts in the future. Making an
               Ferdowsi University of Mashhad – Dept. of Water Science
               2
                                                                            evaluation of the regional crop response to the irrigation method is important to the adoption of
               and Engineering, Azadi Square, Mashhad – 9177948974 –        a proper irrigation management strategy. In this study, the effect of employing different irrigation
               Razavi Khorasan Province – Iran.                             methods, including the sprinkler, drip, furrow, and basin, on the following factors was evaluat-
               Shahed University/Agricultural College – Dept. of Agronomy
               3
                                                                            ed: the saffron stigma dry weight, quality, water use efficiency (WUE), and Irrigation water use
               and Plant Breeding, Persian Gulf Highway – 3319118651        efficiency (IWUE) in the arid climate of Qaen, South Khorasan, Iran, over three consecutive crop
               –Tehran – Iran.                                              years. The experiment was undertaken using a randomized complete block design with three
               *Corresponding author        replications. The results showed that seasonal saffron Evapotranspiration (ETC) was recorded as
                                                                            356.5, 339.1, and 330.7 mm, in 2003, 2004 and 2005 respectively, as a result of administer-
               Edited by: Mohammad Valipour                                 ing the treatments. Saffron yield as well as WUE and IWUE were found to respond to the various
                                                                            irrigation methods except in the first year. In total, maximum stigma dry weight and water use
               Received April 14, 2019                                      efficiencies were reached in the third growing season using the drip irrigation method. Judging
               Accepted September 24, 2019                                  by the results, the drip irrigation method for saffron production is to be preferred. Additionally,
                                                                            the quality level of saffron was found to be acceptable. However, due to higher crocin content,
                                                                            the quality of saffron irrigated by the sprinkler method was somewhat higher.
                                                                            Keywords: crocin, picrocrocin, safranal, drip irrigation, water use efficiency

               Introduction                                                                             The average annual water requirement for saffron
                                                                                                 cultivation has been estimated to reach 490 mm by the
                       Dried stigma of Saffron Crocus sativus L., is the                         year, 2040 due to declining atmospheric precipitation
               most expensive spice in the world, and the most valuable                          (Jafarzadeh et al., 2015). Yarami et al. (2011) reported that
               industrial medical crop (Kyriakoudi et al., 2015; Vahedi et                       total saffron potential evapotranspiration values were
               al., 2018). In addition to its highly beneficial therapeutic                      523 and 640 mm in the first and second growing seasons,
               value, saffron is also used as a coloring agent (Koocheki,                        respectively. Thus, due to the shortage of water resources
               2004). Saffron is an indigenous crop of Iran; accordingly,                        in the future, the efficiency of irrigation water should be
               Iran is ranked first in this crop in terms of both area under                     increased to meet the water requirement of saffron.
               cultivation and production rate (Vahedi et al., 2018).                                   Research has shown that, water use efficiency
               Afghanistan, Greece, Morocco, India, Spain, and Italy                             (WUE) varies under different irrigation systems. Azizi-
               are other producers of saffron though their production                            Zohan et al. (2009) in their study concluded that the
               levels are negligible (Kafi et al., 2018). According to                           basin irrigation method had more WUE than the furrow
               statistics published by the Ministry of Agriculture, in 2017,                     irrigation method for saffron production. Since saffron is
               saffron dry stigma production in Iran, with a cultivation                         generally cultivated by the basin irrigation method, this
               area of about 105,000 ha, amounted to 336 t accounting                            form of irrigation has been at the center of attention in
               for approximately 89 % of total world production. The                             most studies. Consequently, information on the WUE for
               province of South Khorasan is one of the most important                           other alternative irrigation methods, such as sprinkler
               saffron producing regions in Iran Thus, the cultivation of                        and drip systems is lacking.
               saffron makes a significant contribution to the economy of                               Thus, the present study was aimed at evaluating
               the province.                                                                     the effect of different irrigation methods on the growth
                       Generally, in South Khorasan, saffron is subjected                        and yield of saffron, as well as water use efficiency in
               to the traditional basin irrigation method. Regrettably,                          the semi-arid climate.
               traditional growers irrigate the saffron regardless of the
               amount of available water in the soil so that in most cases                       Materials and Methods
               irrigation is characterized by high volumes with high
               frequency. Consequently, in addition to wasting water,                                  A field study was conducted for three years in
               it can also lead to water stress. Under such a system,                            Qaen, South Khorasan province, Islamic Republic of Iran.
               saffron fields are routinely irrigated from mid-Oct to early                      The area is located at 33° 43’ N, 59°11’ E, and 1,372 m
               Nov. During this period, pre-flowering irrigation plus 4-6                        above sea level, with warm and dry summers, relatively
               additional irrigation sessions during the entire plant growth                     cold winters and a huge difference between day and night
               season from Oct up to mid-spring is a common occurrence                           temperatures. According to Emberger’s classification, the
               in South Khorasan (Ghorbani and Koocheki, 2017).                                  climate of the region is defined as arid and cold. The mean

               Sci. Agric. v.78, n.1, e20190084, 2021
Mollafilabi et al. Saffron response to irrigation methods
annual temperature and rainfall were equal to 18.2 °C treatments were applied during the second and third
and 190.3 mm, respectively. The mean yearly maximum growing seasons. For the first growing season (2003), after
and minimum air temperature varies between 37.4 °C irrigation, the amount of water consumed was measured
and –29.6 °C. The soil texture was sandy clay. for sprinkler, drip, furrow, and basin treatments as 375,
600, 750, and 670 m3 ha–1, respectively. For the second
Farm preparation growing season (2004), the amounts mentioned were
At the beginning of the first growing season in late equal to 550, 500, 720, and 870 m3 ha–1, and for the third
May 2003, the soil was plowed, and 10 t ha–1 cow manure growing season (2005), they were equal to 460, 600, 960,
plus 150 kg ha–1 triple superphosphate, and 200 kg ha–1 and 1,335 m3 ha–1, respectively. To facilitate the saffron
potassium sulfate were added to the field according to flowering, the surface crust was broken open to a depth
the soil analysis results (Table 2). Subsequently, the soil of 10 cm after the first irrigation in each growing season.
was re-plowed and tilled by a disc harrow. In early June
2003, after disinfection using Propargite, saffron corms, Flower harvest
each with a mean weight of 8 g, were planted at a depth In each year, flower harvesting began in mid-Nov
of 10-15 cm, 4-cm apart in rows. The rows were 50 cm and continued until early Dec. Every morning before the
apart. The experimental treatments consisted of the air became warm, saffron flowers were picked from the
sprinkler, drip, furrow, and basin irrigation methods. The surface from an area of 6 m2 (3 × 2 m2) from each plot,
experiments were conducted in a complete randomized selected at random using a 2 m2 quadrate. The flowers
block design with three replications and the area of each were cleaned, and their stigmas were separated by hand
experimental plot was equal to 15 m2, with 6 rows of and dried in the shade at room temperature. In the third
5 m long. For the furrow irrigation method, the corms year, in addition to the flower harvest, leaf fresh weight
were planted on both sides of the ridges, and the distance m–2, leaf dry weight m–2, the average height of 50 saffron
between the ridges was equal to 50 cm. For the drip and plants (selected at random from the middle lines of each
sprinkler methods, the necessary facilities were installed plot), and corm dry weight m–2 were also measured.
on Aug 5, 2003. The corm weight was measured in early Each year after the flower harvest, 100 kg ha–1 of urea
June concurrent with the start of the corm dormancy fertilizer (46 % N) was dispersed on the field.
period.
Water use efficiency
Implementation of the irrigation systems Water use efficiency (WUE, g m–3) and irrigation
The irrigation water was applied using a flexible hose Water use efficiency (IWUE, g m–3) were calculated as
attached to an electromotor and a volumetric flow meter. defined in the study by Payero et al. (2008) as follows:
Field capacity was determined by installing a number of
Y
gypsum blocks (Figure 1). In each crop year, irrigation WUE = (1)
ETo × KC
was carried out on 5 occasions. The first irrigation was
carried out in the second week of Oct. and at each event,
irrigation continued to reach field capacity. The same Y
IWUE = (2)
I
Figure 1 – The overall schematic of the experiment showing the location of the flow meters, gypsum blocks, and sprinkler nozzles installed in
the experimental field.
Sci. Agric. v.78, n.1, e20190084, 2021 2Mollafilabi et al. Saffron response to irrigation methods
where Y is the yield (dry stigma, g m–2), ETo, the reference of the two other seasons, which was mainly due to higher
evapotranspiration (mm), Kc, the crop coefficient, and I, the minimum temperatures. In 2003, temperatures were
seasonal irrigation (m3). The reference evapotranspiration higher in Oct–Nov compared to 2004 and 2005 while, in
(ETo) was estimated using the ETo calculator version 2005, the seasonal mean actual vapor temperature was
3.2, a computer program developed by FAO, Land and higher. On average, wind speed was higher in 2005, and
Water Division, Rome, Italy. The software supports all average sunny hours per day was higher in 2003. Total
measurement units as well as all proposed equations monthly rainfall during the periods of 2003-2005 and
for calculating the ETo. The software calculates the ETo 1987–2005, the ETO, and the EV (evaporation from class A
using the weather data as input. In this study, the inputs evaporation pan, mm d–1) for Qaen are shown in Figure 2.
to the program were monthly weather data, including The long-term average rainfall diagram shows that rainfall
maximum, minimum, and mean air temperature, actual is almost zero from late May to early Oct at the Qaen
vapor pressure, wind speed (2 m above soil surface), and station. Therefore, as explained before, saffron is one of
actual duration of sunshine during any one day. The the best choices for cultivation in the area based on its
necessary meteorological data were obtained from Qaen’s dormancy and growth periods and water requirements.
meteorological station, from an automatic weather station The annual rainfall recorded was 138.7, 169.5, and 149.2
located within 1.85 km from the research site. Monthly mm for 2003, 2004 and 2005, respectively. However, the
weather data were downloaded from the IRIMO web rainfall during all three seasons was less than the period
site (https://data.irimo.ir). To adjust the estimated ETo, of 1987–2005 (average of 175.76 mm). Compared to 2003
the monthly KC proposed in the study by Sepaskhah and and 2005, the 2004 season had less rainfall from Feb to
Kamgar-Haghighi (2012) was used. Mar and significant rainfall from Nov to Dec. Therefore,
compared to 2003 and 2005, there was a higher chance
Quality analysis for more water storage in the soil profile at the beginning
Saffron’s main components including picrocrocin, of the flowering period in 2004. In the case of saffron
safranal, and crocin were determined based on the ISO cultivation, the amount of water in the soil in Oct and
method (ISO3632-2:2010, saffron-test methods) (Sereshti Nov is of particular importance. As shown in Figure
et al., 2018). Briefly, 50 mL of distilled water was added
to 50 mg of saffron powder (1 %, w/v) and was stirred for
1 h. Next, the solution was placed in a dark place for 24
h, then filtered rapidly using filter paper to obtain a clear
solution. Then, 1 mL of this solution was transferred to
a 25-mL volumetric flask, and topped up with distilled
water (0.004 %, w/v). Finally, the absorbance of this
solution was measured by UV–Vis spectrophotometry.
The wavelengths obtained were 330, 440 and 257 nm
for safranal, crocin, and picrocrocine, respectively. The
following equation was used to calculate the picrocrocin,
safranal, and crocin values:
D × 10000
A11cm
%
(λmax ) =
M × (100 − WMV )
where D is the absorbance of the solution at the desired
wavelength; M, the Mass of the test portion, WMV, the
moisture and volatile matter content, expressed as a
percentage mass fraction of the sample.
Statistical analysis
Analysis of variance (ANOVA) and means
comparisons were conducted using SAS (Statistical
Analysis System, version 9.1) and the PROC GLM test.
The means were compared at 5 % probability.
Results and Discussion
Weather conditions during the growing seasons
Average values of weather parameters during Figure 2 – The average of monthly precipitation (A), daily evaporation
the period of 2003-2005 for saffron growing seasons in from class A evaporation pan (Ev), reference evapotranspiration
Qaen, South Khorasan, are shown in Table 1. In 2004, (ETO) for the period of 2003-2005 and the long-term average
the seasonal mean air temperature was higher than that precipitation (1987–2005) (B) at Qaen, South Khorasan, Iran.
Sci. Agric. v.78, n.1, e20190084, 2021 3Mollafilabi et al. Saffron response to irrigation methods
Table 1 – The average values of weather parameters during the period of 2003-2005 for saffron growing seasons at Qaen, South Khorasan, Iran.
Year Month Tmax Tavg Tmin Actual vapor pressure Wind speed Total sunny hours ETo ETc
------------------------------- °C ---------------------------------- kpa m s–1 h ------------ mm d–1 -----------
2003 Jan 17.60 6.00 –8.80 4.62 8.00 5.89 0.50 0.55
Feb 19.20 8.20 –6.60 5.15 12.00 7.93 0.60 0.56
Mar 24.40 11.70 –7.80 5.65 15.00 7.06 0.70 0.48
Apr 33.00 19.30 1.60 7.84 13.00 8.79 1.70 0.85
May 31.80 20.90 0.40 6.99 15.00 11.02 1.80 0.76
Oct 33.00 19.50 0.80 4.57 10.00 9.82 1.50 0.68
Nov 27.60 9.90 –9.00 3.87 8.00 8.12 0.80 0.44
Dec 19.00 4.80 –18.20 4.30 10.00 6.27 0.30 0.28
Average 25.70 12.54 -–5.95 5.37 11.38 8.11 0.99 0.57
2004 Jan 16.20 6.40 –7.80 5.95 12.00 4.66 0.30 0.33
Feb 25.20 9.80 –4.80 4.76 12.00 9.19 0.80 0.74
Mar 28.60 14.20 –1.40 5.95 13.00 7.60 1.10 0.75
Apr 30.60 17.50 1.40 6.27 14.00 8.53 1.50 0.75
May 33.80 24.30 3.00 6.49 15.00 10.38 1.90 0.80
Oct 29.20 16.60 –3.40 5.16 10.00 9.91 1.20 0.54
Nov 24.20 13.50 –6.60 6.11 15.00 7.40 0.50 0.28
Dec 16.80 5.20 –7.60 5.85 8.00 4.93 0.40 0.37
Average 25.58 13.44 –3.40 5.82 12.38 7.83 0.96 0.57
2005 Jan 14.00 1.70 –17.80 4.68 10.00 6.38 0.30 0.33
Feb 17.80 2.50 –10.60 5.16 14.00 5.19 0.40 0.37
Mar 25.40 11.10 –3.00 7.58 15.00 6.55 0.80 0.54
Apr 30.20 15.40 –3.40 7.25 11.00 9.78 1.60 0.80
May 29.60 19.30 6.20 9.15 10.00 9.67 2.20 0.92
Oct 33.00 15.90 –2.80 5.14 8.00 9.92 1.60 0.72
Nov 25.00 7.60 –9.80 4.78 8.00 8.52 0.70 0.39
Dec 22.00 5.30 –12.80 3.85 8.00 7.42 0.50 0.47
Average 24.63 9.85 -6.75 5.95 10.50 7.93 1.01 0.57
Table 2 – Results of the soil analysis of saffron research farm located in suburbs of Qaen, South Khorasan province.
Depth pH EC SP T.N.V N OC Sand Silt Clay P K Fe Cu Zn
cm ds m–1 -------------------------------------------------------------------------- % -------------------------------------------------------------------------- ------------------------------------------- ppm ------------------------------------------
0-30 8.04 0.53 22.4 18.3 0.009 0.125 86 6 8 1.6 120 3.08 0.16 3.02
Optimum 6-7Mollafilabi et al. Saffron response to irrigation methods
The analysis results of the second year data showed less vegetative growth compared to the basin method.
that the irrigation method had a significant effect on saffron Thus, vegetative growth may be negatively correlated
yield (p < 0.01). According to the multiple comparisons with the reproductive growth and therefore, there may
of means, three groups were recognized (Figure 2). be an antagonistic relationship between these two typ
There was no statistically significant difference between es of saffron traits (Table 3 and Figure 3). The majority
the furrow and basin irrigation methods in the second of prior research studies have focused on comparisons
year, while there were significant differences between between basin and furrow irrigation methods. For
the drip irrigation method and the three other methods. example, Azizi-Zohan et al. (2009) concluded that the
Moreover, the sprinkler irrigation method yielded the furrow irrigation method provides a higher number of
lowest quantity of saffron stigma dry weight. This may small size corms while basin irrigation method provides
be due to the occurrence of surface crusts, after the first a higher number of large size corms. In contrast, Khazaei
irrigation (maybe due to the soil’s low organic matter) et al. (2013) achieved a higher corms number and corm
resulting in reduced saffron yield. Despite breaking the weight through the furrow irrigation method compared
surface cracks, saffron yield was reduced under the with the basin irrigation method.
sprinkler irrigation method. There was a similar problem In addition to quantitative measurements, the status
for the furrow irrigation method, while the drip irrigation of quality characteristics is important in the case of saffron
method resulted in better soil moisture which in turn trading. Thus, in this study, certain qualitative indices of
led to providing a better environment around the saffron saffron were determined (Table 4). The results showed that
corms in terms of moisture content. Furthermore, under the quality of saffron obtained under different irrigation
the drip irrigation method, surface crusting did not appear methods was at an acceptable level. Although there were a
to lead to facilitation of the emergence of saffron flowers. number of differences between the quality characteristics
The ratios of saffron yield in drip irrigation method to studied, they were not statistically significant. Therefore,
that of the basin, furrow, and sprinkler irrigation methods the observed differences were presented only numerically
were equal to 4.21, 5.56, and 7.32, respectively. (Table 4). The level of picrocrocin content, as the chemical
In general, higher crop yield was achieved in the component most responsible for the taste of saffron
third growing season, once three years had passed from (Kabiri et al., 2017), and as estimated by the sprinkler and
the cultivation in the field, which may be due to the furrow irrigation methods, was high. Furthermore, the
greater number of flower harvest events. The analysis of Safranal content, as the constituent primarily responsible
variance showed that the results were similar to those for the aroma of saffron (Razavi and Hosseinzadeh, 2017),
obtained in the second year. Mean comparisons revealed
that there were no significant differences between the Table 3 – Comparison of the mean traits related to the vegetative
furrow, basin, and sprinkler irrigation treatments while growth of saffron in the third year of the experiment.
the drip irrigation treatment resulted in significantly
Irrigation method PH LFW LDW CW
higher yield (Figure 2). It seems that, similar to what
cm ---------------------------------- g m–2 ----------------------------------
happened in the second year; the formation of surface
Drip 34.95 b 751.5 ab 237.75 b 751 b
crusts after each irrigation had a major role in reducing Sprinkler 37.01 a 485.5 b 184.88 b 705 b
the saffron yield. Azizi-Zohan et al. (2009) believed that, Basin 36.1 ab 884.5 a 293.5 a 1150.2 a
in the furrow irrigation system, the unfavorable soil Furrow 35.75 ab 575.5 b 200.06 b 849.3 ab
conditions caused by the thinner soil layer over corms will Means with different letters are significantly different; PH = Plant height (the
result in a reduction in the growth of corms and growing average the height of 50 plants); LFW = Leaf fresh weight; LDW = Leaf dry
weight; CW = Corm weight.
periods. In the third growing season, the ratios of saffron
yield in drip irrigation method to that in the basin, furrow,
and sprinkler irrigation methods were equal to 13.1, 14.1,
and 12.32, respectively. Azizi Zohan et al. (2006) proposed
that, out of the two methods of irrigation i.e. basin and
farrow, the basin is preferred over furrow irrigation due
to lower water consumption and production of larger size
corms which promotes flowering.
In the third year of the experiment, in addition to
measuring stigma dry weight, a number of characteristics
related to the growth of saffron were also measured
(Table 3). Maximum and minimum corm weight was
obtained for the basin and sprinkler irrigation methods,
respectively. Similarly, the highest and lowest leaf dry
weight was found for the basin and sprinkler irrigation
methods, respectively (Table 3). These results revealed Figure 3 – The effect of different irrigation methods on saffron yield
that, the drip irrigation method yielded more stigma (stigma dry weight) during three growing seasons at Qaen, South
dry weight (logically a greater number of flowers), but Khorasan, Iran. LSD = Least Significant Difference.
Sci. Agric. v.78, n.1, e20190084, 2021 5Mollafilabi et al. Saffron response to irrigation methods
was found to be within the acceptable range (Table 4). based on principal component analysis (Figure 4). The
Numerically, the drip and furrow irrigation methods highest value of saffron yield was observed for the drip
were found to have higher safranal content than that irrigation method in 2005 (Figure 4A).
of the other two methods. Moreover, as shown in Table
4, the amounts of crocin, the chemical component Effect of irrigation method on water use efficiency
primarily responsible for the color of saffron (Amini et WUE and IWUE for the different irrigation
al., 2017), were also at the standard level. Numerically, methods are shown in Table 5. Different values were
the sprinkle irrigation treatment was found to yield a obtained for both IWUE and WUE depending on the
noticeably high crocin level which was more than those irrigation method employed, due to the different
measured for other methods. These results indicated that, amounts of water consumed and the different yield levels
environmental factors have a significant effect on saffron obtained at each treatment level (Table 5). Irrigation
quality. Therefore, the expression of the genes responsible treatments influenced the IWUE much more than the
for saffron quality would be significantly influenced by the WUE. However, the difference was not statistically
environmental conditions. Numerically, saffron irrigated significant between the values of these parameters for
using the sprinkler method showed a higher yield and the first growing season. This result was not unexpected,
crocin content, and, consequently, its quality was also since both the IWUE and WUE are calculated based on
noticeably higher (Table 4). No logical justification was the yield (the numerator of both equations 1, and 2)
found in this regard. and, as previously explained, the saffron yield was not
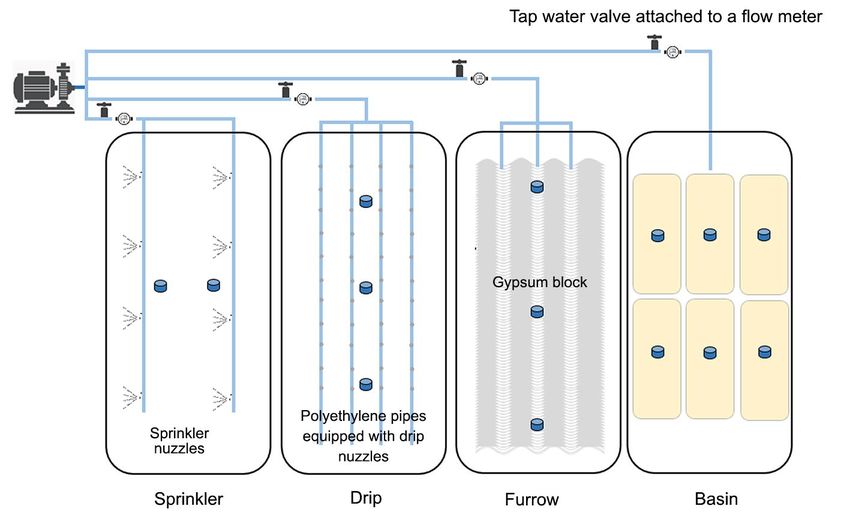
The biplot graph discriminated the distributions statistically influenced by the irrigation methods in the
of different irrigation methods and the growing seasons first growing season. Due to the high level of production
Table 4 – The effect of irrigation methods on quality characteristics of saffron during the period of 2003-2005 for growing seasons at Qaen,
South Khorasan, Iran.
Picrocrocin* (absorption at 257 nm) Safranal* (absorption at 330 nm) Crocin* (absorption at 440 nm)
Sprinkler 81.22 24.32 222.98
Drip 69.39 31.29 170.5
Furrow 82.6 34.65 191.57
Basin 71.45 29.45 184.48
Premium saffron 85 20-50 220
*in each column the data were not, statistically speaking, significantly different.
Table 5 – The effect of irrigation methods on water use efficiency in saffron yield (stigma dry weight) during the period of 2003-2005 for growing
seasons at Qaen, South Khorasan, Iran.
2003 2004 2005
Treatment
IWUE WUE IWUE WUE IWUE WUE
---------------------------------------------------------------------------------------------------------------------------------- g m–3 ----------------------------------------------------------------------------------------------------------------------------------
Basin 4.44 ± 0.47 0.83 ± 0.09 4.62 ± 0.26 1.18 ± 0.07 10.6 ± 1.16 2.56 ± 0.28
Drip 11.69 ± 3.96 1.97 ± 0.67 16.5 ± 3.77 2.43 ± 0.56 44.86 ± 4.87 6.55 ± 0.71
Furrow 5.01 ± 1.91 1.05 ± 0.4 3.68 ± 1.29 0.78 ± 0.27 10.66 ± 2.81 2.26 ± 0.59
Sprinkler 7.89 ± 2.6 0.83 ± 0.27 1.59 ± 0.45 0.26 ± 0.07 17.79 ± 2.65 2.8 ± 0.42
LSD (p < 0.05) 9.06 2.16 6.43 0.99 11.42 1.88
IWUE = Irrigation water use efficiency; WUE = water use efficiency; LSD = Least Significant Difference.
Figure 4 –The biplot of different irrigation methods in three growing seasons for (A) saffron stigma dry weight, and (B) water use efficiency. PC1
and PC2 are the first and second principal components, respectively.
Sci. Agric. v.78, n.1, e20190084, 2021 6Mollafilabi et al. Saffron response to irrigation methods
as well as the lower water consumption, IWUE and Azizi-Zohan, A.A.; Kamgar-Haghighi, A.A.; Sepaskhah, A.R. 2009.
WUE values generally tended to be higher for the drip Saffron (Crocus sativus L.) production as influenced by rainfall,
irrigation method. In 2004, the drip irrigation treatment irrigation method and intervals. Archives of Agronomy and
followed by the sprinkler irrigation treatment had the Soil Science 55: 547-555
highest IWUE and WUE values while, in 2005, the basin Azizi Zohan, A.A.; Kamgar-Haghighi, A.A.; Sepaskhah, A.R.
irrigation treatment ranked second after the drip method. 2006. Effect of irrigation method and frequency on corm and
The ratio of the maximum to minimum WUE was saffron production (Crocus sativus L.). Journal of Water and Soil
equal to 9.46 and 2.90, respectively in 2004 and 2005. Science 10: 45-54
The corresponding ratios were equal to 10.4 and 4.23, Ghorbani, R.; Koocheki, A. 2017. Sustainable cultivation of
respectively for IWUE in 2004 and 2005. Therefore, by saffron in Iran. p. 169-203. In: Lichtfouse, E., ed. Sustainable
adopting the appropriate irrigation method, the IWUE agriculture reviews. Springer, Cham, Germany.
can be increased up to 10 times. Jafarzadeh, A.; Khashei-Siuki, A.; Shahidi, A. 2015. Modeling of
From 2003 to 2005, the amount of water consumed climate change effects on saffron water requirement in south
for drip irrigation method was equal to 600, 500, and Khorasan province by GIS. Journal of Saffron Research 3: 163-174.
483.3 m3 ha–1 showing a decreasing trend while there Kabiri, M.; Rezadoost, H.; Ghassempour, A. 2017. A comparative
was an increasing trend for the corresponding values quality study of saffron constituents through HPLC and HPTLC
of IWUE as well as WUE (Table 5). Thus, generally methods followed by isolation of crocins and picrocrocin. LWT
speaking, both WUE and IWUE tended to decrease with 84: 1-9.
increases in irrigation. Payero et al. (2008), in their study Kafi, M.; Kamili, A.N.; Husaini, A.M.; Ozturk, M.; Altay, V. 2018.
showed that the decreasing tendency of IWUE and WUE An expensive spice saffron (Crocus sativus L.): a case study from
values in relation to irrigation is expected in arid and Kashmir, Iran, and Turkey. p. 109-149. In: Ozturk, M.; Hakeem,
semi-arid regions. Table 5 also shows that, both IWUE K.R.; Ashraf, M.; Ahmad, M.S.A., eds. Global perspectives on
and WUE are more closely associated with the irrigation underutilized crops. Springer, Cham, Germany.
method. Thus, IWUE and WUE had a matching behavior Karimiferezgh, M.; Khazaei, H.R.; Kafi, M.; Nezami, A. 2018.
with the irrigation method. Accordingly, both IWUE and Comparison of the effect of irrigation levels and methods on
WUE can be used to estimate the water use efficiency of leaf area and replacement corm production of saffron (Crocus
different irrigation methods in saffron farms. The results sativus L.). Saffron Agronomy & Technology 6: 279-290.
of multivariate analysis also confirmed that the highest Khazaei, M.; Monfared, M.; Kamgar Haghighi, A.A.; Sepaskhah,
WUE was found when the drip irrigation method was A.R. 2013. The trend of change for weight and number of
employed in 2005 (Figure 4B). saffron corms as affected by irrigation frequency and method
The results of the current study indicated that in different years. Journal of Saffron Research 1: 48-56.
the highest stigma dry weight was produced by the drip Koocheki, A. 2004. Indigenous knowledge in agriculture with
irrigation method during all three growing seasons of the particular reference to saffron production in Iran. Acta
experiment. Furthermore, compared to the traditional Horticulturae (ISHS) 650: 175-182
irrigation system, less water was consumed by the drip Kyriakoudi, A.; Ordoudi, A.; Roldán-Medina, M.; Tsimidou, Z.
irrigation method in each growing season. Therefore, due 2015. Saffron, a functional spice. Austin Journal of Nutrition
to less water consumption and more stigma dry weight and Food Sciences 3: 1059.
production, it is suggested that the use of drip irrigation Payero, J.O.; Tarkalson, D.D.; Irmak, S.; Davison, D.; Petersen,
method can increase the efficiency of water use by up J.L. 2008. Effect of irrigation amounts applied with subsurface
to 10 times. The cost imposed on farmers would be drip irrigation on corn evapotranspiration, yield, water use
considered as the only disadvantage of drip irrigation efficiency, and dry matter production in a semiarid climate.
method. Nevertheless, it should be taken into account that Agricultural Water Management 95: 895-908.
long-term use will compensate for increased deployment Razavi, B.M.; Hosseinzadeh, H. 2017. Saffron: a promising natural
costs as a result of the saving in water consumption as medicine in the treatment of metabolic syndrome. Journal of
well as the achieving of more yield. the Science of Food and Agriculture 97: 1679-1685.
Sereshti, H.; Ataolahi, S.; Aliakbarzadeh, G.; Zarre, S.; Poursorkh,
Authors’ Contributions Z. 2018. Evaluation of storage time effect on saffron chemical
profile using gas chromatography and spectrophotometry
Conceptualization: Mollafilabi, A; Davari, K. Data techniques coupled with chemometrics. Journal of Food
acquisition: Mollafilabi, A; Davari, K. Data analysis: Science and Technology 55: 1350–1359.
Amini Dehaghi, M. Design of methodology: Mollafilabi, Vahedi, M.; Kabiri, M.; Salami, S.A.; Rezadoost, H.; Mirzaie, M.;
A; Davari, K. Writing and editing: Amini Dehaghi, M. Kanani, M.R. 2018. Quantitative HPLC-based metabolomics of
some Iranian saffron (Crocus sativus L.) accessions. Industrial
References Crops and Products 118 :26-29.
Yarami, N.; Kamgar-Haghighi, A.A.; Sepaskhah, A.R.; Zand-Parsa,
Amini, M.; Ghoranneviss, M.; Abdijadid, S. 2017. Effect of cold S. 2011. Determination of the potential evapotranspiration and
plasma on crocin esters and volatile compounds of saffron. crop coefficient for saffron using a water-balance lysimeter.
Food Chemistry 235: 290-293 Archives of Agronomy and Soil Science 57: 727-740.
Sci. Agric. v.78, n.1, e20190084, 2021 7You can also read