GHG Emissions Reductions due to the RFS2- A 2020 update - LCA.6145.213.2021 February 11, 2021 Prepared by: Stefan Unnasch Debasish Parida ...
←
→
Page content transcription
If your browser does not render page correctly, please read the page content below
GHG Emissions Reductions due to the RFS2-
                           A 2020 update

                             LCA.6145.213.2021
                              February 11, 2021

                                   Prepared by:
                                Stefan Unnasch
                                Debasish Parida
DISCLAIMER

This report was prepared by Life Cycle Associates, LLC for the Renewable Fuels Association
(RFA). Life Cycle Associates is not liable to any third parties who might make use of this work.
No warranty or representation, express or implied, is made with respect to the accuracy,
completeness, and/or usefulness of information contained in this report. Finally, no liability is
assumed with respect to the use of, or for damages resulting from the use of, any information,
method or process disclosed in this report. In accepting this report, the reader agrees to these
terms.

                                   ACKNOWLEDGEMENT

Life Cycle Associates, LLC performed this study under contract to the Renewable Fuels
Association. Scott Richman was the project manager.

Contact Information:

Stefan Unnasch
Life Cycle Associates, LLC
1.650.461.9048
unnasch@LifeCycleAssociates.com
www.LifeCycleAssociates.com

Recommended Citation: Unnasch. S. and D. Parida (2021) GHG Reductions from the RFS2 – A
2020 Update. Life Cycle Associates Report LCA. LCA.6145.213.2021 Prepared for Renewable
Fuels Association.
Contents
Terms and Abbreviations ................................................................................................................ ii
Executive Summary ....................................................................................................................... iii
  _Toc61622611
  1. Introduction .......................................................................................................................... 1
    1.1 RFS Renewable Fuel Categories, Production Volumes and RINS Generated ............. 2
  2. Land Use Change ................................................................................................................. 6
  3. Carbon Intensity of Corn Ethanol and Biofuels production ................................................ 7
    3.1 Fuel Impacts ............................................................................................................... 10
    3.2 Avoided GHG Emissions ........................................................................................... 13
    3.3 GHG Calculation Methods ......................................................................................... 12
  4. Conclusions ........................................................................................................................ 16
  5. References .......................................................................................................................... 17

                                                                 Tables

Table 1. U.S. Renewable Fuel Categories, Fuel Type, Feedstock Source and RIN D-Code ......... 3
Table 2. U.S. Renewable Fuel Volumes Produced ......................................................................... 5
Table 3. LUC Emissions Estimates from Biofuels ......................................................................... 6
Table 4. Corn Ethanol Production Capacity and Technology Aggregation ................................... 8
Table 5. Carbon Intensity of Corn Ethanol ..................................................................................... 9
Table 6. Biodiesel Feedstocks Volumes ......................................................................................... 9
Table 7. Carbon Intensity Estimates of All Biofuels plus EPA Minimum Threshold .................. 11
Table 8. Carbon Intensity Estimates of All Biofuels plus EPA Minimum Threshold .................. 13

                                                                Figures

Figure 1. GHG Emissions Reductions due to the RFS2. ............................................................... iii
Figure 2. RFS2 renewable fuel volume requirements for the United States. ................................. 1
Figure 3. Weighted carbon intensity (g CO2 e/MJ) of petroleum fuels consumed in the U.S. ....... 2
Figure 4. GHG Savings from Ethanol........................................................................................... 14
Figure 5. GHG Savings from Other RFS2 Biofuels (Excluding Ethanol).................................... 15
Figure 6. GHG Savings from the RFS2 Program ......................................................................... 15

i   |   GHG Reductions from the RFS2                                                                       Copyright © 2021
Terms and Abbreviations

ANL                     Argonne National Laboratory
ARB                     California Air Resources Board
Btu                     British thermal unit
BD                      Biodiesel
CI                      Carbon Intensity
CNG                     Compressed Natural Gas
CRF                     Corn Replacement Feed
LNG                     Liquefied Natural Gas
DGS                     Distillers Grains with Solubles
DDGS                    Dry Distillers Grains with Solubles
EPA                     Environmental Protection Agency
EIA                     Energy Information Agency
FAME                    Fatty Acid Methyl Ester
GHG                     Greenhouse gas
GREET                   Greenhouse gas, Regulated Emissions and Energy Use
                        in Transportation (Argonne National Laboratory’s well-to-wheels model)
kWh                     kiloWatt-hour
LCA                     Life cycle assessment
LCFS                    Low Carbon Fuel Standard
LHV                     Lower heating value
MGY                     Million gallons per year
MJ                      Mega joule
mmBtu                   Million Btu
RFS                     Renewable Fuel Standard (U.S.)
NERD                    Non-Ester Renewable Diesel
Tg                      Terra gram (1012g)
TTW                     Tank-to-wheels
UCO                     Used Cooking Oils
U.S.                    United States
VOC                     Volatile Organic Compound
WDGS                    Wet Distillers Grains with Solubles
WTT                     Well-to-tank
WTW                     Well-to-wheels

ii   |   GHG Reductions from the RFS2                                   Copyright © 2021
Executive Summary
The RFS2 has resulted in aggregate GHG emissions reductions from the use of biofuels, which
exceed the original projections from the final Rule for the first 13 years of its implementation.
The RFS2 has resulted in significant GHG reductions, with cumulative CO2 savings of 980
million metric tonnes over the period of implementation to date. The GHG reductions are due to
the greater than expected savings from ethanol and other biofuels. These emissions savings occur
even though cellulosic biofuels have not met the RFS2 production targets. In addition, EPA
underestimated the petroleum baseline in the Rule. Studies by Life Cycle Associates and the
Carnegie Institute have shown that the GHG emissions from U.S. petroleum are higher than the
EPA calculated in 2005 (Boland, 2014; Gordon, 2012, 2015). This study calculates the annual
U.S. petroleum GHG intensity based on the changing trends in feedstock availability over time
and determines the GHG savings calculated from the aggregate mix of renewable fuels. The
GHG intensity for each category of ethanol plant and biodiesel feedstock is estimated for the
resource mix over the past 13 years and combined to determine an aggregate estimate. Figure 1
shows the total emissions reductions from the RFS2 compared with the GHG reductions
projected from the rule.
Figure 1. GHG Emissions Reductions due to the RFS2.
iii | GHG Reductions from the RFS2 Copyright © 2021This page is intentionally left blank. iv | GHG Reductions from the RFS2 Copyright © 2021
1. Introduction
This study builds upon the 2014 Carbon Intensity of Marginal Petroleum and Corn Ethanol Fuels
report and subsequent updates (Boland, 2014) (Boland 2015, Unnasch 2019)) released by Life
Cycle Associates under contract to the Renewable Fuels Association. The Marginal Emissions
report examined the trends in the greenhouse gas (GHG) emissions, termed Carbon Intensity (CI)
of U.S. petroleum and corn ethanol transportation fuels. The CI is measured in grams of carbon
dioxide emitted per megajoule of fuel (g CO2 e/MJ). This work includes all renewable fuels sold
under the RFS2 and their corresponding CI values.

The U.S. Renewable Fuel Standard (RFS2) requires the addition of 36 billion gallons of
renewable transportation fuels to the U.S. slate by 2022. The RFS2 established mandatory GHG
emission thresholds for renewable fuel categories based on reductions from an established 2005
petroleum baseline. Within the total volume requirement, RFS2 establishes separate annual
volumes for cellulosic biofuels, biomass-based diesel, advanced biofuels, and renewable fuels.
Figure 2 illustrates the RFS2 volume requirements per fuel category. To comply with the
standard, obligated parties must sell their annual share (as calculated by EPA) within each
category.

             Figure 2. RFS2 renewable fuel volume requirements for the United States.

The 2005 petroleum baseline developed by EPA is based on the aggregate emissions from the
production of petroleum fuels consumed in the U.S. during 2005. The methodology and
assumptions for the petroleum baseline are contained in the EPA Regulatory Impact Analysis

1   |   GHG Reductions from the RFS2                                     Copyright © 2021
(EPA, 2010). The baseline remains constant throughout the statutory timeframe of the RFS2
(2005 to 2022). However, the mix of crude slates used to develop the baseline has changed since
2005, and the advent of new crude extraction and processing technologies has raised the
aggregate CI of petroleum fuels above the 2005 baseline. Furthermore, the baseline refining
emissions were underestimated and have since been revised in LCA models (ANL, 2014; El-
houjeiri, 2012). The 2014 Marginal Emissions study (Boland, 2014) re-examines the mix of
crude slates and U.S. consumption trends to develop the annual aggregate U.S. petroleum CI.
The annual aggregate CI provides a more accurate estimate of the aggregate U.S. petroleum CI.
Figure 3 shows the weighted carbon intensities of petroleum fuels consumed in the U.S.
alongside the EPA 2005 baseline. This revised estimate results in an aggregate petroleum CI that
is higher than the 2005 EPA average gasoline baseline of 93.08 g CO2 e/MJ. The median CI of
aggregate U.S. petroleum gasoline is 96.8 g CO2 e/MJ.
Figure 3. Weighted carbon intensity (g CO2 e/MJ) of petroleum fuels consumed in the U.S.
1.1 RFS Renewable Fuel Categories, Production Volumes and RINS Generated
Table 1 shows the U.S. renewable fuel categories, the fuel type and the typical feedstocks used to
produce each fuel. Also shown is the RIN D Code. The RIN code is the Renewable Identification
Number (RIN), used to track fuel production and sales. Each type of renewable fuel generates a
RIN when produced. Each D code applies to a specific RIN category.
2 | GHG Reductions from the RFS2 Copyright © 2021EPA reports fuels sold by D-code type, which are further categorized as shown in Table 1. EIA
reports the types of feedstocks used in biodiesel production.1 This study matched the
fuel/feedstock combinations with fuel volumes. Some fuel categories achieve GHG reductions
that are consistent with the 50% and 60% GHG reductions in the RFS2, while other fuels such as
corn oil biodiesel achieve even lower GHG reductions than the RFS requirements. The CI for
each feedstock and fuel is matching in the following analysis.
Table 1. U.S. Renewable Fuel Categories, Fuel Type, Feedstock Source and RIN D-Code
RIN
code Fuel Category Fuel Type Feedstock
D6 Renewable Fuel Ethanol Corn, Grain Sorghum
D6 Renewable Fuel Biodiesel Palm Oil
D6 Renewable Fuel NERDa (EV 1.7) Palm Oil
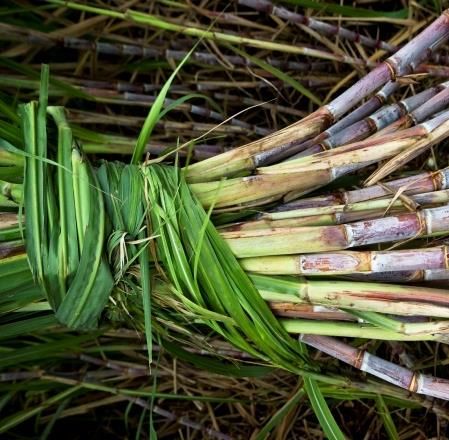
D5 Advanced Biofuel Ethanol Grain Sorghum, Sugarcane, Beverage Waste
D5 Advanced Biofuel Biogas Landfill, Wastewater Treatment
D5 Advanced Biofuel NERD (EV 1.6) Tallow, Used Cooking Oils, Soybean, Distillers’
Corn & Sorghum Oil, Food Waste
D5 Advanced Biofuel NERD (EV 1.7) Tallow, Used Cooking Oils, Soybean, Distillers’
corn & sorghum oil, Food waste
D5 Advanced Biofuel Bio-Naphtha Used Cooking Oils, Distillers’ Corn & Sorghum
Oil
D4 Biomass-Based Diesel Biodiesel Soybean, Canola/Rapeseed, Tallow, Distillers’
Corn & Sorghum Oil
D4 Biomass-Based Diesel NERD (EV 1.5) Tallow, Soybean, Distillers’ Corn & Sorghum Oil
D4 Biomass-Based Diesel NERD (EV 1.6) Tallow, Soybean, Distillers’ Corn & Sorghum Oil
D4 Biomass-Based Diesel NERD (EV 1.7) Tallow, Soybean, Distillers’ Corn & Sorghum Oil
D3 Cellulosic Biofuel Ethanol Corn Kernel Fiber, Biomass Stover
D3 Cellulosic Biofuel RCNG Landfill, Wastewater Treatment, Animal Waste
D3 Cellulosic Biofuel RLNG Landfill, Wastewater Treatment, Animal Waste
D3 Cellulosic Biofuel Renewable Gasoline Forest Waste, Crop Residue, Food Waste
D7 Cellulosic Diesel NERD (EV 1.7) Forest Waste, Crop Residue, Food Waste
a
NERD = Non-Ester Renewable Diesel
Table 2 shows the U.S. renewable fuel volumes generated (million gallons of fuel) from 2008 -
2020 (i.e., the period of RFS2 implementation). The study also evaluates the effect of the RFS
extended through 2020 with fuel volumes shown as indicated.
1
EPA categorizes renewable diesel by equivalence value EV. The equivalence value represents the ratio of heating
value of a biofuel to the heating value of a gallon of denatured ethanol. NERD EVs may vary with data submitted by
different fuel developers with petitions to EPA.
3 | GHG Reductions from the RFS2 Copyright © 2021The GHG emissions for each category of fuel in Table 2 are calculated based on estimates of the composite carbon intensity (CI) for each of the fuels. The CI varies among all of the fuel technologies. Grain-based ethanol production uses a range of process fuels. Ethanol plants also produce distillers’ grains, corn oil, and other food and feed products. Ethanol also is a higher- octane blending component which reduces the GHG emissions associated with crude oil refining. Note that the RIN data is categorized by the Equivalence Value (EV) which corresponds to the different in energy content of diesel, naphtha, and jet fuel relative to ethanol which are typically associated with the production of non-ester renewable diesel (NERD) fuels as well as pyrolysis- based fuels. Biodiesel and NERD also use a range of feedstocks including vegetable oils and waste oils. The CI depends on the mix of these feedstocks. Many sources of biogas generate RINs under the RFS including landfills as well as food waste and manure anaerobic digesters. The latter source of renewable natural gas (RNG) result in the avoidance of methane emissions, which further reduce GHG emissions. RNG is a feedstock for compressed natural gas (CNG) and liquefied natural gas (LNG) as well as a process fuel for some ethanol plants. 4 | GHG Reductions from the RFS2 Copyright © 2021
Table 2. U.S. Renewable Fuel Volumes used in Transportation2
                D-
                    Fuel Type
               code                                                                  Fuel Volumes (Million Gallons) a
                                                      2008        2010          2012      2014    2016       2018     2020b 2025
                   6     Ethanol                      9,309      13,298        12,987     14,022 14,725     14,967    12,566 15,310
                   6     Biodiesel                      0            0             1         53     113         0         0      0
                   6     NERD (EV 1.7)                  0            0             0        151     166       107        76     80
                   5     Ethanol                       530          16           603         90      61       102       185    650
                   5     Biogas                         0            0             3         20       0         1         0     10
                   5     NERD (EV 1.6)                  0            5             2          0       0         0         0      0
                   5     NERD (EV 1.7)                  0            3            10          9       5        24        38    107
                   5     Bio-Naphtha                    0            0             0         12      18        21        21     40
                   4     Biodiesel                     678         343          1,056      1,436   2,194     2,030     1,998  2100
                   4     NERD (EV 1.5)                  0            0             1          0       0         0         0      0
                   4     NERD (EV 1.6)                  0            0             9          7       0         0         5     14
                   4     NERD (EV 1.7)                  0            1            80        320     421       485       824   1,400
                   3     Ethanol                        0            0             0          1       4         8        30    102
                   3     RCNG                           0            0             0         15     117       222       344    443
                   3     RLNG                           0            0             0         17      72        83        83    165
                   3     Renewable Gasoline             0            0             0          0       0         0         0      0
                   7     NERD (EV 1.7)                  0            0             0          0       1         0         0      0
                         Anhydrous Ethanol            9,642      13,047        13,318     13,831 14,494     14,776    12,525 15,741
                         Denaturant                    197         266           272        282     296       302       256    321
                         FAME Biodiesel                678         343          1,057      1,501   2,325     2,052     2,019 2,140
                         Total N-E RD                   0            9           103        488     591       615       943   1,587
                         Total Biogas                   0            0             3         53     189       304       427    618
                                 Total               10,517      13,665        14,753     16,155 17,895     18,049    16,169 20,407
              a
                  Fuel volumes correspond to total net generation EPA RIN data divided by the fuel’s equivalence factor.
              b
                  2020 is the assumed 12-month production total of biofuels based on the 9 months (January – September 2020) data available.

2
    Fuel volume is derived from the RIN generation data provided by EMTS.
    https://www.epa.gov/fuels-registration-reporting-and-compliance-help/rins-generated-transactions

5    |   GHG Reductions from the RFS2                                                                                        Copyright © 2021
2. Land Use Change
The Land Use Change (LUC) reflects the net change in carbon stocks associated with expansion
of crop production as well as indirect effects that are induced by the demand for feedstocks. LUC
is an important, but controversial, element of a biofuel’s life cycle impact, including the direct
emissions associated with land conversion to agricultural fields and indirect emissions associated
with economic impacts induced by the change to land use.
EPA, ARB and ANL have developed estimates for LUC estimates from biofuels production.
These are summarized in Table 3. The development of LUC estimates is discussed in detail in
the 2014 Marginal Emissions report (Boland, 2014). This analysis uses the best estimate for each
biofuel category shown here to calculate the total emissions from the production of that biofuel.
Table 3. LUC Emissions Estimates from Biofuels
Corn Sorghum Corn Sugarcane Soybean Canola Palm Tallow Corn
Policy EtOH Ethanol Stover Ethanol BD/RD BD/RD BD BD/RD BD
LUC (g CO2e/MJ)
2009 ARB 30 n/a 0 46 62 31 n/a 0 0
2010 EPA 28 13.1 -1.3 5.41 18.3 ~15 48.2 0 0
2014 ARB 19.6 19.4 0 11.8 29.1 14.5 71.4 0 0
ANL/CCLUB 7.6 n/a -1.1 n/a n/a n/a n/a 0 0
Best Estimate 7.4 7.6 -1.1 11.8 18.3a 14.5 48.2 0 0b
a
The ILUC associated with soy BD is consistent with the crop yield per acre. If ILUC per acre of corn is
the same as ILUC per acre of soybeans, then ILUC for soybean-based BD or RD is about twice that of
corn ethanol depending upon the displacement value of co-products from ethanol and soybean meal. The
RFS and LCFS values for soybean and canola ILUC are used as a conservative assumption. The ILUC
values for BD and RD should differ slightly depending on oil to fuel yield but these values are assumed
invariant with biomass-based diesel type.
b
Several approaches are available to assigning ILUC to ethanol and corn oil used for biodiesel
production. The California ARB assigns all of the ILUC to ethanol and this approach is followed here.
6 | GHG Reductions from the RFS2 Copyright © 20213. Carbon Intensity of Corn Ethanol and Biofuels production Ethanol represents the largest volume of renewable fuel produced and consumed in the U.S. The Marginal Emissions report (Boland, 2014) developed aggregated weighted CI estimates for the corn ethanol produced in the U.S. based on the installed capacity shown in Table 4. The installed capacity is based on the production cases described in the EPA Regulatory Impact Analysis (EPA, 2010). The capacity per plant type (including projections for capacity expansions) was used to model the trend in corn ethanol production for RFS operational years of 2008 through to 2020. Important developments in the mix of corn ethanol technology include the following: • Rapid adoption of corn oil extraction for dry mill plants (95% by 2020) • Introduction of corn fiber/kernel fiber/stover in 38 plants by 20203 • Growth in the use of low CI biogas as process fuel • Elimination of coal as fuel for dry mill ethanol plants 3 While EPA has not approved corn fiber petitions, 38 pathways have been approved by the California ARB. This technology results in about a 3% increase in ethanol production capacity. The adoption rate should grow to 50 plants by 2025. 7 | GHG Reductions from the RFS2 Copyright © 2021
Table 4. Corn Ethanol Production Capacity and Technology Aggregation
    Plant Energy Source,                      Capacity (Million Gallons per Year)
    Aggregated data   a,b        2008    2010      2012     2014     2016     2018  2020
    Wet Mill, Coal               1,888 1,877      1,893 1,474        1318     1162   745
    Wet Mill, NG                  107     328       473      854     1,100    1312   538
    Dry Mill, Coal                 54      36        19       15       0         0     0
    Dry Mill, NG, DDGSc          2,919 2,366      1,812 1,613        1,600     500   522
    Dry Mill, NG, WDGSc          1,442 1,178        913      903      900      230   183
    Dry mill, corn oil DDGS      1,946 4,617      5,471 5,336        7,000    8,500 9,917
    Dry mill, corn oil, WDGS      961    2,145    2,728 2,589        2,700    3,000 3,484
                             d
    Dry Mill, CRF/green corn      325     361       397      461      700      800   965
                             e
    Dry Mill, Biogas/Biomass      195     250       305      360      415      470   525
    Corn Stover/Fiberf              0       0         0      0.73      4        10    55
    Total Corn Ethanol           9,837 13,158 14,011 13,606 15,737 15,984 16,883
a
  EPA Regulatory Impact Analysis (RIA)for the final Transport Rule.(EPA, 2009)
bP
   rojections in consultation with industry experts.
c
  The rapid adoption of corn or extraction in dry mill ethanol plants has penetrated most of the market due to the
improvement in energy consumption, reduction in GHG emissions, and production of corn oil. Total corn oil
biodiesel from EIA data corresponds to 0.13 lb of corn oil per gallon of ethanol, which is about half of the potential
yield. The balance of corn oil is used as animal feed.
d
  Corn replacement feed (CRF) and low GHG corn farming can reduce GHG emissions by producing additional co-
product credit and implementing low impact farming practices. The introduction of lower emission corn is projected
based on projections from industry analysts. (ACE, 2018).
e
  6 ethanol plants with biogas or biomass process fuel have approved LCFS pathways.
f
  38 corn fiber/stover/kernel fiber ethanol pathways were approved under CA LCFS in 2020. Assume corn fiber
ethanol is an additional 3% of plant capacity.

Other emission reduction strategies include the use of corn replacement feed from stover and
improved farm practices. Practices such as no till and precision farming have reduced GHG
emissions from corn and these technologies are expanding.

Table 5 shows the representative CI of ethanol produced at each type of production facility
described in the RIA. The CI reflects the ILUC values from the latest GREET model (ANL
2020).

8    |   GHG Reductions from the RFS2                                                    Copyright © 2021
Table 5. Carbon Intensity of Corn Ethanol
Carbon Intensity (g CO2 e/MJ)
Corn Ethanol Production Type 2008 a 2015 a 2018 a 2020b
Wet Mill, Coal 97.35 93.07 90.44 88.69
Wet Mill, NG 77.35 73.34 70.84 69.17
Dry Mill, Coal 67.61 63.38 N/A N/A
Dry Mill, Average 64.27 56.04 54.55 54.11
Dry Mill, NG, DDGS 60.80 58.72 58.72 58.67
Dry Mill, NG, WDGS 54.38 48.78 48.78 49.88
Dry mill, corn oil DDGS 63.82 58.26 57.35 56.74
Dry mill, corn oil WDGS 54.92 49.79 49.79 49.78
Dry Mill NG, CRF 49.37 41.14 39.65 38.36
Dry Mill, Biomass/Biogas 38.00 34.14 30.00 28.15
a
CI values from 2018 RFS Update (Unnasch 2018). CI of corn, electricity mix, and other life cycle factors have
changed since then.
b
Based on GREET1_2020 model. Data from GREET1_2020, provided energy inputs data to these calculations.
Data from California LCFS pathways provide insight to corn fiber and biomass based – based pathways. GREET
CCLUB estimates for ILUC included in this table.
Similar to ethanol, estimates for the production of bio- and renewable diesel were based on the
feedstock use per fuel. The U.S. Energy Information Agency (EIA) provides inputs on the U.S.
feedstock inputs into biodiesel production (EIA, 2015). The production volumes for modelled for
the years 2008 through to 2020. The biodiesel feedstock production volumes are shown in
Table 6.
Table 6. Feedstocks for U.S. Biodiesel Production
Product 2008 2010 2012 2014 2016 2018 2020
Total BDa 678 343 1,056 1,501 2,325 2,052 2,019
Canola oil 59 30 91 130 133 149 126
Corn oil 72 36 111 158 153 245 176
Palm oil 16 8 26 37 56 0 0
Soybean oil 360 182 561 797 1,619 1,212 1452
Tallow/Poultry 42 21 65 92 133 151 118
UCO 130 66 202 288 231 295 147
a
Total BD volumes based on EPA-reported RINs. Split among oil types based on EIA data.
Similar estimates for the renewable diesel feedstocks were developed from the study of
hydrogenation derived renewable diesel as a renewable fuel option in North America (Lambert,
2012). The biogas feedstocks are primarily landfill gas and wastewater treatment facility biogas.
Biogas from anaerobic digestion of food waste and manure is also a source of biogas for CNG.
9 | GHG Reductions from the RFS2 Copyright © 2021Table 7 shows the volumetric weighted carbon intensity estimates (developed by weighting the production capacity with the CI for each technology/feedstock) for the each of the biofuel categories included in the RFS2. The table also shows the assumed minimum reduction threshold CI for the RFS2 for each fuel type. More recent studies of petroleum GHG emissions also indicate that the estimates for the original 2005 petroleum baseline in fact somewhat higher (EIA, 2013; Elgowainy, 2014; Unnasch, 2009). 3.1 Fuel Impacts In addition to displacing higher GHG fossil fuels, alternative fuels have several other impacts on the transportation system. High octane ethanol allows to produce less energy intense hydrocarbon blending components and results in higher efficiency in high octane fuels. Renewable diesel results in an ultra-low sulfur fuel with a high cetane number that helps refiners meeting fuel specifications. These factors contribute to the overall GHG benefit of renewable fuels. Fuel Efficiency and Octane Reformulated gasoline is produced by blending a hydrocarbon component for oxygenate blending (BOB) with ethanol. To produce regular gasoline with an Anti-Knock Index (AKI) (R+M)/2 octane of 87 an 84 octane BOB is blended with ethanol4. Refiners take advantage of ethanol’s octane produces a BOB with few high-octane components. Typically, the reformer is operated at a lower severity or less blending from alkylation units contribute to the octane of gasoline (Hirshfeld, 2015; Kwasniewski, 2015). Kwasniewski presents the different scenarios on a GHG intensity basis with a difference of 1 g CO2e/MJ of gasoline between E10 and zero ethanol blending cases. The result is consistent with the energy intensity in a paper from Argonne National Laboratory (Elgowainy, 2014)5. 4 The AKI for ethanol is 99.3 (Pearson, 2015) but its blending octane number at 10% level is 114. 5 For example, alkylation units require 1.2 MJ input per MJ gasoline compared with 1.03 MJ/MJ for crude distillation. Displacing the higher energy intensity component with ethanol reduces the CI of the BOB. 10 | GHG Reductions from the RFS2 Copyright © 2021
Table 7. Carbon Intensity Estimates of All Biofuels and RFS GHG Reduction Threshold (g CO2e/MJ)
    Fuel                                Threshold      2008      2010      2012   2014      2016     2018     2020a                        2025
    Ethanol, D6                             74.5        66.3      63.6      62.0  58.6       56.5     55.1     53.2                        53.2
    Biodiesel, D6                           74.5        71.8      71.5      71.5  71.5       90.0     90.0     90.0                        90.0
    Non-Ester RD, D6                        74.5        90.0      90.0      90.0  90.0       90.0     90.0     90.0                        90.0
    Ethanol, D5                             46.5        41.9      42.1      42.1  42.2       39.6     39.6     38.0                        38.0
    Biogas, D5                              46.5        25.6      24.4      24.4  23.8       23.3     23.3     21.0                        21.0
    Non-Ester RD (EV 1.6)                   46.5        46.4      46.4      46.5  46.2       46.2     46.2     44.4                        44.4
    Non-Ester RD (EV 1.7)                   46.5        46.4      46.4      46.5  46.2       45.9     45.9     43.8                        43.8
    Bio-Naphtha                             46.5        46.4      46.4      46.5  46.2       45.9     45.9     33.1                        33.1
    Biodiesel                               46.5        42.5      42.1      42.3  42.2       41.9     41.9     38.5                        38.5
    Non-Ester RD (EV 1.5)                   46.5        35.0      35.0      35.0  35.0       35.0     35.0     34.8                        34.8
    Non-Ester RD (EV 1.6)                   46.5        35.0      35.0      35.0  35.0       35.0     35.0     34.8                        34.8
    Non-Ester RD (EV 1.7)
                                            46.5        35.0      35.0      35.0  35.0       35.0     35.0     34.8                        34.8
    Soy/Tallow
    Ethanol, Cellulosic                     37.2        37.2      37.4      37.8  38.4       33.5     30.0     28.5                         28.5
           b                                37.2        25.6      24.4      24.4  23.8       23.3     23.3     16.9                         12.0
    RCNG
    RLNG                                    37.2        29.6      28.3      28.3  27.6       27.0     27.0     20.6                         15.7
    Renewable Gasoline                      37.2        28.0      27.0      27.0  26.6       26.1     26.1     22.6                         22.6
    Non-Ester RD, D3                        37.2        28.0      27.0      27.0  26.6       26.1     26.1     26.1                         26.1
    US Electricity                                     204.6     182.5     182.5 170.3      159.9    159.9    159.9                        159.9
    Denaturant                                          81.0      81.0      81.0  81.0       81.0     81.0     81.0                         81.0
    Gasoline Blendstock                    93.08        96.7      96.8      96.9  97.0       97.2     97.3     97.5                         97.5
    Diesel                                 93.08        98.7      98.8      98.8  99.0       99.2     99.3     99.9                         99.9
a
    CI for Biodiesel (D6) and NERD (D6) is constant and rounded to equal 90 as CARB gives palm oil diesel the high CI equal to gasoline.
b
    CI for RCNG and RLNG is associated with the growing swine manure farms and digesters.

11   |   GHG Reductions from the RFS2                                                                                    Copyright © 2021
The benefit of blending ethanol on the BOB produced at the oil refiners is examined for E10 and E15. For 87 octane fuels the E10 BOB results in a 1.0 g CO2e/MJ reduction while a BOB formulated for E15 receives a 1.5 g CO2e/MJ GHG reduction, which is proportional to the GHG savings from the ethanol in E10. In this case of E15 a lower octane BOB is possible to produce 87 AKI blended gasoline. In the case of E15 that results in a higher octane, the BOB is assigned the same 1 g CO2e/MJ savings as the E10 BOB as it is the same refined product. The balance of E15 and E85 are estimated to result in higher octane fuels the same gasoline BOB used for E10 blending. All of the BOB for E10 or higher-octane blends is assigned 1 g CO2e/MJ GHG reduction due to the effect on oil refineries. A 5% increase in ethanol will result in an extra octane point while E85 can have an octane number close to 93. Several studies examine the effect of octane on fuel economy. Higher octane allows for an advance in ignition timing and higher turbocharger boost in engines with knock sensors. A 1% to 3% increase in energy economy is consistent with data from the EPA fuel economy guide where fuel consumption is reported or both E10 and E85 vehicles. The improvement in fuel economy from engine testing studies also indicates an efficiency improvement on the order of 1% for a 2- point increase in octane (Shuai, 2013; Stradling, 2015; Leone, 2017). Energy-economy ratio values of 1.005 and 1.02 were estimated for E15 and E85 respectively. The EER represents the energy economy of gasoline (E10) relative to the alternative fuel. 3.2 GHG Calculation Methods GHG emissions were calculated based on the displacement of petroleum fuels. The aggregate mix of biofuels as well as crude oil resources provided the basis for GHG calculations. Displaced gasoline and diesel are calculated for each category of biofuel. In the case of ethanol, the effect on octane blending is also calculated. The net change in GHG emissions corresponds to the aggregation of each component fuel in the RFS. GHG emissions were calculated for each fuel category in equations 1, 2, and 3. GHG from alternative fuel = Fuel volume × LHV × CI for each fuel (1) The denaturant component of ethanol is calculated separately along with the biofuels Displaced emissions correspond to severe effects including: Alternative fuel volume × EER × LHV × CI for each fuel (2) In the case of E15, E85, and CNG the EER values in this study are 1.005, 1.02, and 0.9 respectively BOB volume associated with achieving 87 octane fuel × LHV × 1 g CO2e/MJ savings (3) 12 | GHG Reductions from the RFS2 Copyright © 2021
For biodiesel and renewable diesel, the petroleum baseline fuel is diesel. Biogas displaces a mix
of gasoline and diesel with a more conservative EER of 0.9 assumed for diesel displacement.

Net GHG emissions are calculated based on the CI of the renewable fuel minus the displaced
fuel. In the case of ethanol, additional octane blending benefits are included as part of the
impact. Table 8 provides an example for 1 billion gallons of ethanol with two CI value deployed
either as E10 or E15. In the case of E10, 1 billion gallons corresponds to 81,224 TJ of energy
and displaces the same energy in the BOB. For the E15 example here, half the ethanol displaces
a proportional quantity of BOB. The other half of the E15 (500 million gallons) results in an
EER of 1.005 and displaces more BOB. The effect on octane blending is also shown for each
fuel volume.

Table 8. Carbon Intensity Estimates of All Biofuels plus EPA Minimum Threshold
                                    E10 87 Octane          E15 87 Octane          E15 88 Octane
                                    TJ       Gg GHG         TJ     Gg GHG          TJ    Gg GHG
Energy Inputs and Emissionsa
10% Wet Mill Coal Ethanol          8,122        720       4,061       360        4,061       360
90% Dry Mill WDGS
Ethanol                           73,101       3,639     36,551      1,819      36,551      1,819
Total Ethanol                     81,224       4,359     40,612      2,180      40,612      2,180
EER                                   1                     1                    1.005
Displaced BOB                     -81,224      -7,862   -40,612     -3,931     -42,515     -4,115
Total BOB                       1,080,000              340,000                 340,000
Refinery Octane                 1,080,000      -1,080  340,000       -510      226,667      -227
Net Emissions                                  -4,583               -2,262                 -2,162
Fuel Volume
   Ethanol (B gal)                    1                    0.5b                   0.5b
   RFG (B gal)                       10                    3.33                   3.33
a
  CI of Wet Mill Coal, Dry Mill WDGS, and BOB are 88, 49, and 96.8 g CO2e/MJ respectively.
Octane blending effect of E10 and E15 are 1 and 1.5 g CO2e/MJ respectively.
b
  50% of the billion gallons of ethanol in the E10 example are calculated for an 87 octane and 88
octane strategy. In the 88 octane calculation the BOB receives a lower octane blending credit
while displacing more BOB.

3.3       Avoided GHG Emissions
The avoided GHG emissions are calculated from the reduction in CI from the revised petroleum
baseline, as developed by Boland et al. (Boland, 2014). Figure 4 shows the total CO2 savings, in
million metric tonnes per year (Million tonne/yr) from the inclusion of ethanol in the RFS2.

Key changes in fuel volume include a growth in the production capacity of renewable diesel and
biogas from animal waste.

13    |   GHG Reductions from the RFS2                                    Copyright © 2021
The effect of different levels of E15 in 2025 are also examined using the approach outline
previously assuming that 50% is blended at 87 octane and the balance results in higher octane
fuel. 51% E15 in a gasoline pool of 138 billion gallons per year could be achieved with the
current corn ethanol capacity in the U.S. of 17.46 billion gallons per year7. Note that the scenario
for E15 shown here for 2025 uses more than the 15 billion gallons of D6 ethanol required under
the RFS2. E15 results in additional GHG reductions because more ethanol is consumed as fuel
and it enables the production of a lower octane BOB.
Figure 5 shows the CO2 saving from all other biofuels. Since ethanol is thus far the major
component of the RFS2, the majority of CO2 savings are due to the ethanol fuels. Figure 6 shows
the total CO2 reductions of the RFS2 based on the analysis presented here. The base RFS
assumptions are also shown in the graph, where the biofuels meet the minimum CI threshold
mandated in the RIA (EPA, 2009) and as shown in Table 7. The RFS2 has resulted in the
cumulative CO2 savings of 980 million metric tonnes over the period of implementation (till
2020). The CO2 savings as calculated from the minimum CI threshold base assumptions outlined
in the RIA (EPA, 2009) results in the cumulative CO2 savings of 593 million metric tonnes of
CO2.
Figure 4. GHG Savings from Ethanol
6
US fuel ethanol production capacity for the year 2020.
https://www.eia.gov/petroleum/ethanolcapacity/index.php
7
EIA projects 9 million bbl/d of gasoline consumption in 2022 or 138 billion gallons per year. 29% of ethanol as
E15 could be achieved with U.S. ethanol production capacity for 150 billion gallons per year of gasoline
consumption.
14 | GHG Reductions from the RFS2 Copyright © 2021Figure 5. GHG Savings from Other RFS2 Biofuels (Excluding Ethanol).
Figure 6. GHG Savings from the RFS2 Program
15 | GHG Reductions from the RFS2 Copyright © 20214. Conclusions
The RFS2 has resulted in GHG emissions reductions, which exceed the original projections from
the 2010 final Rule. The increased GHG reductions are due to the following:
1. Corn ethanol has adopted technology improvements, which results in greater than the
20% reduction in GHG emissions originally required under the RFS.
2. Petroleum GHG emissions are higher than the baseline projected by EPA.
3. The mix of other renewable fuels has also contributed to additional GHG reductions even
though cellulosic ethanol targets in the original rule have not been met.
Biofuels have achieved and exceeded the GHG reductions estimated by EPA. The reductions are
greater than the categories within the RFS2 because technology improvements have resulted in
reductions in energy use and the RFS categories characterize typical renewable fuels. These
categories were not intended to represent the weighted GHG reductions of all fuels produced
under the rule.
16 | GHG Reductions from the RFS2 Copyright © 20215. References
ACE (2018). American Coalition for Ethanol. The Case for Properly Valuing the Low Carbon
Benefits of Corn Ethanol.
ARB (2020). Calculation of 2019 Crude Average Carbon Intensity Value.
https://ww2.arb.ca.gov/sites/default/files/classic//fuels/lcfs/crude-
oil/2019_crude_average_ci_value_final.pdf Accessed January 13, 2021.
ANL. (2020). GREET: The Greenhouse Gases, Regulated Emissions, and Energy Use in
Transportation (GREET) Model. Argonne National Laboratoty, http://greet.es.anl.gov.
Boland, S., & Unnasch, S. (2014). Carbon Intensity of Marginal Petroleum and Corn Ethanol
Fuels.
EIA. (2013). Crude Oils have Different Quality Characteristics. Today in Energy. U.S. Energy
Information Agency. Retrieved from
https://www.eia.gov/todayinenergy/detail.php?id=7110
EIA. (2015). Monthly Biodiesel Production Report. U.S. Energy Information Agency.
El-Houjeiri, H. M., Masnadi, M. S., Vafi, K., Duffy, J., & Brandt, A. R. (2017). Oil Production
Greenhouse Gas Emissions Estimator (OPGEE) v2.0b. Stanford University. Dept. of Energy
Resources Engineering. Retrieved from https://eao.stanford.edu/research-areas/opgee
Elgowainy, A., Han, J., Cai, H., Wang, M., Forman, G. S., & Divita, V. B. (2014). Energy
efficiency and greenhouse gas emission intensity of petroleum products at U.S. Refineries.
Environmental Science and Technology, 48, 7612–7624. http://doi.org/10.1021/es5010347
EPA. (2009). Draft Regulation of Fuels and Fuel Additives: Renewable Fuel Standards.
EPA. (2010). Renewable Fuel Standard Program (RFS2) Regulatory Impact Analysis. Report
Number: EPA-420-R-10-006. U.S. Environmental Protection Agency. (U. S. E. P. Agency,
Ed.). Washington, DC. Retrieved from
http://www.epa.gov/otaq/renewablefuels/420r10006.pdf.
Gordon, D. (2012). The carbon contained in global oils The carbon contained in global oils,
(December).
Gordon, D., Brandt, A., Bergerson, J., & Koomey, J. (2015). Know Your Oil: Creating a Global
Oil-Climate Index. Retrieved from http://carnegieendowment.org/2015/03/11/know-your-
oil-creating-global-oil-climate-index
Lambert, N. (2012). Study of Hydrogenation Derived Renewable Diesel as a Renewable Fuel
Option in North America Final Report Natural Resources Canada. Ontario.
Mueller, S. (2010). Detailed Report : 2008 National Dry Mill Corn Ethanol Survey.
Pearson, R. J., Turner, J. W., Bell, A., De Goede, S., Woolard, C., & Davy, M. H. (2015). Iso-
stoichiometric fuel blends: characterisation of physicochemical properties for mixtures of
gasoline, ethanol, methanol and water. Proceedings of the Institution of Mechanical
Engineers, Part D: Journal of automobile engineering, 229(1), 111-139.
Scully, M. J., Norris, G. A., Falconi, T. M. A., & MacIntosh, D. L. (2021). Carbon intensity of
corn ethanol in the United States: state of the science. Environmental Research Letters.
17 | GHG Reductions from the RFS2 Copyright © 2021Shuai, S., Wang, Y., Li, X., Fu, H. et al., "Impact of Octane Number on Fuel Efficiency of
Modern Vehicles," SAE Int. J. Fuels Lubr. 6(3):702-712, 2013,
https://doi.org/10.4271/2013-01-2614
Stradling, R., Williams, J., Hamje, H., & Rickeard, D. (2016). Effect of octane on performance,
energy consumption and emissions of two Euro 4 passenger cars. Transportation Research
Procedia, 14, 3159-3168.
Unnasch, S., Wiesenberg, R., Sanchez, S. T., Brand, A., Mueller, S., & Plevin, R. (2009).
Assessment of Life Cycle GHG Emissions Associated with Petroleum Fuels. Life Cycle
Associates Report LCA-6004-3P. 2009. Prepared for New Fuels Association. Retrieved
from http://www.newfuelsalliance.org/NFA_PImpacts_v35.pdf
18 | GHG Reductions from the RFS2 Copyright © 2021You can also read