PETROPAVLOVSK PLC
Investor Presentation
April 2019
←
→
Page content transcription
If your browser does not render page correctly, please read the page content below
PETROPAVLOVSK PLC Investor Presentation April 2019
Cautionary and Forward-looking Statements

— Some statements contained in this presentation or in documents referred to in it are or may be forward-looking statements, including
  references to guidance. Such statements reflect the Company’s current views with respect to future events and are subject to risks,
  assumptions, uncertainties and other factors beyond the Company’s control that could cause actual results to differ from those
  expressed in such statements. Although the Company believes that such forward-looking statements, which speak only as of the date
  of this presentation, are reasonable, no assurance can be given that they will prove to be correct. Therefore, you should not place
  undue reliance on these statements
— There can be no assurance that the results and events contemplated by the forward-looking statements contained in this presentation
  will, in fact, occur. The Company will not undertake any obligation to release publicly any revisions to these forward-looking
  statements to reflect events, circumstances or unanticipated events occurring after the date of this presentation, except as required by
  law or by any appropriate regulatory authority. Nothing in this presentation or in documents referred to in it should be considered as a
  profit forecast.
— The past performance of the Company and its securities is not, and should not be relied on as, a guide to the future performance of
  the Company and its securities
— This presentation does not constitute, or form part of or contain any invitation, recommendation or offer to any person to underwrite,
  subscribe for, buy, sell, otherwise acquire, exchange or dispose of any shares or securities in the Company or advise persons to do
  so in any jurisdiction, including, but not limited to, the Russian Federation, nor shall it, or any part of it, form the basis of or be relied on
  in any connection with or act as an inducement to enter into any contract or commitment therefore or engage in any other investment
  activity. In particular, this presentation and the information contained herein are not an offer of securities for sale in the United States.
  This presentation does not constitute an advertisement of any securities in the Russian Federation
— No reliance may be placed for any purpose whatsoever on the information or opinions contained in this presentation or on its
  completeness and no liability whatsoever is accepted for any loss howsoever arising from any use of this presentation or its contents
  or otherwise in connection therewith.
— The development and production plans and estimates set out herein represent the current views of the Company's management. The
  Company’s Board reviews the production estimates on an ongoing basis. All planning is subject, inter alia, to available funding and
  capital allocation decisions

— English law and English courts will have exclusive jurisdiction over any disputes arising from or connected with this presentation

                                                                                                                                               2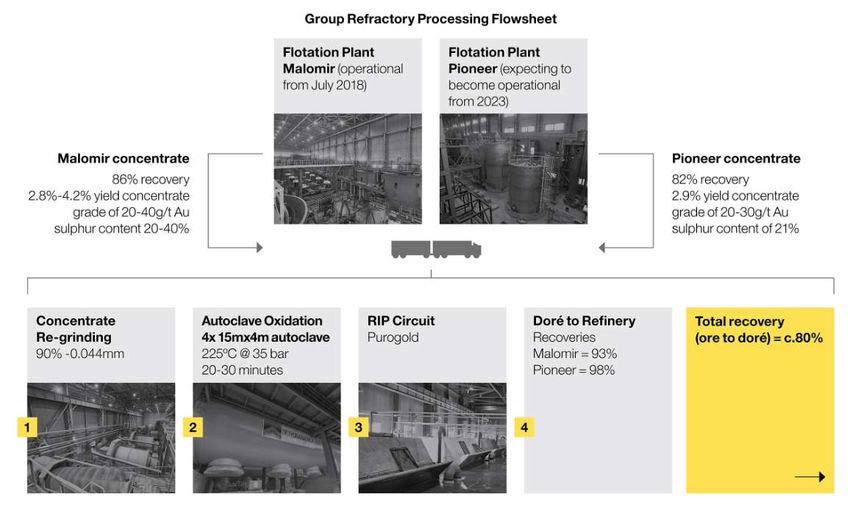
Introduction

3
qwas
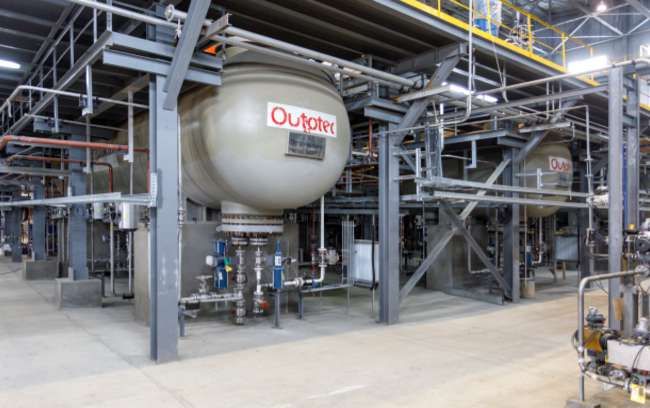
Top 5 Russian Gold Miner With One Of Only Two Pressure Oxidation Plants
Vertically integrated gold mining business, operating throughout the entire mining cycle
3 x gold mines, mix of open pit + underground, c.7.1Moz of gold produced to
date(1)
8.21Moz of JORC Reserves, 20.52Moz of JORC Resources(2)
c.14Mtpa of RIP processing capacity
FY2019F gold production c.450-500Koz, with growing contribution from refractory
ore treatment
Pressure Oxidation (POX) Hub successfully commissioned in Q4 2018
Experienced management team + skilled workforce
Significant untapped exploration potential, with combined licence area
c.2,600km2
31% equity interest in low cost Hong Kong listed iron ore producer IRC Ltd.
(US$153m market cap)(3)
(1) As at 31 Dec 2018, incl. historical production from our alluvial operations and JVs (2) As at 31 Dec 2018, in accordance with the JORC Code.
Resources (M,I&I) are incl. of Reserves (3) IRC market capitalisation as at close 26 April 2019 (US$153m, source: Bloomberg) x Petropavlovsk’s 4
equity interest (31.1%) = US$48m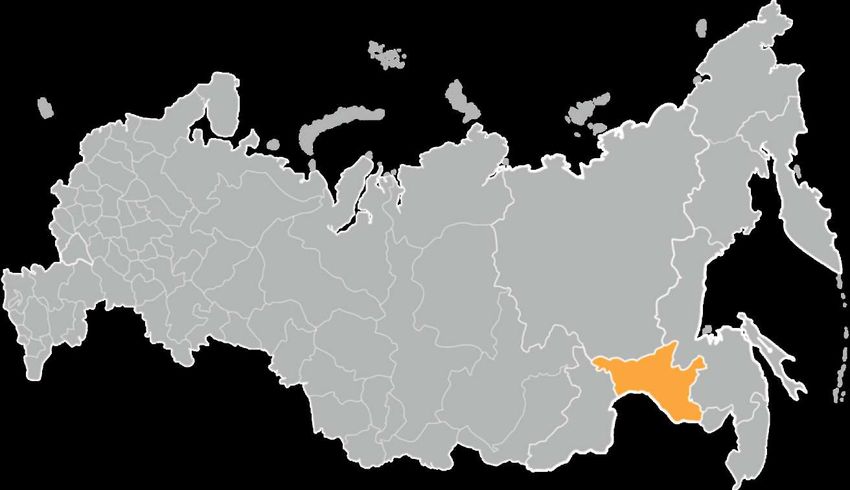
Company Snapshot (1/2)
Proven track record of execution from exploration and development to mining and processing
Brief Overview                                                                                                 FY 2018 Russian Gold Mine Production
—   Petropavlovsk is one of Russia’s major gold mining companies with assets located in the
    Amur region, the Russian Far East
                                                                                                                                                               Polymetal, 14%
—   Founded in 1994, accounted for c.6% of Russia’s total gold production in 2018                           Polyus, 35%
—   Total JORC Resources 20.5Moz(1) including 8.2Moz of Reserves                                                                                                 Kinross Gold, 7%
—   Petropavlovsk has 4 production sites, including the technically advanced Pressure Oxidation
    (POX) Hub, launched Q4 2018                                                                                                                                  Uzhuralzoloto, 7%
—   In 2018, produced 422Koz of gold, generating US$500m of revenue and US$143m of EBITDA
—   The company holds 31% share in IRC Ltd, a Hong Kong listed premium grade iron ore                           Other, 32%                                       Petropavlovsk, 6%
    producer
—   After listing on AIM in 2002, Petropavlovsk moved to the Main Market of the LSE in 2009

                                   Mining + Production Facilities                                                                                  JORC Resources(1)
               —    One of the largest gold mines in Russia in terms of mineral resources(2)
               —    Acquired as a greenfield in 2003. Licence area of c.75km2
Malomir        —    RIP plant throughput: 3.0Mtpa, commissioned 2010                                                   Ca tegor y 1
                                                                                                                                                         97%                3%     6.9Moz
               —    Flotation plant with current stage I capacity of 3.6Mtpa launched H2 2018
               —    Stage 2 will increase capacity to 5.4Mtpa via addition of third 1.8Mtpa line

               —    One of Russia’s largest gold mines in terms of processing capacity
               —    Acquired as a greenfield in 2001. Licence area of c.1,300km2
Pioneer        —    Expected >15 year life of mine
                                                                                                                        Ca tegor y 1
                                                                                                                                                  76%               24%      5.9Moz
               —    RIP plant throughput: 6.7Mtpa, commissioned 2007

               —    The Group’s newest mine with an expected >15 year mine life
Albyn          —    Acquired 2005 as a greenfield. Licence area of 1,053km2                                                 Ca tegor y 1
                                                                                                                                           21%           79%              5.4Moz
               —    RIP plant throughput: 4.7Mtpa, commissioned 2011

               —    The Group’s oldest mine, now closed, and which has been converted to host the Pressure
Pokrovskiy                                                                                                                                                     Refractory Resources
                    Oxidation (POX) Hub and supporting infrastructure                                                       Ca tegor y 1
                                                                                                                                           100% 0.9Moz
               —    Historically has produced c.2.0Moz of gold                                                                                                 Non-Refractory Resources

                          (1)Total JORC Resources as at 31 Dec 2018, in accordance with JORC Code. Resources (M,I&I) are inclusive of Reserves. For full details and asset
                          by asset breakdown please refer to the 2018 Petropavlovsk annual report                                                                                     5
                          (2) Based on management estimates
Company Snapshot (2/2)
Gold mining business supported by a range of complementary in-house service companies
Operating mine Analytical labs
Underground mine R&D
POX Offices Mining assets
London Pioneer
Petropavlovsk Plc
Corporate headquarters St Petersburg Albyn
RDC
Hydrometallurgy Malomir
Pokrovskiy
Moscow
Petropavlovsk Moscow
PHM Engineering
Blagoveschensk (Amur region)
Regis Exploration
Kapstroi Construction
Irkutsk
Irgiredmet Institute
IRC Ltd. (associate company)
6Investment Highlights
1
One of the major gold mining companies in Russia
2
Experienced management team + skilled workforce, in-house technical expertise
and R&D facilities
3
Efficient mining + processing operations
4
Potential to grow production via refractory ore processing at the
Pressure Oxidation (POX) Hub
5
Strong track record of mine development, expansion + asset optimisation
6
Strategic location + access to developed infrastructure
7
Exploitable + long life mineral resource base with high expansion potential
7FY 2018 Highlights
2018 Highlights
Restoring leadership and progressing growth ambitions

Commissioning of the POX Hub + Malomir flotation plant              Improved operating performance

— Unlocks value embedded in c.5.3Moz of refractory reserves         — H2 2018 operational turnaround enabled FY 2018 targets to be
                                                                      met: production in line with guidance, costs reduced
— Significantly increases optionality of the Group to process own
  refractory ores or treat 3rd party material                       — IRC: ongoing ramp-up of K&S

— Production growth to resume in 2019, from higher grades +
  material contribution from POX

Balance sheet de-risking                                            Board and management teams strengthened
— New US$240m facility signed between Gazprombank and IRC,          — Leadership restored: return of Dr Pavel Maslovskiy as CEO
  payment schedule aligned with K&S ramp-up
                                                                    — Additions of Sir Roderic Lyne (Non-Executive Chairman),
— New gold sales agreement for c.175Koz signed                        Robert Jenkins, James Cameron Jr , Damien Hackett, Harry
                                                                      Kenyon-Slaney (Independent Non-Executive Directors) + Bektas
— Ongoing de-leveraging / reduction in net debt                       Mukazhanov (Non-Executive Director)
                                                                    — Board fully compliant with UK Corporate Governance Code

                                                                                                                                  9
Key Achievements in 2018
Following a disappointing H1 2018, recovery is underway with strong H2 2018 under new
leadership
— Production of 422Koz Au (incl. 52Koz of gold in high-grade refractory concentrate), in line
Production + Costs with guidance
— H2 2018 TCC of US$650/oz, down 28% vs. H1 2018 (US$899/oz)
— Malomir: following flotation plant commissioning in July, c.46Kt of high-grade refractory
concentrate produced (c.36g/t), for POX processing
— Material improvement in flotation flowsheet à c.50% increase in concentrate grade
Malomir Flotation + vs. initial design and 50% – 60% decrease in concentrate yield
POX Hub
— POX Hub: autoclaves 1 + 2 commissioned Q4 2018, ahead of schedule
— Smooth ramp-up, first gold poured Dec 2018
— 3rd party refractory concentrate being acquired
— Resources of 20.5Moz Au with Reserves of 8.2Moz Au
Exploration — Reserves increased by 0.6Moz despite depletion to 8.2Moz due to new discoveries at
Pioneer + Malomir
— Net Debt reduced by US$17m to US$568m
Other
— IRC: increased production volumes + higher EBITDA
10FY 2018 Financials
FY 2018 Financial Results
Performance impacted by scheduled inventory build and sub-optimal H1 2018

                                                                                                     Units               2018         2017     Change

Gold production                                                                                       Koz                422.3 (1)   439.6      (4%)
Gold sold                                                                                             Koz                369.6       439.8     (16%)
Avg. realised gold price                                                                            US$/oz               1,263       1,262      0%
Group revenue                                                                                        US$m                499.8       587.4     (15%)

Total cash costs (TCC)                                                                              US$/oz                786         741       +6%
All-in sustaining costs (AISC)                                                                      US$/oz               1,117        963      +16%

Underlying EBITDA                                                                                   US$m                 143.0       196.8     (27%)
Operating profit                                                                                     US$m                126.6       100.4     +26%
Profit before tax                                                                                    US$m                 82.4        48.9     +69%
Profit for the period                                                                                US$m                 25.9        37.1     (30%)

Net cash from operating activities                                                                   US$m                217.2       124.0     +75%

Net debt (as at 31 Dec)                                                                             US$m                 (568.0)     (585.1)    (3%)

Development capex                                                                                   US$m                 112.8        66.2     +70%
Exploration capex                                                                                    US$m                 21.6        21.9      (1%)

Note: (1) Incl. c.52Koz of gold contained in high-grade refractory concentrate produced by the Malomir flotation plant

                                                                                                                                                       12
FY 2018 Total Cash Costs (TCC)
TCC within guided range of US$750/oz – US$800/oz, despite difficult H1 2018
US$/oz 48 0.2
3 91
123 39
741 +6% 786
TCC FY2017
TCC FY2018
Deferred stripping
Co-product effect
Changes in grades
Other taxes
Higher costs
FX
/ recoveries
— TCC affected by inflation of some RUB denominated costs, higher volumes of stripping + suboptimal organisation of
mining works in H1 2018, partially mitigated by higher processed grades (Pioneer, Malomir), higher recoveries (Pioneer,
Albyn, Malomir) + effect of RUB depreciation
13Precious metals operating cash expenses 2018 vs. 2017
Cash expenses -3% yoy as inflation of certain RUB denominated costs (electricity, diesel) was
somewhat offset by the effect of RUB depreciation
Precious Metals Operating Cash Expenses Structure
FY2017 FY2018
Consumables Consumables
+ +
Other Labour Labour
Other
Materials 23% 22%
Materials
34% 31%
Fuel
Fuel 15%
Total 14% Total
US$313.4m(1) US$302.7m(2)
Consumables + Other Other
Other 7% 8%
Materials
37% Electricity Electricity
10% 9%
External Services External Services
12% 15%
2018 2017 Change
Avg. RUB/US$ FX 62.7 58.3 +7%
Avg. Gold PM Fix US$/oz 1,269 1,257 +1%
Note: (1) Before movement in ore stockpiles, GIC and bullion in process of US$19.2m;
(2) Before movement in ore stockpiles, GIC, flotation concentrate and bullion in process of US$55.6m
14FY 2018 Development and Exploration Spend
FY 2018 exploration + development capex totalled US$134.4m
FY2018 Development US$112.8m FY2018 Exploration US$21.6m
Active development continued ahead
of scheduled Q4 commissioning
61.5
Flotation,
tailings, underground
development
Tailings, underground
development, machinery / Pioneer US$10.0m
equipment Malomir US$5.5m
Albyn US$5.0m
Other US$1.1m
Tailings, access road
21.6
19.3 19.1
10.5
2.4
POX Malomir Pioneer Albyn PPE Upgrade Exploration
15US$m
As at 1 Jan 2018
585.1
Capital expenditure
Bridge loans to IRC 134.4
57.0
Interest accrued on borrowings
2018 Change in Net Debt
55.5
Transaction costs in connection
9.0
with bank loans and notes
Interest paid on prepayment on
-3%
6.8
gold sale agreements
Income tax paid
5.0
1.9
Other
Increase in w/c
160.3
Net cash generated by
operating activities before w/c
122.6
changes
As at 31 Dec 2018
568.0
Net Debt down c.3% to US$568m due to an increase in cash + cash equivalents of c.US$15m
16Debt Profile
Net Debt at historical low for the last 7 years - a major part being long term
Debt Repayment Schedule FY 2018 Debt Composition (Nominal)
US$500m notes
maturing Nov Convertible Bond
2022 17%
Total Debt
US$100m
US$600m
convertible bond
issue maturing 500
Mar 2020 Guaranteed
Notes
83%
– 100 –
2019 2020 2021 2022
2020 Convertible Bond 2022 Guaranteed Notes
— Principal amount: US$100m — Principal amount: US$500m
— Coupon: 9% — Coupon: 8.125%
— Maturity: Mar 2020 — Maturity: Nov 2022
— Exchange price: US$0.1253 — Rating: S&P = B-, Fitch = CCC
17Petropavlovsk’s Guarantee of IRC’s New Debt Facilities
A key milestone in de-risking the Group’s finances
The Gazprombank Debt Facility Petropavlovsk Guarantee Structure
— In Dec 2018, K&S (a subsidiary of IRC) entered into a — Comprised of 5 guarantees which fluctuate over life of loan
US$240m facility with Gazprombank
— The current guarantee amount is US$160m comprising a
— Replaces an earlier facility with ICBC on more favourable terms: Corporate and Fixed Term Guarantee
— Extended repayment period through to 2026 — The Corporate Guarantee will be removed subject to certain
operational conditions at the K&S project being met(1)
— Principal repayment skewed to the latter part of the loan
term
— Amortisation schedule better aligned to the ramp-up of Corporate Fixed Term
the K&S iron ore mine Guarantee Guarantee
2019
$40m
2020 $120m
2021
$40m
2022
2023
$40m
2024
2025
$120m
2026
(1)These conditions are considered to be ‘base case’ and the Company expects these will be achieved within a 3 year time-frame
18Q1 2019 Update
Q1 2019 Production Update
 A healthy start to 2019 with c.25% of output attributable to the processing our own refractory ore

    Production in line        — Production / sales of 108Koz - with 28Koz of refractory gold processed at the POX Hub
       with target            — Strong contribution from Malomir underground with grades in excess of 8g/t

     Malomir flotation        — Successful test work carried out on concentrate from lower grade ores: 87% recovery with
  continues to produces
                                better than design concentrate yields (2.8% vs. 5.5%) à lower TCC
refractory concentrate with
   improved parameters        — c.29Kt of concentrate at 28g/t containing 26Koz of gold stockpiled for processing

   POX: Q1 recoveries         — c.32Kt of high-grade concentrate at 32g/t processed via POX Hub
      reached 91%,            — POX recoveries reached 91% in March, targeting 94% in H2 2019
autoclaves 3 + 4 ready for    — Autoclaves 3 + 4 tested + shown to be fully-functioning. Ready to begin operating at full
         launch                 capacity once supply of 3rd party concentrate secured

   Acquisition / trial of
 3rd party concentrate to     — Concentrate successfully trialled from two different sources
 optimise POX utilisation     — 2 x batches of concentrate secured, incl. 17Kt at 65g/t – 75g/t + 20Kt at 40g/t – 60g/t
           rates

     IRC: successful          — New loan facility with Gazprombank on better terms
   refinancing of ICBC        — Petropavlovsk has received c.US$57m as full repayment for 2 x bridge loans advanced to
  project finance facility      IRC in 2018

                                                                                                                            20
Q1 2019 Operations Review
Strong performance let down by water issues at Pioneer(2) – remain on track to meet 2019
guidance
Q1 2019 Au Production by Mine(1) Q1 2019 Production Highlights
Malomir production above budget
— Non-refractory ore via RIP: gold recoveries exceeded
budget by 6.2Koz due to larger quantity of high-grade ore
Malomir (incl. POX) mined from underground + higher recoveries
45Koz (41%)
— Flotation: 25Kt of concentrate produced at avg. grade of
23g/t
— POX Hub: 32Kt of concentrate processed at avg. grade of
Total 32g/t, with 2.8Koz of metal produced above quarterly
production budget
Pioneer
108Koz 22Koz Albyn production above budget
(20%)
— c.200Kt of ore at 1.2g/t was mined above budget, resulting
Albyn in 4.3Koz of production above plan
41Koz (38%)
Pioneer production below budget
— Underground delays caused by persistence of water inflow
+ lower grade material from open pit(2)
— Production 6.7Koz below budget
Company remains on course to meet FY2019 guidance
(1) Percentages may not add up due to rounding
(2) At Pioneer, all water has been pumped out of mine, cement backfill has been implemented and pump size increased 212019 Outlook
222019 Outlook
Guidance has improved following successful commissioning of POX Hub
— Targeting 450Koz – 500Koz Au, an increase vs. 2018 due to contribution from POX Hub facility (incl.
gold in concentrate stockpiles from FY 2018), but excluding potential upside from 3rd party concentrate
Gold processing
production — c.125Kt – 145Kt of refractory concentrate expected to be produced by Malomir flotation plant at 29gt –
32g/t
— c.155Kt – 175Kt of refractory gold concentrate at 30g/t – 31g/t to be treated at POX Hub
— TCC FY 2019: US$850 – 950/oz, based on a RUB:US$ FX of 66, reflecting additional POX Hub
ramp-up costs
Costs
— Once POX is operating at full production from 2020, TCC expected to normalise at c.15% below 2019
guidance
Capex — US$45m – US$55m, consisting of sustaining, exploration + remaining POX capex
— Autoclaves 3 + 4 to begin operating at full capacity once supplies of 3rd party concentrate secured
Development — Management + Board are considering benefits of accelerating construction of additional flotation lines
at Pioneer / Malomir
De-leveraging — Net debt to continue to fall in line with ramp-up of production + increase in free cash flow(1)
(1) Net debt (unaudited) as of 31 March 2019 reduced to c.US$550m
23Malomir Flotation Plant
24
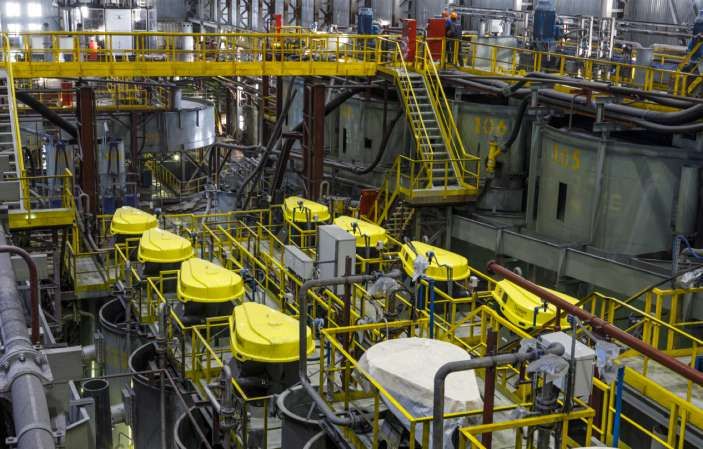
24Malomir Flotation Plant
Production rates expected to increase from Q2 2019 once the Malomir flotation plant begins
processing higher grade material to produce higher grade concentrate
Background Stage 2 flotation plant expansion
— Malomir flotation plant is a two-stage development — Stage 2 will expand Malomir flotation to 5.4Mtpa by adding a
third 1.8Mtpa line to the existing two
— Stage 1: 3.6Mtpa capacity across 2 x 1.8Mtpa processing lines
(line 1 launched Jul, line 2 Oct 2018) — Management considering fast-tracking expansion to maximise
utilisation of POX Hub capacity (currently 2020)
— With both lines ramped-up, the flotation plant produced c.46Kt of
high-grade refractory concentrate with grades of up to 36g/t in
2018
Flotation process flowsheet improvements
— Gold losses reduced: more efficient flotation reagent to suppress
carbon has eliminated need for carbon flotation stage
— c.50% improvement in concentrate grade vs. original design
parameters (c.24g/t vs. c.36g/t – 40g/t)
— Concentrate mass pull improved from 5.5% to c.2.8% (using
lower grade ores), reducing volume of material transported
Tests work has produced 25Kt of concentrate from low grade
material
— Low grade trial material (c.0.7g/t), stripped ahead of accessing
main ore body was processed, achieving concentrate grades of
22g/t – 24g/t at 87% recovery
— Resulting concentrate yield of c.2.8% significantly better vs.
Flotation cells at the Malomir flotation plant
5.5% long-term plan, reducing transport volumes / costs
25The Pokrovskiy POX Hub
Our New Pressure Oxidation (POX) Hub Presents Growth Opportunities
Commissioned in Q4 2018, the POX plant is the result of almost a decade of work by our in-house
group of scientific experts + engineers
§ Over 50% of Russia’s defined gold resources are refractory or partially
refractory
§ Extraction of gold from refractory ore requires additional stages eg.
flotation, then pressure oxidation (POX) to extract gold from flotation
concentrate
§ POX is a globally recognised process for treating refractory ore and
flotation concentrate
§ The POX Hub repositions the Group as a technological + operational
leader, within Russia + in a global context
§ Optionality / growth: treatment of 3rd party concentrate, acquisition of
refractory deposits
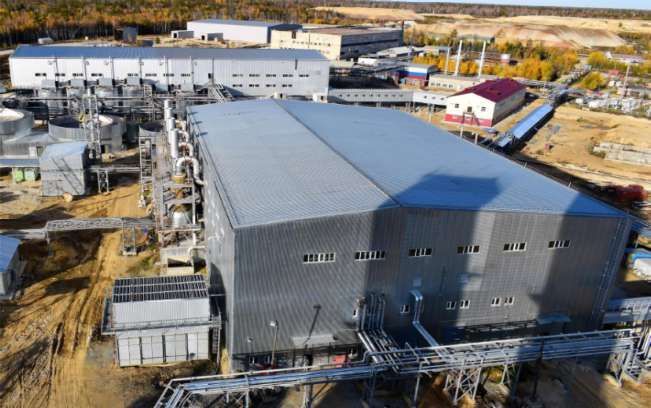
External view of the POX Hub complex We expect to unlock c.60% of our R&R via the POX Hub
JORC Resources(1) JORC Reserves(1)
Refractory Refractory
60% / 12.3Moz 65% / 5.3Moz
20.5 8.2
Moz Moz
Non-refractory Non-refractory
40% / 8.2Moz 35% / 2.9Moz
Autoclaves
(1) In accordance with the JORC Code, as at 31 Dec 2018. Resources (M,I&I) are inclusive of Reserves. For full details and asset by asset breakdown
please refer to the 2018 Petropavlovsk annual report 27Refractory Gold – the Journey from Mined Ore to Doré
Process flowsheet and parameters
28POX Hub: Successfully Commissioned End of 2018
Total installed capacity of 400Ktpa – 500Ktpa(1)
2019 plans
Autoclaves 1 + 2 Autoclaves 3 + 4
— Lines 1 + 2 at POX expected to treat 155Kt – 175Kt of
– Commissioned Q4 2018 – Tested in Q1 2019 à fully- refractory concentrate in 2019 at 30g/t – 31g/t
functioning
– 32Kt of concentrate — This includes:
processed at avg. c.32g/t – Ready to start once 3rd
— 125Kt –145Kt at 29g/t – 32g/t representing
in Q1 2019 party concentrate secured
material mined in 2019
— 29Kt at 28.2g/t representing material mined in
2018 and stockpiled
100 - 125Ktpa(1) 100 - 125Ktpa(1) 100 - 125Ktpa(1) 100 - 125Ktpa(1)
— 37Kt at 40-75g/t of 3rd party concentrate
40% 2020 onwards
— Once additional flotation lines have been installed at
Malomir + Pioneer, POX will be able to treat up to:
100% 100% 100%
30% — 200Ktpa of concentrate from Malomir (at 27%
sulphur) from 2020
— 240Ktpa from Pioneer (at 23% sulphur) from 2023
30%
Autoclave 1 Autoclave 2 Autoclave 3 Autoclave 4
Mined in 2019 Mined in 2018 and stockpiled 3rd party concentrate
(1)POX capacity determined by sulphur levels, hence capacity shown here as ranges which depend on specific qualities of 29
source material (lower sulphur = higher POX plant capacity)R&R / Exploration
Track Record of Resource Growth
As at 31 Dec 2018, Group Reserves & Resources totalled 20.5Moz Au, with Reserves of 8.2Moz
Au
— Following successful commissioning of POX, some transitional Resources and Reserves suitable for either RIP or refractory processing,
  were reclassified from non-refractory to refractory.
— As a result, and due to the success of 2018 exploration campaign, total refractory Resources increased by 2.7Moz to 12.3Moz
— There was a corresponding decrease in non-refractory Resources from 11.2Moz to 8.2Moz (this change also reflects mine depletion and
  disposals)

                            10.1        12.3         11.7         13.8
                                                                              14.0         14.4                                   8.2
                                                                                                        10.4         11.2

   2.1         6.0
                            13.0        12.8         12.1         12.0                                                           12.3
                                                                               9.3          9.3          9.3           9.6
   6.8         5.2
   1.4         1.9          2.4          3.8          5.1         5.9          6.6          7.2
                                                                                                        11.2         11.7        12.5

  2008        2009         2010         2011         2012        2013         2014         2015        2016         2017         2018
                     Refractory Resources              Non-Refractory Resources                Depletion + Disposals

                                                                                                                                    31
Mine by Mine JORC Resource Breakdown
New Resources at Pioneer, Albyn, Malomir and Pokrovskiy
Total JORC Resources (as at 31/12/2018) Non-Refractory Resources
Refractory Resources
New Resources -
Explanation
8.2Moz 20.5Moz 12.3Moz
40% 60%
Malomir Pioneer Albyn Pokrovskiy
6.7Moz 4.5Moz 4.2Moz
97% 76% 79%
6.9Moz 5.9Moz 5.3Moz 0.9Moz
1.1Moz
1.4Moz 21%
24% 0.9Moz
0.2Moz 100%
3%
RIP tailings for Decrease due to
Katrin
reprocessing via Albyn main ore body + disposals +
Nikolaevskya
flotation + POX and Unglichikanskoye sterilisation due at
Ulunginskaya
Quartzitovoye POX facility
32
Note: Tokur, not shown above, contains non-refractory Resources of 1.4Moz. For full details and asset by asset breakdown please refer to the 2018 Petropavlovsk annual reportIRC Limited
33IRC Limited (1029.HK)
Petropavlovsk has a 31.1% equity share in Hong Kong-listed iron ore producer IRC
Who are IRC? POG Equity Interest In IRC
A developer + producer of industrial commodities, principally Petropavlovsk is a 31.1% shareholder
iron ore — IRC is accounted for as an associate
— Based in the Russian Far East, IRC benefits from low — Market value of US$46m as at 21 May 2018(1)
production costs and proximity to China — Petropavlovsk is assessing the best way to realise the value of its
— IRC was part of Petropavlovsk’s Non-Precious Metals Division, interest in IRC
before listing on the Hong Kong Stock Exchange in 2010 Petropavlovsk acts as a guarantor in relation to a US$240m
IRC’s key mining assets include: Gazprombank facility entered into by K&S (an IRC subsidiary) in
— K&S: a producing iron ore(1) mine with a 20 year mine life Dec 2018
— Located in the Jewish Autonomous Region, Russian — This new facility supersedes / replaces the US$340m facility
Far East entered into between IRC and the Industrial and Commercial Bank
— Produces premium quality high grade 65% Fe iron ore of China (ICBC) in 2010, enabling IRC to construct / develop the
— Ramping up to phase I design capacity of 3.2Mtpa, with K&S mine
option to increase to 4.6Mtpa (K&S Phase 1.5) and — New facility matures 2026 and is on better terms, with payments
6.3Mtpa (K&S Phase II) aligned with the ramp-up and cash flows expected from production
— Kuranakh: on care + maintenance since Q1 2016 at K&S
— Garinskoye: project is at an early stage of exploration
(1) IRC market capitalisation as at close 25 April 2019 (US$149m, source: Bloomberg) x Petropavlovsk’s equity interest (31.1%) = US$46m
34FY 2018 IRC Results
Strong FY performance due to successful continuation of K&S ramp-up + refinancing of ICBC project
finance facility
— Total revenue +39% to US$152m (vs. US$ 109m in 2017) due to increased K&S output
— EBITDA +42% to US$29m (vs. US$20m in 2017) due to stronger revenues + stricter cost-control
Financials
— Net profit of US$68m (vs. US$113m in 2017)
— Impairment reversal of US$91m
— Iron ore concentrate production +43% to 2,235Kt (vs. 1,563Kt in 2017)
— Iron ore concentrate sales + 44% to 2,224Kt (vs. 1,539Kt in 2017)
— Avg. selling price of US$68/t (vs. US$70/t in 2017)
Operations
— In Dec 2018, K&S achieved a record-breaking monthly production by operating at an average capacity
of c.84%
— Care + maintenance at Kuranakh mine remains satisfactory
— K&S (a subsidiary of IRC), entered into a new loan facility agreement with Gazprombank to refinance
Corporate existing ICBC loan, with principal repayments better aligned with ramp-up of K&S
— Mr Peter Hambro appointed as Non-Executive Chairman of IRC
— Russian + Chinese sections of Amur river bridge successfully connected
Amur bridge — The bridge is expected to be operational in Sep 2019 once customs checkpoints + other ancillary
infrastructure are in place
35Appendix
36
36Corporate Structure + Overview
Shareholder Structure (as at 31 March 2019)
Kenges Rakishev
(via Fincraft Holdings
Ltd & VTB Bank)
Other 22.4%
36.7%
Sothic Capital
10.9%
Prosperity Capital
Everest Alliance 8.3%
4.6%
DE Shaw & Co
Slevin 7.8%
4.6% RCB Bank
4.7%
Share Price, Gold Price, FX(1) Share Price and Trading Volumes(1)
Price (GBP, pence) 8.3p 9.0p 50m
Price Vols
52 Week Range 5.2p – 8.4p 8.5p
Avg. Daily Vol (12m) 3,644,578 40m
8.0p
Shares outstanding 3,307,151,712
Market Cap. £274m (US$356m) 7.5p 30m
EV £711m (US$924m) 7.0p
6.5p 20m
Gold PM Fix $1,284/oz
52 Week Range US$1,178/oz - US$1,344/oz 6.0p
10m
5.5p
USD:RUB FX 64.8
52 Week Range 61.2 – 70.5 5.0p 0m
(1) Data as at market close 26 April 2019
37FY 2018 Operations Overview
Production summary
Mining Units FY 2018 FY 2017
Total material moved m3 000 44,383 57,539
Ore mined t 000 10,294 17,990
Average grade g/t 1.2 0.9
Processing
RIP
Total milled t 000 13,595 16,620
Average grade g/t 1.0 0.8
Gold content Koz 417 448
Recovery rate % 84% 80%
Gold recovered Koz 351 360
Heap Leach
Ore stacked t 000 701 1,250
Average grade g/t 0.5 0.4
Gold content Koz 11 18
Recovery rate % 54% 50%
Gold recovered Koz 6 9
Gold in concentrate – POX Koz 52 -
TOTAL gold production Koz 422 440
Gold sales Koz 370 440
Costs
TCC US$/oz 786 741
AISC US$/oz 1,117 963
38You can also read