SUSTAINABILITY AND ORGANIC LIVE-STOCK MODELLING (SOL-m)
←
→
Page content transcription
If your browser does not render page correctly, please read the page content below
SUSTAINABILITY AND ORGANIC LIVE-
    STOCK MODELLING (SOL-m)

     Impacts of a global upscaling of
low-input and organic livestock production

              Preliminary Results
                           by
          Christian Schader, Adrian Muller and
                 Nadia El-Hage Scialabba

Natural Resources Management and Environment Department

                    FAO, April 2013
About this document The Sustainability and Organic Livestock model (SOL-m) is a project (see Concept Note) of the FAO Natural Resources and Management Department that has been commissioned to the Re- search Institute of Organic Farming (FiBL) in Frick, Switzerland. This summary report presents the preliminary results of the SOL-model. Currently, plausibility checks are conducted, model parts are refined and further data is gathered for verifying the trends specified thus far. The full project outcomes and a dedicated publication, including quantitative impacts of the scenarios, will be availble in mid June 2013. The outcomes of the current Phase I of SOL-m point to sub- stantial environmental, social and economic potential of a global conversion to grassland-based farming. Thus, FAO has already engaged in Phase II of SOL-m on Sustainable Grasslands. Acknowledgements The authors are grateful for the support to this project of many experts, mainly FAO and FiBL staff but also a few other partners, including (in alphabetic order): Caterina Batello, Maryline Boval, Jan Breithaupt, Carlo Cafiero, Marianna Campeanu, Reto Cumani, Rich Conant, Piero Conforti, Karlheinz Erb, Marie-Aude Even, Karen Franken, Andreas Gattinger, Pierre Gerber, Judith Hecht, Stefan Hörtenhuber, Anne Isensee, Mathilde Iweins, Peter Klocke, John Lantham, Robert Mayo, Eric Meili, Jamie Morrison, Alexander Müller, Noemi Nemes, Urs Niggli, Monica Petri, Tim Robinson, Nicolas Sagoff, Matthias Stolze, Francesco Tubiello and Helga Willer.
Background

Human activities have already reached the edge of the planetary boundaries, and even over-
crossed them in some cases . Globally, agricultural systems, and particular livestock systems, are
an important source of greenhouse gas emissions, and among the leading causes of biodiversity
loss and water pollution . Besides the provision of protein-rich foodstuffs, through the use of
grasslands (ruminants) or food waste (monogastrics), livestock systems used to substantially
contribute to soil fertility via manure excretion, capital storage and labor substitution. Modern
livestock husbandry, however, lost its original ecological and socio-cultural role in a functioning
farming system by unilaterally focusing on milk, meat and egg production. On the one hand,
modern intensive livestock systems are highly efficient in terms of high per-head productivity of
meat, milk and eggs. On the other hand, the intensification of livestock systems during the past
few decades has resulted in a number of downsides. With the substitution of grassland with feed
concentrates, the pressure on arable land increased and led to severe nutrient imbalances at farm,
country and regional levels. Furthermore, intensification of livestock production resulted in a
higher incidence of livestock diseases and a decreased longevity of animals.
Despite these problematic developments, economic conditions still favor intensive livestock sys-
tems. The projected increase of world population and swelling demand for livestock products,
especially higher income populations of developing countries, coupled with a rapidly diminish-
ing natural resource base, call for an urgent reduction of the ecological footprint of livestock pro-
duction.
There are a number of models on global agricultural land use, livestock production and their fu-
ture development addressing food security, greenhouse gas emissions and other aspects of the
livestock sector challenges. However, there are no models that analyze the impacts of a global
conversion of animal husbandry to low-input production systems, such as organic agriculture, on
food availability and the main global environmental challenges. With increasing resource
scarcity, there is need to understand what options would be feasible in a shock scenario, such as
too expensive or unavailable fossil fuel. More importantly, there is an urgent need to model, in a
comprehensive and interlinked way, the technical and economic feasibility of alternative food
supply scenarios. To this end, SOL-m computes and analyzes the potential impacts of a global
conversion of livestock systems to low-input systems and organic management.
Model
SOL-m was developed to shed light on these questions. SOL-m is a global land use and food
systems model capable of analyzing the impacts of different production scenarios on land use,
food availability, material flow (i.e. N, P, energy, GHG) and other environmental impacts.
SOL-m aims to show impacts of different land use and livestock production scenarios. It also
bears the opportunity to relate the environmental impacts to production, as done in agricultural
life cycle assessments for products or specific supply chains. The core model consists of a food
supply module, a food demand module and a separate module where supply and demand are
matched. In the food supply module, activities and products are formulated for land use and
livestock activities, which are linked via feeding rations to each other. In the food demand mod-
ule, human population and diets are defined for calculating the required food for human nutri-
tion. All food products modeled in the food supply module and food requirements from the de-
mand module are subsumed in the food balance module, where the global food surplus or defi-
ciency is quantified.
SOL-m is largely based on, and consistent with, the FAOSTAT data and classification system.
Where data gaps occurred (e.g. on the areas and yields of various types of grasslands, feeding ra-
tions, herd structures), other datasets were created/used.
Food waste is entered into the model as a variable in the food demand module, increasing the
amount of food demanded, and as a variable in the food supply module, reducing the quantity of
food supplied into the food balance. In the environmental impacts module, the environmental
impacts are evaluated according to methods described in Table 1.

Table 1: Overview of environmental indicators used in the SOL-Model
Environmental      Indicator                  Description
impact
Land occupa-       Land occupation in         Data on land use based on FAOSTAT. This indic-
tion               terms of arable, per-      ator is linked to the indicators “deforestation pres-
                   manent crops and           sure” (see below)
                   grassland
Land degrada-      Crop-specific factor       Erosion-susceptibility was modeled as a function
tion               covering the erosion-      of different crop types. Therefore, the length of
                   susceptibility of crops    period during crop growth was taken as an indic-
                                              ator. Data was derived from literature and expert
                                              consultations
Use of fossil en- Cumulative energy use       Based on LCA data (Ecoinvent, Schader , and
ergy resources    (CED) 1.05-1.08             other literature)
Global warming GWP IPCC100a                   Methodology and inventory based on Tier 1 and
potential                                     Tiers 2 approaches, as specified in IP-
                                              CC-Guidelines . Further data was taken from
                                              LCA studies
Nitrogen eu-       Nitrogen surplus and       Inputs (e.g. fertilizer quantities), outputs (e.g.
trophication       losses                     yields, crop residues, nutrient contents) and losses
                                              (i.e. NH3, N2O and NO3) are calculated per land
                                              use activity and country
Phosphorus eu-     P2O5 surplus               The P2O5 surplus serves as an indicator for P
trophication                                  losses, such as in cases of soil loss. Inputs (e.g.
                                              fertilizer quantities), output (e.g. yields, crop
                                              residues, nutrient contents) are calculated per crop
                                              and country
Toxicity           Average amount of and      Toxicity factors calculated were based on expert
                   danger of pesticides       assessments of crop-specific pesticide applica-
                   used per hectare           tions. Three factors were taken into account: a) in-
                                              tensity of application, b) country specific pesti-
                                              cide legislation, and c) economic and physical ac-
                                              cess to pesticides by farmers
Deforestation      Additionally required      Linked to land use factor. Assumption: addition-
pressure           crop land                  ally cropland increases pressure on forests and
                                              may lead to increased deforestation
Grassland ex-      Cattle stocking density    Average number of cattle heads per hectare of
ploitation         on grasslands              grassland
Biodiversity Four of the five main Based on the 5 main drivers of biodiversity loss
drivers of biodiversity suggested by the Millennium Ecosystem Assess-
loss were covered (all ment . Biodiversity is integrated as a function of
except invasive species, the following indicators: global warming poten-
see text for more in- tial, nitrogen eutrophication, phosphorus eutroph-
formation) ication, toxicity, deforestation pressure and grass-
land exploitation
The model is designed as a linear programming (LP) model from a policy-makers’ perspective.
This means that it allows for optimization of production with respect to different policy goals
(e.g. maximize food production, minimize GHG emissions) under restrictions (e.g. do not allow
arable land to be used for concentrate production). The model was programmed using the Gener-
al Algebraic Modeling System (GAMS). Food utilization and commodity trees of the FAOSTAT
working system were calculated with the statistical software R. In the current version, scenario
assumptions were incorporated manually into the model due to data constraints.
Principally, the model is working at country level. This means that most data are specified for
each country (e.g. land use, livestock numbers, yields) and later aggregated to regional or global
level in order to provide comprehensible results. For this preliminary report, we present global
level results only, because some data are only available at global level. This fact required an as-
sumption of completely globalized concentrate markets. It is planned to successively specify the
model in more details. For example, if high quality data for a certain country is identified, global
assumption can be substituted with it.
As this project focused on livestock production, other external drivers such as GMOs, aquacul-
ture, fisheries, food waste, specific technological developments (e.g. cultured meat) and biofuels
was set constant (ceteris paribus). This allowed a specific treatment of the low-input livestock
production impacts.
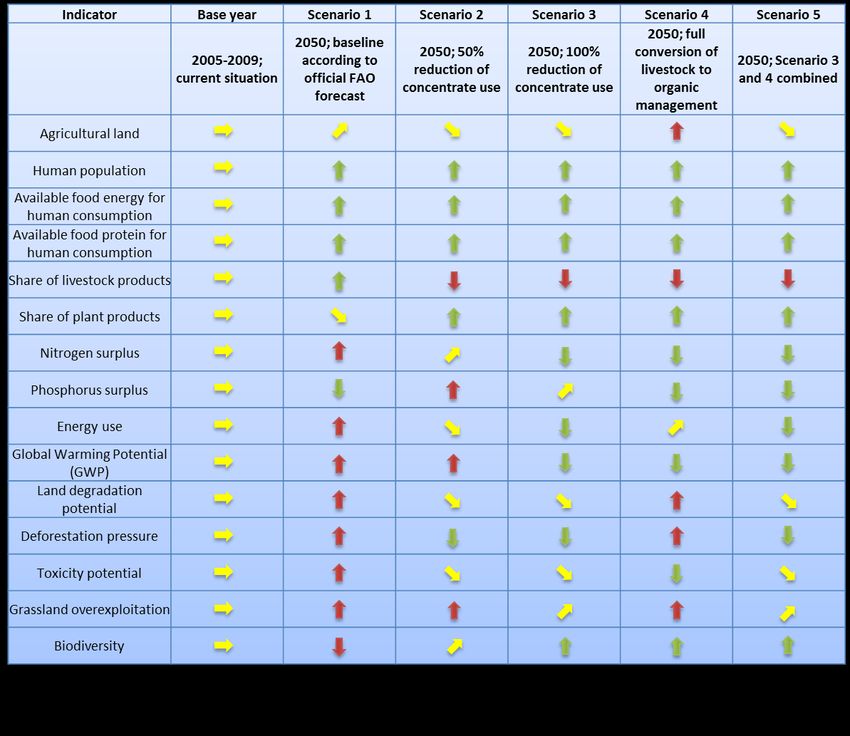
The calculation of the base year, representing the current situation, was based on data from 2005-
2009. The base year served for calibrating the model and for comparing the results of the other
scenarios. Using this base year as a reference, five different scenarios were modeled within SOL-
m:
o Scenario 1 is the baseline FAO scenario for 2050 , with the corresponding trends for pop-
ulation growth, yield increases, meat consumption, etc.. Livestock type specific feeding
rations (e.g. grassland/concentrate shares) were assumed to remain unchanged.
o Scenario 2 assumes a 50% reduction in livestock concentrate feeding (though non-food
by-products from food production, such as wheat brans or dredges, are excluded from
this reduction). Correspondingly, feeding ratios were adapted according to feed availabil-
ity and this determines the livestock numbers in this Scenario. A general condition for all
scenarios was to provide at least as much calories for human nutrition as the FAO
baseline Scenario 1.
o Scenario 3 is similar to Scenario 2 but assumes a complete ban of concentrates instead of
a 50% reduction (while non-food by-products from food production are still included in
feed).
o Scenario 4 assumes a complete conversion to organic livestock husbandry, including feed
production. In this scenario, organically produced concentrates at potentially high shares
are allowed. Animal numbers are determined by feed and food availability when the
whole livestock husbandry is organic and the overall condition of aggregate calorie sup-
ply as in Scenario 1. We assume that all organic production comes from organic farmsthat converted all their activities. Correspondingly, not only feed production is organic
but the organic share in all agricultural production rises
o Scenario 5 combines Scenario 3 and 4, by assuming both a conversion to organic live-
stock production and a complete ban of concentrate feeding.
Further details on the scenarios and the assumptions can be found in Table 3 (Annex).
Results
SOL-m calculations revealed that, contrary to the baseline Scenario 1, sufficient calories and
protein could be produced in 2050 without compromising environmental impacts through a glob-
al conversion to low-input and organic livestock management. In Scenario 2 (i.e. 50% reduction
of concentrate feed), and even more so in Scenario 3 (i.e. no concentrate feed), food availability
increases while pressure on forest areas decreases. Furthermore, many positive environmental
impacts could be achieved, including lower GHG emissions and energy use, lower N and P sur-
pluses and toxicity potentials. It is important to note, however, that it will not be possible to sus -
tain environmental quality in 2050 with the same consumption level trends of livestock products
(Table 2).
The organic Scenario 4 promises to yield many environmental benefits, such as reduced toxicity
potentials, N and P surpluses and GHG emissions. However, organic livestock production as
practiced today (i.e. utilizing organically produced concentrate feed) will most likely need more
land in order to satisfy food demand, especially if the current trends of meat, milk and egg con-
sumption levels per person continue in 2050. According to SOL-m preliminary calculations,
about 334 million additional hectares of arable land would be needed globally for an organically-
produced supply, even if demand for animal products would halve - while according to the base
year, only 70 million additional hectares would be needed. The organic option, however, be-
comes a win-win if it refrained from using concentrate feeds. Although to different extent, what
is certain is that none of the scenarios, including the base year, could ever be sustainable without
a global shift to sustainable diets (i.e. decreased consumption of livestock products).
Therefore, if consumption shares of livestock products will go down to a third or fourth of the
base year levels, organic livestock production can be combined perfectly with low-concentrate
livestock production. In such a combined Scenario 5, almost all environmental indicators react
positively, especially deforestation pressure, and food availability becomes more than sufficient
for the 2050 population, as land freed from concentrate feed production would be used for plant-
based food.
It is also important to note that efforts to achieve efficiency gains in terms of an ecological in-
tensification, that is producing more output with less input, would further decrease pressure on
land and other resources. However, while efficiency gains can reduce the demand for natural re-
sources per kg of output, it might also lead to rebound effects , as a reduced resource demand
may lead to lower prices and eventually, cause demand increase.Table 2: Overview of SOL-m impacts of scenarios on food availability and the environment Conclusions SOL-m results suggest that a continued trend of current livestock husbandry practices will most likely lead to problematic trends for most environmental indicators, undermining the very base of food production. On the other hand, a conversion to low concentrate feed livestock production will generate great synergies between food availability and environmental health. About 60% of the agricultural land worldwide is covered by grasslands. Within the agricultural sector, grasslands play a major role in maintaining food production and fulfill crucial ecological functions such as soil carbon sequestration, maintaining soil fertility, biodiversity and other eco- system services. Improving grassland management constitutes a powerful lever for boosting food production without jeopardizing natural resources. An increasing number of consumers acknow- ledge these functions and are willing to pay higher prices for foodstuffs produced in grass-based systems. This development may enhance the economic viability of grassland-based milk and meat production systems compared to concentrate feeding.
Global environmental impacts can be mitigated if livestock production was grassland-based.
However, livestock extensification strategies would be feasible only if human diets in developed
countries become much less meat intensive and if diets in developing countries, with currently
low shares of meat, do not become less meat intensive than anticipated by Alexandratos and Bru-
insma . An organic livestock scenario becomes feasible only if concentrate feed use and meat de-
mand were reduced globally. In all environmentally favorable scenarios, meat, milk and egg con-
sumption needs to be reduced and possibilities for alternative protein sources (e.g. legumes, fish)
need to be explored.
Therefore, particularly in industrialized countries with a high share of meat, milk and egg con-
sumption, policy measures for steering food demand in a more sustainable direction need to be
found. This would set a positive model for more sustainable diets for developing countries’ pop-
ulations with rising income.

                                         References
Annex
Table 3: Overview of scenario assumptions
PARAMETER Base year Scenario 1 Scenario 2 Scenario 3 Scenario 4 Scenario 5
Organic livestock
Organic livestock
Scenario name Today Baseline 50% concentrates Feed no Food conversion fed with
conversion
no food
Year 2009 2050 2050 2050 2050 2050
Human popula- According to According to According to According to According to According to
tion FAOSTAT FAOSTAT FAOSTAT FAOSTAT FAOSTAT FAOSTAT
Crop yield in- FAO projection FAO projection FAO projection FAO projection
No FAO projection data
crease data data data data
Based on rations Based on rations
Feeding rations
Feeding rations for base year but if Feeding rations for base year but if
defined for all
defined for all major Based on rations concentrate supply defined for all ma- concentrate supply
major livestock
livestock types and for base year but if drops to 0% (only jor livestock types drops to 0% (only
Feeding rations types and linked
linked to coun- concentrate supply by- products of and linked to coun- by- products of
to country-spe-
try-specific produc- drops to 50% food production are try-specific produc- food production are
cific production
tion data used as concen- tion data used as concen-
data
trates) trates)
According to
FAO/OECD Agricul-
tural Outlook According to mod- According to mod- According to mod- According to mod-
Ruminant meat
According to 2030/2050 el endogenous el endogenous el endogenous el endogenous
and milk produc-
FAOSTAT (Cattle and buffalo feedstuff availabil- feedstuff availabil- feedstuff availabil- feedstuff availabil-
tion
numbers +32%, ity ity ity ity
Sheep and goat num-
bers +53%)according to
FAO/OECD Agricul-
tural Outlook
According to mod- According to mod- According to mod- According to mod-
Non-ruminant 2030/2050
According to el endogenous el endogenous el endogenous el endogenous
meat and egg pro- (poultry numbers
FAOSTAT feedstuff availabil- feedstuff availabil- feedstuff availabil- feedstuff availabil-
duction +93%, pigs +24%)
ity ity ity ity
According to
Calorie and pro-
According to FAO/OECD Agricul- Must not fall below Must not fall below Must not fall below Must not fall below
tein intake per
FAOSTAT tural Outlook Scenario 1 Scenario 1 Scenario 1 Scenario 1
person
2030/2050
If more/less land is If more/less land is If more/less land is If more/less land is
According to
needed to satisfy needed to satisfy needed to satisfy needed to satisfy
According to FAO/OECD Agricul-
Deforestation food availability, food availability, food availability, food availability,
FAOSTAT tural Outlook
pressure on forests pressure on forests pressure on forests pressure on forests
2030/2050
increases/decreases increases/decreases increases/decreases increases/decreases
Net grassland stays Net grassland stays Net grassland stays Net grassland stays Net grassland stays
Ratio arable land / According to
constant, arable land constant, arable constant, arable constant, arable constant, arable
grassland FAOSTAT
increases land increases land increases land increases land increases
According to Based on Scenario Based on Scenario
FAO/OECD Agricul- 1 but yields de- 1 but yields de-
Based on Scenario Based on Scenario
tural Outlook crease by 20% due crease by 20% due
1 but yields de- 1 but yields de-
According to 2030/2050, livestock to suboptimal con- to changed concen-
Livestock yields crease by 10% due crease by 20% due
FAOSTAT yields increase addi- centrate changed trate composition
to changed concen- to changed concen-
tional 5% as rather and low livestock and low livestock
trate composition trate composition
intensive scenario is production intens- production intens-
assumed ity ityYou can also read