Ovidius University Annals of Chemistry - Sciendo
←
→
Page content transcription
If your browser does not render page correctly, please read the page content below
DOI: 10.2478/auoc-2020-0008

 Ovidius University Annals of Chemistry Volume 31, Number 1, pp. 38 - 43, 2020

 Optimization of process factors using the Taguchi method of DOE towards
 the hydrodeoxygenation of acetic acid
 Ahmed Lawal MASHI* and Muhammad Sulaiman RAHAMA

 Department of Pure and Industrial Chemistry, Umaru Musa Yaradua University, Katsina, Nigeria

Abstract. This paper reports the optimization of process factors using the Taguchi method towards the conversion of
acetic acid and ethanol yield during the hydrogenation of acetic acid over 4% Pt/TiO 2. The acidity of 4% Pt/TiO2 was
characterized using NH3-Temperature Programmed Desorption analysis (NH3-TPD). Afterwards, the effect of
temperature on the hydrogenation of acetic acid as an individual feed was investigated. The reaction space explored in
the following ranges: temperature 80-200 °C, pressure 10-40 bar, time 1-4 h, catalyst 0.1-0.4 g and stirring speed 400-
1000 min-1 using 4% Pt/TiO2, was investigated for the optimization study, while the effect of temperature was studied in
a temperature range of 145 to 200 °C. NH3-TPD analysis reveals that moderate acidity was suitable for the hydrogenation
of acetic acid to ethanol. It was also found that 200 °C, 40 bar, 4 h, 0.4 g and 1000 min-1 for acetic acid conversion, and
160 oC, 40 bar, 4 h, 0.4 g and 1000 min-1 were the optimum conditions for ethanol production. In addition, the selectivity
of ethanol was favored at lower temperatures which decreases with increasing temperature.
Keywords: hydrodeoxygenation, optimization, Taguchi method.

1. Introduction uneconomical process costs in addition to catalyst
 deactivation and insufficient understanding of kinetics
Biomass, which is a cheap and abundant carbon-based
 have been established as the key limitations of
renewable source, has appeared to be a potential
 hydrodeoxygenation [6, 9].
alternative feedstock to fossil fuels for the production of
 In this study, one-factor-at-a-time (OFAT) and
fuel grade hydrocarbons [1]. Fast pyrolysis and
 design of experiment (DOE) were considered in order to
hydrothermal liquefaction of biomass are the main
 investigate the optimized factors and their contributions
processes used for the production of bio-oil [2-4]. This
 towards the hydrogenation of acetic acid. The
makes it a potential alternative for fossil fuels with
 application of OFAT by engineers and scientists was
negligible emissions of nitrogen oxides (NOx) and
 considered less effective due to reasons such as time
sulfur dioxide (SO2), and carbon neutrality. However,
 consumption and more experiments, which results in
crude bio-oil has limited application as fuel due to high
 fewer interactions between factors and susceptibility to
oxygen and aqueous phase content which results in
 bias due to time index in experimental errors [10].
detrimental properties such as high acidity, low heating
 Therefore, this makes the DOE more attractive as it
value, high viscosity and poor miscibility with fossil
 offers a predictive knowledge of complex and multi-
fuels [5, 6]. As a result of this, upgrading has become a
 variable processes with a few experimental trials. The
necessity to enhance its fuel properties. It has been
 application of the different approaches in DOE such as
reported in the literature that the complex composition
 full factorial design, surface response methodology and
of bio-oil owing to the presence of a large number of
 Taguchi method are relatively similar. However, the
hydrocarbons makes it difficult to carry out kinetic
 Taguchi method is a simpler, cost effective, systematic
studies [5, 7]. However, understanding the contributing
 and comprehensive approach which uses fewer
reaction routes involving individual bio-oil model
 experiments to provide an optimization of complex and
compounds would provide details of the overall reaction
 multi variable process. Optimization in a Taguchi
network. The low polarizability of carboxylic acids
 designed experiment involves reducing the variation in
makes it difficult to undergo hydrogenation [8].
 the process by minimizing the effects of uncontrollable
Catalytic hydrodeoxygenation and zeolite cracking are
 factors (noise factors) and keeping the response mean
the most common techniques in bio-oil upgrading.
 value [11]. In this study, the Taguchi method was used
Hydrodeoxygenation (HDO) has been reported to be the
 to optimize the controllable reaction factors affecting the
preferred upgrading technique compared to zeolite
 hydrogenation of acetic acid.
cracking because it produces fuels of higher quality [9].
This process involves the elimination or conversion of
oxygenated molecules in the bio-oil under hydrogen
pressure using suitable catalyst and temperature to yield
products of industrial relevance. However,

*
 Corresponding author. E-mail address: ahmed.lawal@umyu.edu.ng (Ahmed Lawal Mashi)
Mashi and Rahama / Ovidius University Annals of Chemistry 31 (2020) 38-43 2. Experimental detector temperatures were kept at 250 °C. A constant pressure mode was initiated to maintain a split flow of 2.1. Materials 181. The first stage of the GC oven was programmed at Acetic acid with 99.5% purity was purchased from 40 °C and held for 5 minutes. Subsequent heating to 215 Sigma-Aldrich. Ethanol (purity 99%), hexane (HPLC °C at 20 °C‧min-1 ramping was carried out before grade, 95%), and ethyl acetate (99%) were purchased increased heating at a ramp rate of 5 °C‧min-1 to 220 °C from Fisher Scientific, UK. 4% Pt/TiO2 was chosen and maintained for 5 min. For reproducibility within from catalyst screening in our previous study [12]. In negligible error, each sample was injected three times. addition, the method of catalyst preparation has been Equations 1 and 2 were used to calculate the conversion acknowledged in the same study [12]. of acetic acid and ethanol selectivity respectively. (Initial moles of acid−Final moles of acid) 2.2. Experimental setup Conversion (%) = Initial moles of acid × 100 (1) The experimental method used in this study was adopted Moles of acid reacted to desired product from our previous work [12]. Figure 1 shows the various Selectivity (%) = × 100 (2) Total moles of acid reacted reactor components in the experimental setup. 2.5. Taguchi method of optimization An orthogonal array of five controllable factors at four different levels was chosen. The reaction factors considered include reaction temperature, initial hydrogen pressure, catalyst loading, reaction time and stirring speed (Table 1). An array of sixteen experimental runs (L16) was generated using design expert software as presented in Table 2, which comprises of five columns that represents the control factors and their respective levels. In addition, the rows represent the sixteen (16) experiments that should be carried out at the given level of each control factor. Table 1. Selected controllable factors and their levels. Level Level Level Level Factors 1 2 3 4 Temperature (C) 80 120 160 200 Initial pressure (bar) 10 20 30 40 Catalyst loading (g) 0.1 0.2 0.3 0.4 Figure 1. Reactor setup. Agitation speed (min-1) 400 600 800 1000 Reaction time (h) 1 2 3 4 2.3. Catalyst characterization NH3-Temperature Programmed Detector (NH3-TPD) The Taguchi method proposes the signal-to-noise was used to characterize the acidity on 4% Pt/TiO2 ratio (S/N) function as a suitable approach in selecting surface. A ThermoFinnigan TPDRO 1100 equipped optimum conditions with respect to response variables. with a thermal conductivity detector (TCD) was used to Typically, the signal-to-noise ratio is a measure of the provide information on the acidity of 4% Pt/TiO 2. desired output signal to the background noise of a During the analysis, 100 mg of 4% Pt/TiO2 was placed response variable [13]. In this study, the larger-the- in the TPDRO cell and then dried at 300 °C under better function was chosen based on the objective of helium gas for 2 h. Helium was subsequently passed achieving a maximum response variable. through the sample to reduce the temperature to 50 °C. 1 1 The temperature was held at 50 °C and 5% NH 3/He at a ( ) = −10 ( ∑ =1 2 ) (3) rate of 20 ml/min was passed under continuous flow for 1 h to saturate the samples. Consequently, the weakly where , is the number of measured value, is the physiosorbed NH3 molecules were eliminated by measured response value, 2 mean square of measure purging the system under the flow of 100% helium for 1 h. The resulting TCD profiles show the extent of response value. chemisorbed NH3, which were attained by keeping the The influence of each factor with respect to the helium flow constant and increasing the system hydrogenation of acetic acid was determined by temperature from 50 °C to 800 °C at a rate of 10 °C/min. calculating the F-value and P-value using the one-way ANalysis Of VAriance (ANOVA) [14]. 2.4. Analytical technique 2 A mass spectrometer (GC-MS Agilent) was used in = ∑ ( − ) (4) identifying formed products from the reactions. The amount of unreacted acetic acid and formed liquid ̅1 ) ℎ = ∑( − (5) products was carried out using a GC equipped with flame ionization detector (FID) (Shimadzu GC-2010) = − ℎ (6) and a ZB-wax capillary column (30 m × 0.25 mm × 0.25 ℎ = − (7) μm). Before each analysis, butanol was spiked into the product samples in a ratio of 10:1. Both injector and = − 1 (8) 39
Mashi and Rahama / Ovidius University Annals of Chemistry 31 (2020) 38-43 = + ℎ (9) The NH3-TPD profile for 4% Pt/TiO2 is shown in Figure 2. The catalyst shows a profile with four = (10) desorption peaks in the three different regions of acidic strength. The desorption peaks correspond to ℎ ℎ = (11) temperatures of 140 °C, 290 °C, 330 °C and 616 °C. The ℎ first peak corresponds to NH3 adsorbed on the weak acid SSwithin sites. Subsequently, the second and third peaks are Percentage contribution (%) = (12) SSTotal classified as moderate acidic sites while the last peak is where N is the total number of response values, M is the an indication of strong acidic sites [15, 16]. number of levels, G is the sum of all responses at all Accordingly, the number of the acids sites are 0.044 ̅1 is the mean of all mmol g-1, 0.350 mmol g-1 and 0.089 mmol g-1 for the levels, is response value and weak, moderate and strong acidic sites respectively, responses at a particular level. with a total 0.48 mmol g-1 acidic sites on the catalyst. 3. Results and discussion 3.2. Optimization of process factors The influence of reaction factors on ethanol yield over 3.1. Catalyst characterization 4% Pt/TiO2 was evaluated and their respective The acidic sites of catalysts are generally categorized contributions quantified. The corresponding S/N ratios into weak, moderate and strong, which corresponds to for experimental runs in the orthogonal array are shown temperature ranges ≤ 200 °C, 200-350 °C and ≥ 350 °C in Table 2. The computation of total S/N ratio for each respectively [15]. factor at a specific level was carried out by adding the S/N ratios for the experiments at the same level. The effect of reaction factors for each level is shown in Figure 3. The upper end of the range of reaction temperature was chosen based on preliminary experiments which shows that at higher temperatures above 200 °C, the conversion of acetic acid remained approximately the same with minimal formation of liquid products while ethanol yield dropped. The S/N profile shows that temperature peaked at 200 °C and has a strong influence towards the conversion of acetic acid. In addition, the total S/N ratios for each factor increased with increasing level, and subsequently reaching maximum at level 4. This observation shows that increased temperatures favors the cleavage of C-O bonds through hydrogenolysis towards the formation of Figure 2. NH3-TPD over 4% Pt/TiO2 ethanol and ethyl acetate with aldehyde as an intermediate. Table 2. L16 Orthogonal array and corresponding S/N ratio A B C D E Acetic acid Ethanol Exp. S/N S/N Temp. Pressure Time Stirring Catalyst conversion yield No. conversion yield (C) (bar) (h) (min-1) (g) (%) (%) 1 1 1 1 1 1 0.30 -10.46 0.05 -25.35 2 1 2 2 2 2 1.37 2.73 0.41 -7.72 3 1 3 3 3 3 3.79 11.57 2.08 6.38 4 1 4 4 4 4 7.50 17.50 6.00 15.56 5 2 1 2 4 3 29.11 29.28 16.01 24.09 6 2 2 1 3 4 17.61 24.92 13.91 22.87 7 2 3 4 2 1 36.45 31.23 25.52 28.14 8 2 4 3 1 2 35.14 30.91 29.86 29.50 9 3 1 3 2 4 65.07 36.27 33.19 30.42 10 3 2 4 1 3 70.68 36.99 37.46 31.47 11 3 3 1 4 2 50.00 33.98 32.50 30.24 12 3 4 2 3 1 52.26 34.36 31.88 30.07 13 4 1 4 3 2 83.44 38.43 25.03 27.97 14 4 2 3 4 1 81.95 38.27 28.68 29.15 15 4 3 2 1 4 79.30 37.99 38.06 31.61 16 4 4 1 2 3 68.19 36.67 13.64 22.69 Similar to factor A, the total S/N ratio of factor B the adsorption of hydrogen and spill over on the surface increased linearly with level and attained maximum at of 4% Pt/TiO2 resulting in attack on the carbonyl species 40 bar. This can be linked to the extent of hydrogen [17]. solubility in the reaction mixture which in turn enhances 40
Mashi and Rahama / Ovidius University Annals of Chemistry 31 (2020) 38-43

 The S/N ratio for factor C increased with reaction Figure 5 shows the ANOVA analysis where the
time. This observation suggests that extended reaction contributory effect of reaction factors was calculated by
time strongly favors conversion of acetic acid which comparing the individual mean variance (V). It can be
corresponds with the maximum conversion achieved at observed that temperature had the highest significance
4 h, thus confirming level 4 to be the optimal reaction on acetic acid conversion while stirring speed had the
time. It is expected that longer time will be required to least. It is worth noting that variance only provides
achieve maximum conversion based on the low polarity qualitative information in the estimation of the
of acetic acid and its resistance to hydrogenation [18]. significance of parameters [19-20]. According to the
The S/N ratio for factor D increases as stirring speed ANOVA results, the contribution of each factor is
increases which peaked at level 4. Accordingly, an summarized accordingly: temperature > reaction time >
insignificant increase in S/N ratio for stirring speed was initial H2 pressure > catalyst loading > stirring speed.
observed from level 2 to 4 which confirms negligible
degree of external mass transfer effect [12], as shown in
Figure 3. The S/N ration for factor E showed that
conversion of acetic acid increases with increased
catalyst loading. Subsequently, improved catalyst
activity with increase in catalyst loading is linked to
enhanced number of active sites which are exposed to
provide the platform for adsorption of carbonyl carbon
that are attacked by spill over hydrogen. As shown in
Figures 3 and 4, the optimum reaction factors can be
summarized as A4, B4, C4, D4, E4 which corresponds to
200 °C, 40 bar, 4 h, 0.4 g and 1000 min-1 respectively. A
validation experiment is essential using the optimum
conditions to confirm the highest output response, so
 Figure 5. Analysis of variance (ANOVA) for conversion of
long as the optimum conditions are independent of an acetic acid.
experimental set in the orthogonal array. Figure 4 shows
result from the confirmation experiment which revealed To maximize the yield of ethanol, the larger-the-
that acetic acid conversion was higher than the highest better function (equation 1) was considered in
acetic acid conversion obtained in Experiment 13 of calculating the S/N ratio. Table 2 shows the calculated
Table 2 which confirms the applicability of the Taguchi mean ethanol yield. As shown in Figure 6, each factor
technique for the purpose of this study. except temperature attained maximum S/N ratio at level
 4. The optimum temperature for ethanol production is
 160 °C which means above 160 °C, there is potential
 side reaction occurring that favors the production of
 ethyl acetate. Notably, high pressure and high catalyst
 weight favors the production of ethanol from the
 hydrogenation of acetic acid. Figure 7 shows the
 validation test (160 °C, 40 bar, 4 h, 0.4 g and 1000 min -
 1
 ) in comparison to the highest yield of ethanol as
 reported in experiment 15 of Table 2. Evidently, the
 ethanol yield and the S/N ratio under the best reaction
 condition explored is slightly higher than the best
 reported in Table 2.

 Figure 3. Effect of process factors at each level for
 conversion of acetic acid

 Figure 6. Effect of process factors at each level for yield of
 ethanol

 Figure 4. Confirmation experiment under reaction space
 explored for conversion of acetic acid

 41
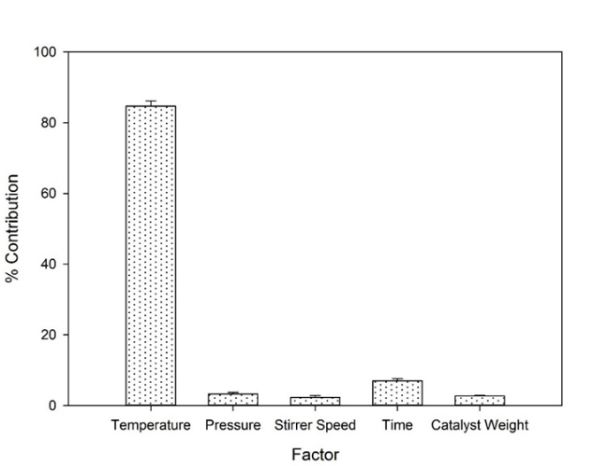
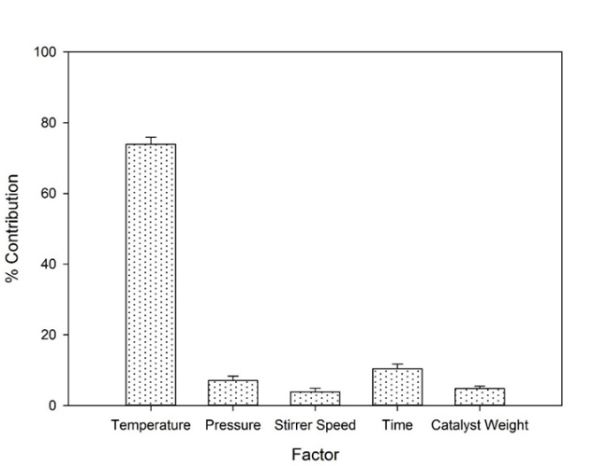
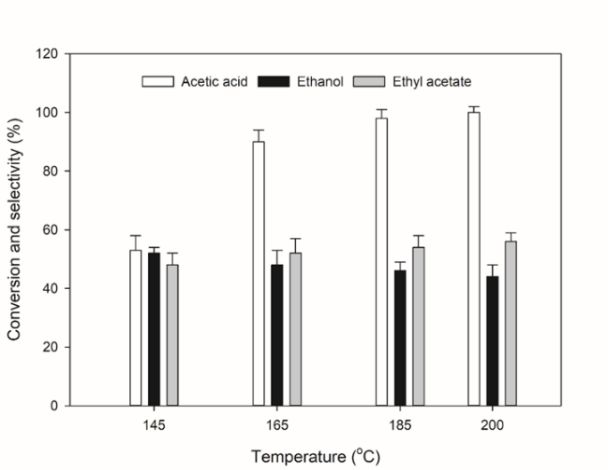
Mashi and Rahama / Ovidius University Annals of Chemistry 31 (2020) 38-43 observed that formation of liquid products was found to be ≥ 98% which were mainly ethanol and ethyl acetate. The formation of gaseous products such as CO, CO2 and C1 - C4 alkanes were linked to the negligible gas formations (< 2%). Coke formation was not evident and was thus neglected. Figure 9 shows that ethanol selectivity decreased as reaction temperature increased from 145 to 200 C. At 145 °C, the conversion of acetic acid was selective towards 53% ethanol and 48% ethyl acetate as the primary products (Figure 9). The substantial production of ethyl acetate at low temperature is associated to competitive adsorption of formed ethanol Figure 7. Confirmation experiment under reaction space on the catalyst active sites which is evident from explored for yield of ethanol adsorption study (See Figure 10). The production of liquid products maintains a high selectivity ≥ 99% even Figure 8 shows the ANOVA analysis for the yield of at 200 °C. This suggests that 4% Pt/TiO2 exhibits high ethanol as summarized accordingly: temperature > acidity which do not favor further hydrogenation and reaction time > initial H2 pressure > catalyst loading > decarboxylation reactions [21]. In addition, high catalyst stirring speed. It is worth noting that the ranking order is acidity as reported in Figure 2 favors the protonation of the same to acetic acid conversion. acetic acid which results in the formation ethyl acetate as a by-product. The formation of ethane, methane and CO2 were anticipated to be the negligible gaseous products as reported in earlier studies [16, 22]. It is clear that the conversion of the acetic acid and ethyl acetate selectivity increased while ethanol selectivity decreased with increased reaction temperature from 145 to 200 C. This suggests that lower temperatures favor the formation of ethanol through enhanced hydrogenation and suppressed esterification. Figure 8. Analysis of variance (ANOVA) for yield of ethanol 3.3. Effect of temperature on the hydrogenation of acetic acid The influence of reaction temperature was investigated towards conversion and product selectivity for the hydrogenation of acetic acid over 4% Pt/TiO2 at 2 h in the range of 145-200 °C. Figure 10. Adsorption study for mixture acetic acid, ethanol and ethyl acetate (experimental conditions: initial concentration, 0.09 M; catalyst loading, 0.3 g; and reaction time, 35 min respectively) 4. Conclusions This study revealed the results from Taguchi method of DOE reported for the optimization of reaction conditions towards the maximization of acetic acid conversion and ethanol yield. The optimum conditions for the conversion of acetic acid were found to be 200 °C, 40 bar H2, 0.4 g catalyst loading, 1000 min-1, and 4 Figure 9. Effect of temperature on the hydrogenation of acetic acid over a) 4% Pt/TiO2. Reaction conditions: 0.3 g of h while that of ethanol yield were 160 °C, 40 bar H2, 0.4 4%Pt/TiO2/4% Pt-4%Re/TiO2, 0.2 M initial concentration, H2 g catalyst loading, 1000 min-1, and 4 h. NH3-TPD pressure of 40 bar, 50 ml of hexane and batch reaction time analysis revealed that moderate acidity on 4% Pt/TiO2 of 2 h favors hydrogenation reaction towards higher ethanol formation. Hydrogenation of acetic acid was found to be Figure 9 shows the conversion of acetic acid and more selective toward ethanol than ethyl acetate at lower selectivities toward ethanol and ethyl acetate. It was temperatures. 42
Mashi and Rahama / Ovidius University Annals of Chemistry 31 (2020) 38-43

Acknowledgment surface roughness in precision turning of titanium,
 Adv. Manuf. Sci. Technol. 38 (2014) 21-35.
The authors gratefully acknowledge the financial
 [12]. A.M. Lawal, A. Hart, H. Daly, C. Hardacre, J.
support of The Petroleum Technology Development
 Wood, Kinetics of hydrogenation of acetic acid
Fund (PTDF), Nigeria.
 over supported platinum catalyst, Energy Fuels 33
 (2019) 5551–5560.
Conflict of interest [13]. I.N. Tansel, S. Gülmez, M. Demetgul, Ş. Aykut,
Authors declare no conflict of interest. Taguchi Method–GONNS integration: Complete
 procedure covering from experimental design to
References complex optimization, Expert Syst. Appl. 38
 (2011) 4780–4789.
[1]. J. Wang, Z. Luo, J. Zhang, Q. Dang, W. Chen, [14]. S. Athreya, D.Y.D. Venkatesh, Application of
 Reactions of furfural and acetic acid as model Taguchi method for optimization of process
 compounds for bio-oil upgrading in supercritical parameters in improving the surface roughness of
 ethanol, ICECC (2011) 1587–1592. lathe facing operation, IRJES 1 (2012) 13–19.
[2]. K. Wang, D. Dayton, J. Peters, O. Mante, Reactive [15]. V. Sundaramurthy, A.K. Dalai, J. Adjaye, The
 catalytic fast pyrolysis of biomass to produce high- effect of phosphorus on hydrotreating property of
 quality bio-crude, Green Chem. 19 (2017) 3243- NiMo/γ-Al2O3 nitride catalyst, Appl. Catal. Gen.
 3251. 335 (2008) 204–210.
[3]. R. Shakya, S. Adhikari, R. Mahadevan, E. Hassan, [16]. Z. He, X. Wang, Required catalytic properties for
 T. Dempster, Catalytic upgrading of bio-oil alkane production from carboxylic acids:
 produced from hydrothermal liquefaction of Hydrodeoxygenation of acetic acid, J. Energy
 Nannocloropsis sp., Bioresour. Technol. 252 Chem. 22 (2013) 883–894.
 (2018) 28-36. [17]. F. Zaera, The surface chemistry of metal-based
[4]. S. Zhang, X. Yang, H. Zhang, C. Chu, K. Zheng, hydrogenation catalysis, ACS Catal. 7 (2017)
 M. Ju, L. Liu, Liquefaction of Biomass and 4947–4967.
 Upgrading of Bio-Oil: A Review, Molecules. 24 [18]. J. Pritchard, G.A. Filonenko, R. Putten, E.J.M.
 (2019) 2250-2279. Hensen, E.A. Pidko, Heterogeneous and
[5]. P.M. Mortensen, J.D. Grunwaldt, P.A. Jensen, homogeneous catalysis for the hydrogenation of
 K.G. Knudsen, A.D. Jensen, A review of catalytic carboxylic acid derivatives: history, advances and
 upgrading of bio-oil to engine fuels, Appl. Catal. future directions, Chem. Soc. Rev. 44 (2015)
 Gen. 407 (2011) 1–19. 3808–3833.
[6]. D.A. Ruddy, J.A. Schaidle, J.R.F. Iii, J. Wang, L. [19]. S. Srivastava, G.C. Jadeja, J. Parikh, Copper-
 Moens, J.E. Hensley, Recent advances in cobalt catalyzed liquid phase hydrogenation of
 heterogeneous catalysts for bio-oil upgrading via furfural to 2-methylfuran: An optimization,
 “ex situ catalytic fast pyrolysis”: catalyst kinetics and reaction mechanism study, Chem.
 development through the study of model Eng. Res. Des. 132 (2018) 313–324.
 compounds, Green Chem. 16 (2014) 454–490. [20]. Y.Ş. Yildiz, Optimization of Bomaplex Red CR-L
[7]. Y.H.E. Sheu, R.G. Anthony, E.J. Soltes, Kinetic dye removal from aqueous solution by
 studies of upgrading pine pyrolytic oil by electrocoagulation using aluminum electrodes, J.
 hydrotreatment, Fuel Process. Technol. 19 (1988) Hazard. Mater. 153 (2008) 194–200.
 31–50. [21]. P.K. Rakshit, R.K. Voolapalli, S. Upadhyayula,
[8]. T. Toyao, S.M.A.H. Siddiki, A.S. Touchy, W. Acetic acid hydrogenation to ethanol over
 Onodera, K. Kon, Y. Morita, T. Kamachi, K. supported Pt-Sn catalyst: Effect of Bronsted
 Yoshizawa, K. Shimizu, TiO2 -Supported Re as a acidity on product selectivity, Mol. Catal. 448
 general and chemoselective heterogeneous catalyst (2018) 78–90.
 for hydrogenation of carboxylic acids to alcohols, [22]. H. Wan, R.V. Chaudhari, B. Subramaniam,
 Chem. Eur. J. 23 (2017) 1001–1006. Aqueous Phase Hydrogenation of Acetic Acid and
[9]. H. Wang, J. Male, Y. Wang, Recent Advances in Its Promotional Effect on p-cresol
 Hydrotreating of pyrolysis bio-oil and its oxygen- hydrodeoxygenation, Energy Fuels 27 (2013) 487–
 containing model compounds, ACS Catal. 3 (2013) 493.
 1047–1070.
[10]. D.D. Frey, F. Engelhardt, E.M. Greitzer, A role for Received: 02.04.2020
 “one-factor-at-a-time” experimentation in Received in revised form: 22.05.2020
 parameter design, Res. Eng. Des. 14 (2003) 65–74. Accepted: 22.05.2020
[11]. M. Kowalczyk, Application of Taguchi and Anova
 methods in selection of process parameters for

 43
You can also read