Predicting Solar Power Production: Irradiance Forecasting Models, Applications and Future Prospects
←
→
Page content transcription
If your browser does not render page correctly, please read the page content below

Predicting Solar Power Production:
Irradiance Forecasting Models, Applications and Future Prospects

                     Steven Letendre, PhD   Green Mountain College
                                            Vermont

                     Miriam Makhyoun        Solar Electric Power Association
                     Mike Taylor            Washington, DC

                                            March, 2014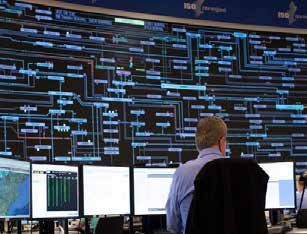
A c k n ow le d g m e nts
    The authors would like to thank the following              Manajit Sengupta, NREL; Tom Hoff, Clean Power
    individuals for taking the time to share their expertise   Research; David Edelson, New York ISO; Marc Keyser,
    and insights on solar forecasting: Jon Black, ISO New      MISO; William Holmgren, University of Arizona;
    England; John Tedesco, Green Mountain Power; Steve         Mark Ahlstrom, WindLogics Inc.; and John Zack, AWS
    Steffel, Pepco Holdings; Joshua Stein, Sandia National     Truepower. While we appreciate the many insights
    Laboratory; Richard Perez, SUNY Albany Atmospheric         provided to us, any errors or omissions in the final
    Sciences Research Center; Drake Bartlett, Xcel Energy;     report are the sole responsibility of the authors.
    Jim Blatchford, CAISO; Dallas Cornier, SDG&E; Jack         Front cover photo of control room has been provided
    Peterson, Southern California Edison; Jan Kleissl,         courtesy of ISO New England.
    University of CA San Diego; Sue Ellen Haupt, NCAR;

    G l os s a r y o f Te r m s
    Area Solar Forecast: A forecast of two or more solar       Insolation: Short for incident or incoming solar
    energy plants.                                             radiation, which is a measure of solar radiation energy
    DG Solar: Solar energy systems deployed within utility     received on a given surface area and recorded during a
    distribution networks.                                     given time.

    Direct normal irradiance (DNI): The amount of solar        Mesoscale NWP: Predictions of regional weather
    radiation received per unit area by a surface that is      patterns.
    always held perpendicular (or normal) to the rays that     Nowcast: A detailed description of the current weather
    come in a straight line from the direction of the sun at   along with forecasts up to 30 minutes.
    its current position in the sky.                           Numerical Weather Prediction (NWP): The use of
    Diffuse Horizontal Radiation (DHI): The amount             mathematical models of the atmosphere and oceans
    of radiation received per unit area by a surface (not      to predict the weather based on current weather
2   subject to any shade or shadow) that does not arrive on    conditions.
    a direct path from the sun, but has been scattered by      Persistence Forecast: Forecasts based on extrapolating
    molecules and particles in the atmosphere and comes        current conditions into the future.
    equally from all directions.
                                                               Point Solar Forecast: A solar forecast for a single solar
    Global Horizontal Irradiance (GHI): The sum of DNI         energy plant.
    and DHI.
                                                               Variable Generation: Sources of power that vary based
    Global NWP: Predictions of global weather patterns.        on weather conditions, including wind and solar.

                                                                        so l a r el ectri c p o w er a sso ciation
C on t e n t s

Contents

Acknowledgments
Contents
List of Figures.......................................................................................................................................................ii
List of Tables.........................................................................................................................................................ii
Executive Summary...........................................................................................................................................iii
1. Introduction.................................................................................................................................................... 1
2. The Solar Resource......................................................................................................................................... 3
    2.1      Fundamentals of solar irradiance....................................................................................................... 3
    2.2      The variable nature of solar energy.................................................................................................... 4
3. Forecasting Solar Irradiance......................................................................................................................... 7
    3.1      Physical methods to forecast solar irradiance................................................................................... 8
             3.1.1 Numerical weather prediction (NWP)..................................................................................... 8
             3.1.2 Cloud imagery............................................................................................................................. 9
    3.2      Statistical/hybrid methods to forecast solar irradiance.................................................................10
    3.3      Understanding solar forecast errors and variability.......................................................................11
             3.3.1	Point versus area solar energy plant predictions and PV power output variability........14
4. Using Solar Power Production Predictions for Utility Planning and Operations...............................17
    4.1      Transmission-level applications of solar energy predictions........................................................17
             4.1.1 CAISO’s approach to using solar power predictions...........................................................21                                           i
    4.2      Distribution-level applications of solar energy predictions..........................................................24
             4.2.1 Case Study: Hawaiian Electric Company..............................................................................25
             4.2.2 Case Study: Tucson Electric Power........................................................................................27
5. Solar Forecast Provider Survey Results.....................................................................................................29
6. Future Developments and Recommendations.........................................................................................33
    6.1      Current solar forecasting research projects.....................................................................................33
    6.2      Conclusions and Recommendations................................................................................................35
                                                                                                                                                                            i
Works Cited........................................................................................................................................................38

Pr ed i ct i ng S o l a r P o w e r P r o d u c tion
L i s t o f F i g ur e s
Figure 1: Modern Solar Forecasting System Schematic............................................................................. iv
Figure 2: National Solar Radiation Data Base (NSRDB) stations by class................................................ 4
Figure 3: U.S. solar resource map .................................................................................................................. 4
Figure 4: Time scale relevant to operating power systems ........................................................................ 5
Figure 5: Illustration of solar plant power prediction system.................................................................... 7
Figure 6: Total sky imager image ................................................................................................................10
Figure 7: Satellite cloud images ...................................................................................................................10
Figure 8: Annual Root Mean Squared Error (RMSE) as a function of forecast time horizon ............12
Figure 9: Surface Radiation Network (SURFRAD) Stations Locations .................................................12
Figure 10: Quantifying Solar Variability ......................................................................................................15
Figure 11: Forecast Solar vs. Actual Output, Northern California............................................................22
Figure 12: Forecast Solar vs. Actual Output, Southern California............................................................22
Figure 13: Forecast Solar vs. Actual Output, Northern California............................................................22
Figure 14: Forecast Solar vs. Actual Output, Southern California............................................................22
Figure 15: California Independent System Operator Day-Ahead Market Timeline................................23
Figure 16: California Independent System Operator Hour-Ahead Market Timeline..............................23
Figure 17: California Independent System Operator Net Load 2012 - 2020 ............................................23
Figure 18: Distribution Impacts of Distributed Generation Solar Hawaiian Electric Company ...........26
Figure 19: Impact on System Load for Hawaiian Island .............................................................................26
Figure 20: Prototype of Variable Generation Display for System Operators ............................................26
ii Figure 21: Prototype Web Interface for Variable Generation Tucson Electric Power Service Territory ......27
Figure 22: Spatial Resolution Capability of Solar Forecast Services...........................................................30
L i s t o f Tab le s
Table 1: SEPA Recommendations to Advance Solar Forecast Market Development...........................iii
Table 2: Annual Error Metrics Day-Ahead and Hour-Ahead Forecasts for
Surface Radiation Network (SURFRAD) Locations.................................................................13
Table 3: Event Example—Up-Ramp or Down-Ramp of 20% Capacity in 1 Hour..............................13
ii
Table 4: Solar Forecast End-Users and Potential Applications..............................................................18
Table 5: Solar Forecasting Service Providers Invited to Complete Online Survey..............................29
Table 6: Number of Forecast Providers Active in Each Area.................................................................30
Table 7: Solar Forecasting Providers Information Needs........................................................................31
so l a r el ectri c p o w er a sso ciationExecutive Summary
Executive Summary
Solar energy represents a vast, renewable resource costs. These studies recommend operational strategies
that can be tapped to meet society’s growing demand and market structure changes needed to address
for electrical energy. Deployment of systems that increased levels of uncertainty that high-penetration of
convert solar irradiance into useful electrical energy renewable resources presents to utility companies and
has accelerated in the past decade in the U.S. and grid operators due to their intermittent nature. The use
globally, particularly for photovoltaic (PV) systems— of advanced forecasting of variable generation is one of
the direct conversion of irradiance to electricity. Utility these essential strategies. Forecasts of future solar energy
companies play an integral part in managing this system output allows grid operators and utilities to
growth and integrating solar generating plants into the proactively manage variable output, and thus integrating
existing grid infrastructure and utility operations. solar resources into the existing grid at lower costs to
Grid integration studies of variable generation resources, society.
including wind and solar, conclude that it is technically This report provides a review of solar forecasting
feasible for these resources to provide a significant approaches and how they are being used by grid
portion of the nation’s energy needs at manageable operators, utility companies, and other market
Table 1: SEPA Recommendations to Advance Solar Forecast Market Development
I. Development The solar forecasting industry lacks a set of standards or industry guidelines, which acts
of Forecasting as a barrier to greater use and understanding of the value of solar forecasting to utility
Standards/ planning and operations. Guidelines or standards with regard to defining forecast time
Guidelines horizons relevant to utility and market operations, measuring and reporting forecast
error metrics, and data and communication requirements for modern solar forecasting
systems are needed.
II. Economic There is a lack of information within the literature on the economic value that solar
Assessment of forecasts could provide to grid operators and utilities. While the value of solar
Solar Forecasting forecasting qualitatively seems quite large relative to the costs associated with
Value Relative to
Costs
producing solar forecasts, there are currently no quantitative analyses to support this iii
notion. Solar forecasts provide value to numerous stakeholders; an attempt should
be made to quantify these values to provide the economic basis for expanded use.
Furthermore, these analyses could help to identify the incremental value associated
with improved forecast accuracy.
III. Distributed While there are various groups working on different aspects of solar deployment and
Solar Working variable generation forecasting, there is a need for a focused effort on DG solar. A
Group and working group comprised of relevant stakeholders should be convened to identify the
Workshops critical issues and begin a collaborative process to address the unique challenges of DG
solar. Periodic workshops should be held to share research and current practices used
to understand and manage the impacts of DG solar and the role of solar forecasting.
IV. Expanded Policymakers and regulators need to gain a greater understanding of the value that
Engagement of solar forecasting can bring to meeting policy objectives, including renewable portfolio
Policymakers and
iii
standards. As grid-connected solar deployment expands and forecasting needs
Regulators increase, utilities, regulators and forecast service providers need to investigate the best
mechanisms in terms of reporting system characteristics providing the needed data to
produce accurate solar forecasts, standards in terms of allocating the costs incurred
by grid operators and utilities associated with solar forecasting, and promoting market
structures and scheduling timelines that leverage modern solar forecasting services.
Pr ed i ct i ng S o l a r P o w e r P r o d u c tionparticipants for planning and operations. This report concludes with a section on future developments and
is based on a survey of the literature and interviews recommendations.
with experts from three broad stakeholder groups
Although the solar forecasting industry is in the early
(ISO/RTO managers, utility managers, and research
stages of market development and acceptance, several
scientists). Seventeen companies globally were
companies currently offer solar forecasting services
identified that potentially provide solar forecasting
to various end-users as part of other services they
services and asked to complete an online questionnaire.
provide to the renewable energy
Thirteen companies completed
industry and other weather-sensitive
the questionnaire, all of whom “Although the solar forecasting industries. Modern solar forecasting
work with utilities or related industry is in the early services use sophisticated
organizations. These companies stages of market development physical numerical weather
use state of the art solar forecasting and acceptance, several prediction models (NWP), cloud
systems to provide customized companies currently offer imagery analyses, and statistical
forecasts to meet their clients’ solar forecasting services”
manipulations to provide state of
particular needs.
the art solar forecasting services
The research and interviews conducted for this report covering a range of forecast time horizons (see Figure
suggest several initiatives that should be undertaken to 1). A point solar forecast is prepared for a particular
accelerate the adoption of solar forecasting in response solar power facility, while an area forecast represents
to the anticipated growth in solar energy system the predicted aggregate output of two or more solar
deployment in the coming decade. These initiatives can power plants within a defined geographic region.
be grouped into the following four broad categories
One study finds that solar irradiance forecast error
presented in Table 1.
measured in root mean square error, a measure of the
The report begins with a review of the variable nature standard deviation of the differences between predicted
of solar and is then followed by an examination of values and observed values, can range from 100 watts
the various ground-level solar irradiance forecasting – 200 watts per square meter depending on the forecast
approaches and models used for each solar production method and time horizon. To place this in context, the
forecast time horizon. Next the various ways in which solar resource is approximately 1,000 watts per square
utilities and grid operators can use forecasts of variable meter for a surface perpendicular to the sun’s rays
generation are explored, including specific uses of at sea level on a clear day. Irradiance forecast errors
solar forecasts at the transmission and distribution vary depending on the overall weather conditions;
iv levels. Given that California is leading the nation in forecasts on clear sky days are more accurate than
the adoption of solar energy, extended coverage of the
Figure 1: Modern Solar Forecasting System
California Independent System Operator’s (CAISO’s) Schematic
uses of a central solar forecast is provided. Extended
coverage of the Hawaiian Electric Company (HECO)
and Tucson Electric Power (TEP) is also provided to DATA
(NWP, CLOUD MOTION, WEATHER, SOLAR PLANT)
highlight efforts at the distribution level to integrate
solar forecasting into energy management systems.
HECO has the highest PV penetration levels of SOLAR PLANT PREDICTION ENGINE
any utility company and is on the leading edge of (PHYSICAL & STATISICAL MODELS)
exploring how to use solar forecasts to manage high
iv penetration of distributed PV. TEP is a power company SOLAR PLANT SIMULATION
and balancing authority in the Southwest that has
experienced significant growth in utility-scale and
distributed PV deployment. Next the results of the solar SOLAR PLANT POWER PREDICTION
forecast provider survey are presented and the report
so l a r el ectri c p o w er a sso ciationExecutive Summary
forecasts on partly cloudy days. Furthermore, forecast
errors are lower for area solar power forecasts relative Solar Forecasting Service ProviderS
to point forecasts due to the fact that aggregation of
geographically disperse systems reduces the random Clean Power Research (U.S.)
impact clouds have on solar generation system 3 Tier (U.S.)
output. There is no standardized approach, however, AWS TruePower (U.S.)
to calculating and reporting forecast error for solar
JHtech--Solar Data Warehouse (U.S.)
system predictions thus making comparisons between
alternative forecasts difficult. Windlogic, Inc. (U.S.)
While much can be learned from the experiences Global Weather Corporation (U.S.)
gained using wind forecasts in the past decade for Green Power Labs (Canada)
utility planning and operations, the distributed nature Iberdrola Renewables, LLC (Spain)
of solar deployment and the impact that clouds have
irSOLaV (Spain)
on solar resource variability create unique and different
challenges. By and large distributed (DG), behind the Meteologica SA (Spain)
meter solar is invisible to balancing authorities and NNERGIX Energy Management, S.L. (Spain)
utility companies meaning they do not have real-time Energy & Meteo Systems (Germany)
production data to provide situational awareness. The
WEPROG (Germany)
demand-side nature of DG solar shows up through
shifting load patterns. While utilities have decades of Reuniwatt (France)
experience with load forecasting, DG solar results in a ENFOR A/S
new element of variability and uncertainty to system Datameteo
load not captured by existing load forecasting methods.
DNV-GL (Garrad Hassan, Inc.)
This is a new paradigm for utilities and much work is
needed to integrate solar forecasting into existing load
forecasting practices. The consistent patterns of load In California the CAISO, utility companies and other
seen over time are changing due to DG solar and thus market participants are using solar forecasting services
load forecasting techniques will need to be modified in for a variety of applications. Similar organizations in
response, including greater emphasis on intra-day and other regions including New Jersey, Hawaii, Arizona,
intra-hour load forecasting. and Colorado are beginning to experiment with using
Utilities and grid operators need to understand total forecasts of solar plant production for operations v
system load, including the load being served by DG and planning purposes. Grid operators and utilities
solar, to provide situational awareness. This is critical in other regions are actively researching forecasting
to proactively prepare for the net load impacts of needs and potential solutions. Regional grid operators
DG solar variability resulting from changing weather and balancing authorities can use forecasts of variable
patterns and emerging cloud formations. Systems and generation to determine the need for operating reserves
models are being developed today to make DG solar and for scheduling utility-scale solar plant generation.
“visible” to grid operators and utilities. Clean Power An emerging use of variable generation forecasting is
Research is currently providing the California System to predict significant ramping events caused by sudden
Operator (CAISO) with forecasts of the 130,000+ DG changes in output from wind and solar generators.
solar energy systems in the State on an experimental Utilities and energy traders can use forecasts of
basis. DG solar forecasts require data on DG solar variable generation to develop bidding strategies for v
systems, most of which is being collected through the hour-ahead and day-ahead markets. Solar energy
net metering approval and interconnection processes, forecasts of distributed, behind the meter solar systems
but might not yet be available for forecasting can be used to create more accurate load forecasts,
organizations to access. as grid operators must prepare to meet system load
net of DG solar. Distribution utilities can also use
Pr ed i ct i ng S o l a r P o w e r P r o d u c tionarea forecasts of distributed solar to gain situational communications between forecast providers and end
awareness to address potential reliability concerns users can be challenging in terms of clearly articulating
within the distribution networks they manage. In forecasting needs and the value that solar forecasting
addition, forecasts of variable generation, both central can bring to utility planning and operations. All
utility scale and distributed systems, can be used for solar forecasting service providers responding to the
planning purposes. In practice today, solar forecasting online questionnaire indicated ongoing research and
is used primarily at the system level to schedule development efforts to enhance their solar forecasting
energy production from large utility-scale solar plants. services.
Developing tools that use forecasts of DG solar is still in Predicting the output of solar energy plants for various
the research and development stage in the U.S. forecast time horizons can be a valuable tool allowing
Based on questionnaire responses, some forecast grid operators and utilities to reduce the costs of
providers report challenges in obtaining timely and integrating solar sources of generation into the existing
reliable data from their utility clients to prepare grid. This report represents a snapshot in time, as we
a solar forecast and in some cases a lack of the anticipate rapid developments in forecasting methods
necessary information technologies to efficiently and uses in the coming years.
integrate with their forecasting systems. In addition,
Types of solar forecast
Type
Day-ahead, hour-ahead, & intra-hour Forecasts based on time horizon.
Central utility-scale vs. DG solar Large-scale vs. Small scale solar installations.
Probabilistic vs. Deterministic A range of possible solar system output based on probability or a
specific output value.
Point vs. Area forecasts Forecasts for one solar plant versus a forecast for an aggregate of
geographically dispersed solar energy systems.
Output vs. Rate of change Forecast of power output versus expected change in output over
vi the forecast time step.
vi
so l a r el ectri c p o w er a sso ciation1220 19th S tr e e t, NW , S u i t e 8 0 0 , Was h i ng t o n, D C 2 0 0 3 6 -2 4 0 5
s o la r e le c tr icp o w er . o r g | T el : + 1 . 2 0 2 . 8 5 7 . 0 8 9 8You can also read