SNAPSHOT REPORT 4: Survey of Public Perceptions of Data Sharing for COVID-19 related purposes - OMDDAC
←
→
Page content transcription
If your browser does not render page correctly, please read the page content below
SNAPSHOT REPORT 4:
Survey of Public Perceptions of Data Sharing for
                    COVID-19 related purposes

           Selina Sutton, Guangquan Li, Matthew Higgs, and Mark Warner

                    With special thanks to our reviewer, Joseph Newbold

                                                      25th August 2021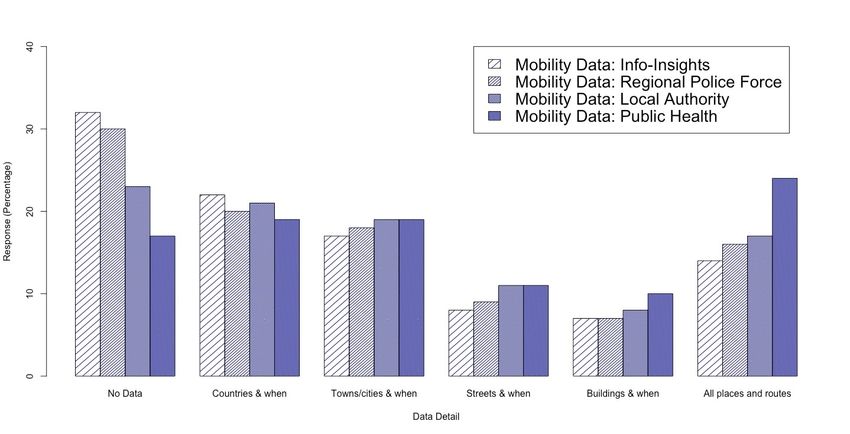
KEY RECOMMENDATIONS

The design of future data-sharing initiatives:
•   should be transparent about which organisations have
    access to what data and when.
     Information should be made publicly available in an accessible
     form from the beginning of the data-sharing initiative to allow
     for informed decision-making. This information should also
     cover inter-organisation data sharing as transparency about the
     limitations of such data-sharing may also allay the public’s
     concerns.
•   should avoid a “one-size-fits-all” approach.
     Bespoke       data-sharing   initiatives and     methods       for
     communicating their design could be developed by
     understanding which social groups or demographics are most
     vulnerable to either being dissuaded from, generally undecided
     about, or resistant to data-sharing and why. Also, local versions
     could be implemented, rather than the design of the data-
     sharing initiative and the methods for communicating its design
     being the same nationwide. This would allow local/regional
     levels of government, such as local authorities, to utilise their
     understanding of and established relationships with local
     communities.
•   should provide options for how much data-detail to share.
     The ability to choose between several ‘levels’ of detail in the
     data that is being shared would allow individuals to engage
     with the data-sharing initiative in a way that they are
     comfortable with. Clearly stating why sharing one level of data-
     detail would be more beneficial than another would also allow
     individuals to make an informed decision based on a greater
     understanding of the impact of their contribution.

                                                                          1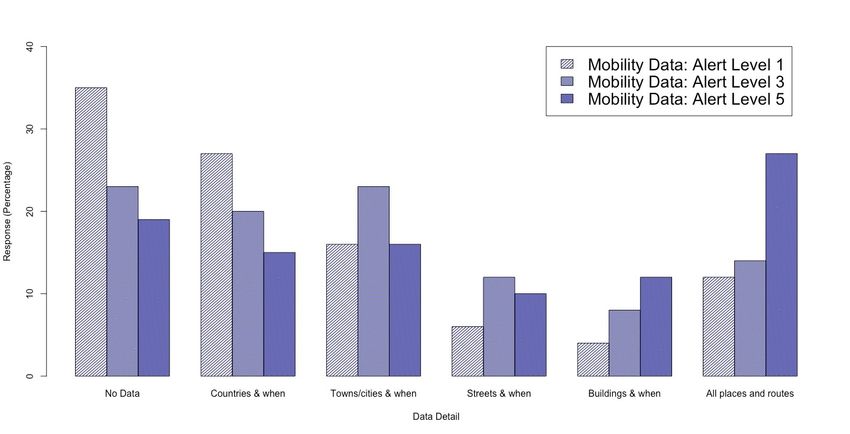
HEADLINE FINDINGS

Our participants prefer to share data when:
  i) the UK COVID-19 Alert level is higher,
  ii) the data is anonymous, rather than identifiable,
  iii) it is shared with a Public Health Body or the Local Authority,
  rather than a Commercial Company or their Regional Police Force
  iv) it is Medical data being shared rather than Mobility data
• And so, which organisations have access to what data and
  when is important to data-sharing decision-making.

Grouping them based on the similarity of their answers, we found 7
clusters of participants within our data. When it comes to data-
sharing, we found groups that are:
   i) Dissuadable (mostly willing but can be unwilling, 19.8%, 199)
   ii) Undecided (mostly ‘neither willing nor unwilling’, 6.5%, 65)
   iii) Resistant to (mostly unwilling, 9.2%, 92)
   iv) and would Opt-out (consistently very unwilling, 3%, 30)
plus 3 groups that are consistently willing to share (total 61.5%, 617)
• And so, it cannot be assumed that the urgency of a global
  pandemic leads to people disregarding their concerns and
    METHOD
  engaging     DETAILS
             with data-sharing initiatives.

We also found that i) the UK COVID-19 Alert level, ii) if the data is
anonymous or identifiable, and iii) the organisation that the data will
be shared with, all influence how much detail participants are willing
to include in the data that they share. Further, the influence of these
factors differs for Medical data and Mobility data.

• And so, the decision-making behind how much detail to
  include in the data being shared is complicated.

                                                                          2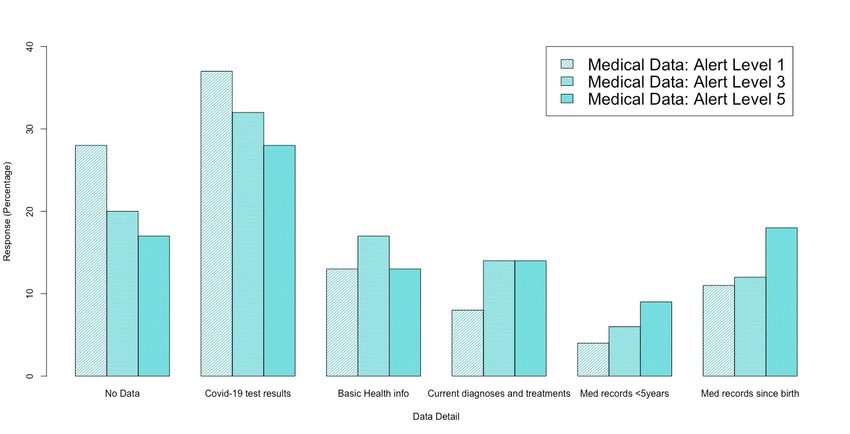
MOTIVATION AND BACKGROUND
Since the start of the COVID-19 pandemic, the UK public have been asked to share data
in ways that have never been seen before, pertinent examples being contact tracing
apps and the regular reporting of COVID-19 test results. These two data in combination
are believed to be one of the most informative sources for understanding and
predicting the spread of the virus - by knowing who is infected and who they are likely
to have transmitted the virus on to - and thus indicate what mitigative approaches have
most effectively minimized the spread of the virus1. But the urgency of the pandemic
meant that there was little time to assess the public’s willingness to engage with such
COVID-19-motivated data-sharing. Not considering public opinion can lead to a lack of
trust and adoption of a data-sharing initiative, as the public’s response to a previous UK-
based, non-pandemic, medical information data-sharing initiative evidences2. Therefore,
knowing what factors (or "attributes") are likely to increase or reduce the general
public’s willingness to engage in a data-sharing initiative is paramount to its success.
In June 2021, we released an online survey and collected responses from a nationally
representative sample of participants (n=1003). Our aim was to investigate how different
attributes of data-sharing scenarios influence participants’ willingness to share data. The
attributes were: i) UK COVID-19 Alert Level, ii) whether data is anonymous or
identifiable, iii) the organisation that it will be shared with, and iv) data type. We wanted
to investigate their influence within a COVID-19-motivated data-sharing initiative,
describing its purpose as “to monitor if the current alert level, and its associated
restrictions, is appropriate.” This also allowed us to consider attributes more broadly,
rather than those of a specific, already existing data-sharing initiative. In this vein, our
initial descriptions of the data type attribute were somewhat ambiguous. In the survey,
we first describe Medical data as “information about your health that is gathered when
visiting your GP, a hospital, or any other NHS or private health-service. Medical data can
be essential health information (such as your weight and whether you smoke) or as
detailed as your full medical record over several years.” And we describe Mobility data
as “reflecting where you have been and when. It can be collected via a number of
means, including mobile phone wifi data. Mobility data can be a list of countries you
have visited or as detailed as the addresses of the buildings you have visited.” Defining
Medical data and Mobility data in this way allows for our findings to inform the design
of future data-sharing initiatives that aim to manage public health during a pandemic
more broadly in terms of the data that they might aim to collect. Later in the survey, we
investigate how much detail participants are willing to share in their data, and in doing
so, specify exactly what Medical data and Mobility data is being shared.
In this snapshot report, we describe our research method and survey design, report an
overview of our participant demographics, and then go through the three main sections
of the survey, summarizing the data analysis, results, and key findings. After which, we
discuss the findings in more depth through making a series of recommendations for
future data-sharing initiatives. Finally, we outline our intended future work.

                                                                                                3
RESEARCH METHOD
We deployed a survey of closed-ended questions using the software Qualtrics.3
Recruitment was conducted via an intermediary, Prolific.ac.4 On our behalf, they
recruited a nationally representative sample in regard to Age (5 categories, each
covering 10 years, from 18 to 58+ years), Sex, and Ethnicity (simplified into
5 categories) according to the UK 2011 Census from the Office of National Statistics.5
The survey was estimated to take 15 minutes (actual mean time was 17 minutes 30
seconds), and participants received £2.23 in renumeration, equating to a rate of £8.43
per hour (the UK’s National Living Wage at the time was £6.56 for 18 to 20 year olds,
£8.36 for a 21 to 22 year olds, and £8.91 for those over 23 years old)6.
The survey included two sets of three attention checks. These attention checks looked
very similar to the other survey questions, but their text gave instructions to be
followed, e.g. ‘’ Click ‘Very Unwilling’ ”, allowing us to make sure that the participants
were carefully reading the questions. At the start of the survey we informed
participants that there would be attention checks and that their data would be
rejected if they failed some of them. Participants received renumeration if they passed
two out of the three attention check questions in each set.
We conducted iterative pilot testing to adjust and edit the survey. We performed two
types of piloting. First, we piloted with 10 participants using the Think-Aloud method
(a researcher observes the participant completing the survey and encourages them to
provide a running commentary of what they are doing and thinking.7) Next, we
piloted our survey on Prolific.ac. We conducted three pilots, the first with 24
participants, and the second and third each with 10 participants. Here, our focus was
on the technical aspects, the labelling and structure of the data collected so that we
could prepare for analysis and estimating the average completion time to ensure
         METHOD
appropriate  participantDETAILS
                          renumeration.
The survey was released at 11am on Monday the 14th of June at a time when there
had been a total of 128,011 Covid-19 related deaths (within 28 days of first positive
test) recorded in the UK8 with 30.2 million people receiving two doses of a vaccine
and a further 41.8 million receiving dose.9 It took just over 48 hours to receive
responses from a nationally representative sample of 1003 participants, the vast
majority of whom submitted responses in the first 24 hours.
The study design was reviewed and approved by an ethics board at Northumbria
University, Newcastle upon Tyne.
This report is an initial overview of the data collected via the main question types in
our survey. Thus, our analysis merely scratches the surface of this dataset and the
insights that we could gain. In the coming months we will conduct more complex
statistical analyses and report these in future publications. We will outline our
intended future work at the end of this report.
                                                                                             4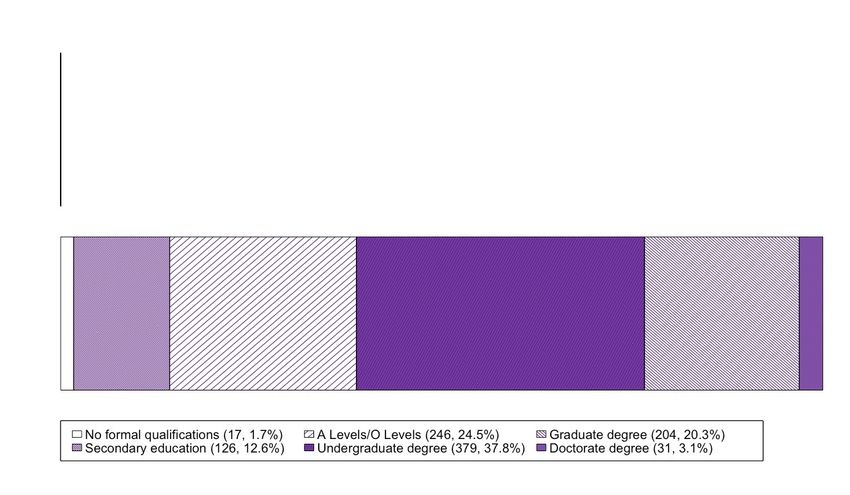
SURVEY DESIGN
                           Overview of the design of the 5 sections in our survey

         To ensure a UK
                                     Section 1. Demographic Questions                             [Public Health Body] differs
                                                                                                  to reflect this answer, e.g.
         representative                                                                           if Country of Residence is
                                      e.g. Age, Gender, Ethnicity, Country of residence
         sample                                                                                   ‘Scotland’ then Level is
                                                                                                  ‘Public Health Scotland’

                               Section 2. Introduce Attributes & Levels
              Attribute      You are in Alert Level..   sharing..   with..                  Your data is..              Fictional
                                                                    [Public Health Body]                                company
                             1 – UK is Covid-19 free    Medical                             Anonymous –
                                                                                                                        to avoid
                                                        data        Info-Insights           no name/address
                             3 – social distancing                                                                      pre-
              Levels         required                                                                                   existing
                                                        Mobility    Regional Police Force   Identifiable –              brand
                             5 – Risk of NHS being      data                                with name /address          biases
                             overwhelmed                            Local Authority

Ambiguous so we
can investigate                                                                                                  17 scenario
more in section 4                                                                                                comparisons
“Data Detail
                                      Section 3. Data Sharing Scenarios
                                                                                                                 with 2 likert
Sliders”                  Approach used known as Choice-Based Multiple Conjoint Analysis10                       scales each,
                                                                                                                 plus 2 attention
                                                                                                                 check scenarios
                                                                                                                 with 2 attention
                                                                                                                 check likert
                                                                                                                 scales each

Scenario
comparison pairs                                                                                                 Tooltip
randomized and                                                                                                   appears
optimized to                   Then Likert Scales to measure willingness in each scenario                        when mouse
ensure maximal                                                                                                   hovers so
data through                                                                                                     participants
minimal questions                                                                                                can remind
                                                                                                                 themselves
                                                                                                                 what the
                                                                                                                 attribute’s
                                                                                                                 levels are

                                                                                                                                    5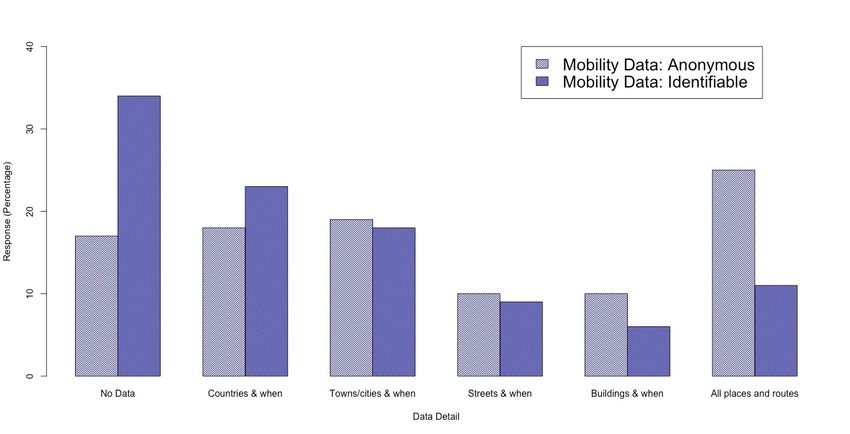
Section 4. Data Detail Sliders
                           ‘Move the sliders along each scale to indicate the amount of detail
                                                 you’d be willing to share.’                                  Organisation
                                                                                                              changes with
                                                                                                              each set of
                                                                                                              sliders

                                                                                                              Notice that
                                                                                                              the scale
                                                                                                              changes to
                                                                                                              reflect the
                                                                                                              data type
Slider sets
randomized

                      Section 5. Perceptions and Experience of COVID-19
          Including “yes/no/I’d rather not say” questions about i) being a key worker, ii) having COVID-19,
          and iii) having an underlying health condition, and likert scale questions for i) risk of getting
          COVID-19, and ii) being seriously ill from COVID-19, e.g…

                                                                                                                             6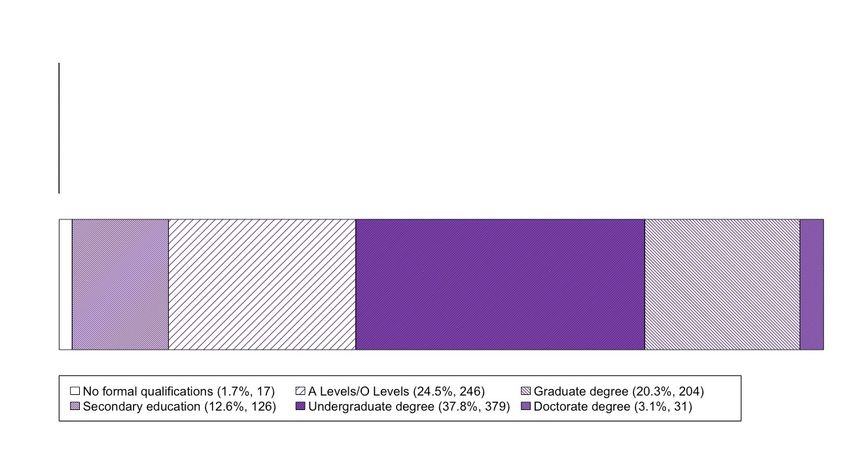
OUR PARTICIPANTS: DEMOGRAPHICS
            Overview of data from Section 1. Demographic Questions

Ethnicity                                                          Age

                                 Sex
                                                                Scotland
                                  Male
                                                                (8%, 76)
                                  (49%, 487)
                                  Female
                                  (51%, 516)

Income

                                                 N. Ireland
                                                 (2%, 25)

                                                  Wales
Education                                         (4%, 41)

                                                              England (86%, 861)

                                                                Country

                                                                                   7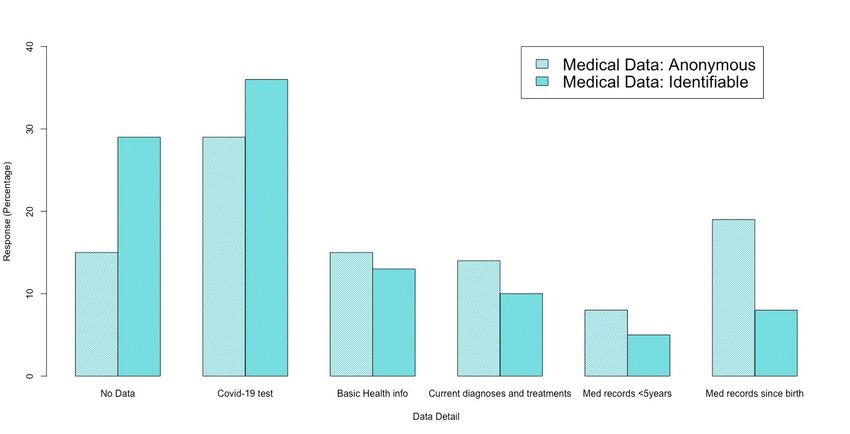
PERCEPTIONS AND EXPERIENCE OF COVID-19
            Overview of data from Section 5. Perceptions and Experience of COVID-19

         I feel my risk of getting Covid-19 is...              (37.5%, 376)           ‘I’d rather not say’
                                                                                                (0.1%, 1)
  (2.7%
   27)

               (10.6%, 106)     (39.2%, 393)                                       (9.9%, 100)

         I feel my risk of becoming seriously ill if I got Covid-19 is...             ‘I’d rather not say’
                                                                                                (0.2%, 2)
 (7.7%
  77)

                                     (28.7%, 288)
                   (17%, 171)                                 (32%, 322)         (14.4%, 143)

         Do you believe that you have had Covid-19?
(17.5%
                                                                                                 (0.5%, 4)
 176)

                                                                                     (82%, 823)
         Do you have an underlying heath condition that you believe makes you
         more vulnerable to becoming seriously ill if you contracted Covid-19?                (1.5%, 14)

  (24%
   242)
                                                                              (74.5%, 747)

         Are you a key / critical worker?

 (18%                                                                                            (1%, 6)
  182)

                                                                (81%, 815)

                                                                                                             8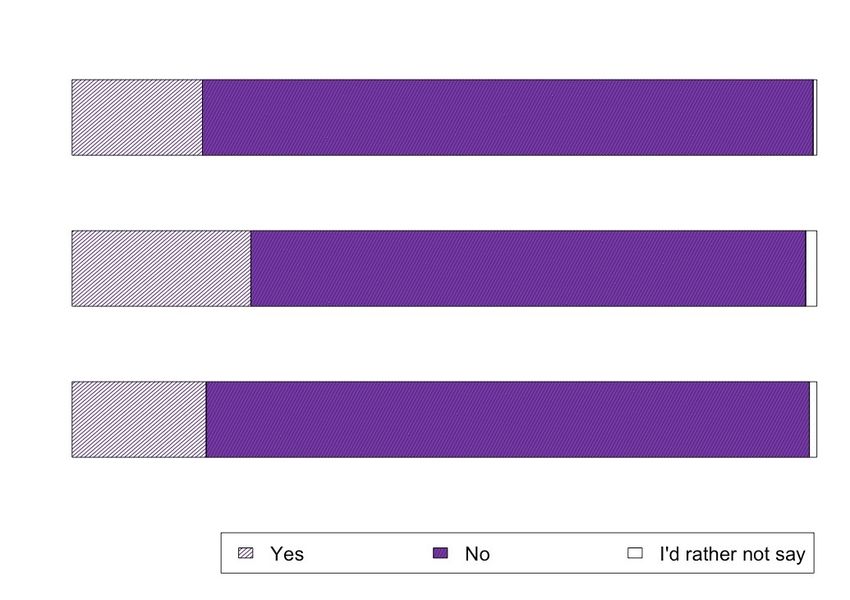
CHOICE-BASED MULTIPLE CONJOINT QUESTIONS
                                              Data collected in Section 3. Data Sharing Scenarios

        KEY FINDINGS
        Our participants preferred to share data in scenarios where:
              • i) the UK COVID-19 Alert level was higher,
              • ii) the data was anonymous, rather than identifiable,
              • iii) it was shared with a Public Health Body or the Local Authority,
                 rather than a Commercial Company or their Regional Police Force
              • and iv) the data was Medical rather than Mobility data

  A reminder of the questions…
   “In which of these two scenarios are
  you more willing to share your data?”

                                 Results: Change in preference
                       (I) Alert level (ref=Level 1)

                                                                                                      Participants showed greater
                          Level 3                                                                     preference for data sharing
                                                                                                      scenarios with higher UK
                          Level 5
                                                                                                      COVID-19 Alert Levels

                       (II) Data type (ref=Medical)
                                                                                                      Participants preferred
                                                                                                      scenarios where Medical
                          Mobility                                                                      n=1003
                                                                                                      data  was shared

                       (III) Data holder (ref=Info−Insights)
                                                                                                      Participants preferred scenarios
                                                                                                      where the data was being shared
                          Local authority                                                             with their Public Health Body and
                                                                                                      Local Authority, but there was no
                                                                                                      difference in preference for
                          Regional Police Force
An interval                                                                                           sharing with a Regional Police
overlapping with                                                                                      Force compared to a
the dashed vertical
                          Public Health                                                               Commercial Company.
line indicates
no change in data-     (IV) Storage (ref=Anonymous)
sharing preference                                                                                    Participants preferred
between the option                                                                                    scenarios where data was
                          Identifiable                                                                shared anonymously
associated with that
estimate and the
reference option                               less willing to share          more willing to share
(e.g. (ref=Level 1)                         Change in data−sharing preference (compared to reference)

                                                                                                                                          9
WILLINGNESS LIKERT SCALES QUESTIONS
Data collected in Section 3. Data Sharing Scenarios
KEY FINDINGS
We grouped participants into clusters (via latent class modelling11) based on
how similarly they answered the likert scale questions.
We found 7 clusters that reflect 7 distinct patterns of answering.
We have named these:
• The Committed to sharing, who consistently answered “Very Willing”
• The Eager to share, who consistently answered “Willing”
• The Discerning Sharer, who answered “Willing” and “Very Willing” equally
• The Dissuadables, who mostly answered “Willing” with some
“Neither Willing nor Unwilling” and some “Unwilling”
• The Undecideds, who mostly answered “Neither Willing nor Unwilling”
as well as “Willing” and “Unwilling” in equal proportion
• The Resistant to Sharing, who mostly answered “Unwilling”
• and The Opt-outers, who consistently answered “Very Unwilling”
A reminder of the questions…
Having chosen the scenario in which they were more willing to share their data
from two options, we then asked:
A couple of notes…
In the survey we also asked this question for the scenario that the participant
did not choose, with a constraint that the willingness level is no higher than
that for the chosen one. For example, if the participant clicked "Willing" for
the chosen scenario then "Very Willing" would not be a clickable option for
the not-chosen scenario. However, for the analysis herein we decided to only
look at the answers that participants gave for the scenarios that they
did choose because we wanted to explore whether participants expressed
the same level of data-sharing willingness across all their chosen scenarios.
10Results: Descriptions of the 7 clusters
The Committed to sharing
(15.3%, 153)
These participants almost always
answered “Very Willing” under the
scenarios that they preferred. This
indicates that the attributes of their
preferred scenarios had little influence
over their data-sharing willingness.
The Eager to share
(20.5%, 206)
These participants almost always
answered “Willing” under the scenarios
that they preferred indicating a similar
situation as was found in
”The Committed to sharing” cluster.
It may be that the participants in these first
two clusters interpret “Very Willing” and
“Willing” slightly differently, leading to a
preference for which of these two answers to
chose. Thus, their separation may be an
artefact of this rather than reflecting two
genuinely different clusters.
The Discerning sharers
(25.7%, 258)
Overall, these participants were willing
to share their data, but some attributes
in the data-sharing scenarios had an
influence over how willing they were.
The Dissuadables
(19.8%, 199)
These participants were mostly willing to
share data although in some cases they
answered “Neither” or “Unwilling”. This
indicates that some of the attributes in
ry g g er llin
g ry the data-sharing scenarios ‘put off’ these
Ve willin wil
lin ith Wi Ve lling
U n U n N e
Wi participants from sharing.
11The Undecideds
(6.5%, 65)
These participants mostly answered
“Neither willing nor unwilling”, and then
“Willing” and “Unwilling” in near equal
measure suggesting that they were
mostly undecided. This indicates that
the attributes of their preferred data-
sharing scenarios were critical to their
decision making.
The Resistant to sharing
(9.2%, 92)
These participants were mostly unwilling
to share their data, however in some
cases they answered “Neither” and also
answered “Willing” occasionally. This
indicates that there were attributes in
their preferred data-sharing scenarios
that persuaded them to share.
The Opt-outers
(3%, 30)
These participants almost always
answered “Very Unwilling”, indicating
that the data-sharing scenario attributes
had very little influence over their
ry g g er g ry answer.
Ve willin illin ith llin Ve lling
n w e Wi
U Un N Wi
REFLECTIONS
The existence of these 7 clusters suggests that individual experience and
opinion influences willingness to share data in addition to the data-sharing
scenario attributes that we examined in our survey. It may be that the
amount of information about a data-sharing initiative that is needed in
order to become comfortable with engaging with it varies across these
clusters. One way to address this would be to identify those who are
currently not engaging but have the potential to (e.g. The Dissuadables
and The Undecideds), ascertaining what aspects of the data-sharing
initiative cause their hesitation, and then ensure that the information that
they need to be able to make an informed decision is readily available.
12DATA DETAIL SLIDERS
Data collected in Section 4. Data Detail Sliders
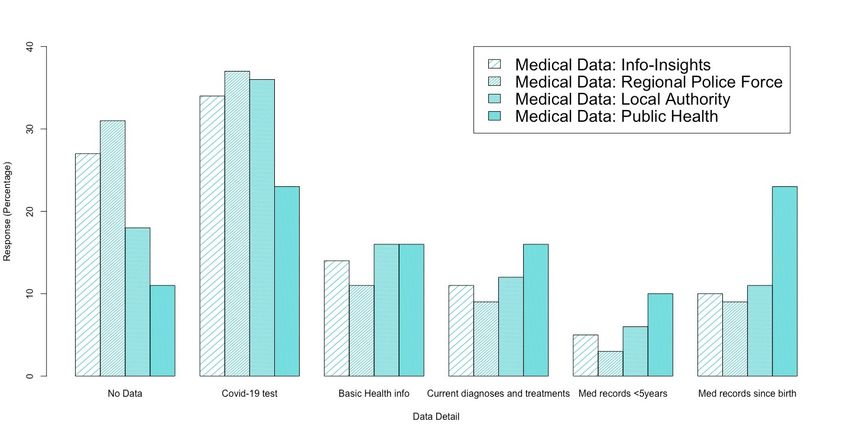
KEY FINDINGS
• All the Data Attributes appear to influence how much detail participants are
willing to include in the data they share. The results of our statistical analysis
(ordinal logistic regression12) support this observation, as all the levels of all the
attributes are statistically significant (pCOVID-19 Alert Level
More participants were willing to share Across all 3 alert levels, sharing COVID-19
more-detailed data when the alert level test results was the most popular choice.
was higher (level 5). Aside from this, more participants were
willing to share more-detailed data when
More participants would share less- the alert level was higher (level 5). More
detailed data if the alert level was lower participants would share less-detailed data
(level 1). if the alert level was lower (level 1).
s
s
/ s
th s
ts
es
at es
ta s
o
rie
ta
rd
et
& gn nt
ng
bir ord
ns
su 9
inf
en
da nt n ac es
da
re hen ildi en
re -1
tre os
yr co
w s& dia rre
he sic
l
lt
ce rec
m
t
st ID
u
h
o e o lp t
5 re
No
Cu
o
C wh S w Bu wh
alt
T itie n
Ba
N Al rou
te V
s
< d
sin d
&
CO
c he
e
e
& &
M
&
M
w
Data Holder
More participants were willing to share Across three of the data holders, most
more-detailed data with their participants chose to share their COVID-
Public Health Body. 19 test results. The exception is Public
More participants would share less- Health Bodies - the same number of
detailed data with a commercial company participants chose to share their COVID-19
(‘Info-Insights’) or their test result as those who chose to share all
Regional Police Force. their Medical records since birth.
s / s
ta rie s es
s
et ng
th s
ns &
ts
at es
o
ta
rd
nt n
bir ord
da
& agn nt
ac es
su 9
re hen ildi en
inf
en
da
re -1
w
tre os
l
yr co
di rre
u t
he sic
o e s
To itie n lp t
lt
ce rec
m
o
st ID
S w Bu wh
h
C wh
5 re
N Al rou
No
Cu
alt
Ba
te OV
c he &
s
< ed
sin ed
& & &
w
C
M
M
14RECOMMENDATIONS
Our first recommendation is that the communication of the design of
data-sharing initiatives should be transparent about which organisations
have access to what data and when.
Our survey’s choice-based multiple conjoint questions highlight the importance of who
the data is being shared with. For example, our participants preferred scenarios where
the data was being shared with their devolved nation’s Public Health Body or their
Local Authority over their Regional Police Force. Furthermore, there was little
difference in preference for sharing with their Regional Police Force and a commercial
company. A previous OMDDAC report includes an outline of the risks and challenges
surrounding police services requesting access to identifiable test and trace data for
enforcement purposes13, and it may be that our participant’s concerns reflect these. As
is also stated in this previous report, there is limited information in the public domain
of exactly how such data is shared, used and stored.
Therefore, in the future it would be beneficial for information about data-sharing
initiatives to be available to the public in an accessible form from the outset in order to
CONCLUSIONS
allay concerns and allow informed decision-making. Specifically, this information should
be easy to find and understand. This information should include, at a minimum, what
data is being collected, when, and if it will be stored with identifying information, as
our analysis found these attributes of a data-sharing scenario to also be pertinent to
decision-making. Further, it would also be beneficial to include how and why an
organisation is collecting data, and how it will be used and stored. In addition, details
of inter-organisation data-sharing (e.g. a Public Health Body sharing data that it holds
with the police), the limitations on such data-sharing, and what governance measures
will be in place should also be publicly available.
Our second recommendation is that the design of future data-sharing
initiatives should avoid a “one-size-fits-all” approach.
Our findings evidence that it cannot be assumed that the urgency of a situation such as
a global pandemic is pressurising enough for the public to disregard their concerns
and engage with data-sharing initiatives. While we found that our participants showed
greater preference for sharing data as the COVID-19 alert level increased in our
Choice-Based Multiple Conjoint Analysis, our cluster analysis of the Willingness Likert
Scale data revealed groups of participants who are vulnerable to being dissuaded
(19.8%, 199), are generally undecided (6.5%, 65), are resistant to engaging (9.2%, 92),
or would completely opt-out (3%, 30) of the set of data-sharing scenarios that we
presented to them.
15This result directs us, and those designing data-sharing initiatives, to consider who
makes-up these clusters and why people may respond in this way. Indeed, the
RECOMMENDATIONS
existence of these clusters aligns with our previous report14 in which we relay the
difference in use of the NHS contact tracing app across social groups and
demographics. Bespoke data-sharing initiatives and methods for communicating their
design could be developed by understanding which social groups or demographics
are most vulnerable to either being dissuaded from, generally undecided about, or
resistant to data-sharing and why. Further, an alternative to data-sharing initiatives
that are consistent nationwide would be many local versions. Inspiration can be taken
from the many local authorities that implemented bespoke services for addressing the
various ramifications of COVID-191, their effectiveness reflecting knowledge and
established relationships with the local communities.
A final recommendation for the design of data-sharing initiatives is to
provide some options for how much data detail to share.
The answers to our Data Detail Slider questions clearly illustrate a diversity of
willingness regarding how much data-detail to share. We have found that all the
attributes influenced how much detail participants are willing to include in the data
that they share. Also, the different patterns in our survey data evidence that the
influence of these factors differs when sharing Medical dataCONCLUSIONS
and Mobility data. The
complexity of this decision-making indicates that when designing a data-sharing
initiative it would be difficult to identify an amount of data-detail that the majority of
the public would be comfortable in sharing.
Surveying current COVID-19 data-sharing initiatives, it seems that the dominant
approach is ‘all-or-nothing’ (with ‘all’ referring to the specific data that the data-
sharing initiative wishes to collect, rather than all a person’s data, of course). Thus, if
someone was concerned about the amount of data-detail that a data-sharing initiative
requested from them, their options are limited to engaging regardless or not
engaging. Therefore, giving individuals the ability to choose between several ‘levels’
of detail in the data that they are sharing would allow them to engage with the data-
sharing initiative in a way that they are comfortable with.
The data-detail levels would have to be appropriate for addressing the purposes for
data collection without collecting more data than is necessary. Further, justifying each
data-detail level, and contrasting them in terms of what additional insight or learning
the data-sharing initiative can gain if one level of data-detail was shared compared to
another, would also allow individuals to make informed decisions about data-sharing
that are based on a greater understanding of the impact that their contribution will
have.
16FUTURE WORK
The analysis reported herein merely scratches the surface of this dataset and the
insights that we could gain. Our initial next step would be to further interrogate the
data from each of our question types. For example, our analysis of the Willingness
Likert Scales does not currently incorporate what the attributes of the data-sharing
scenarios were. On the few occasions that the participants in the ‘Undecideds’ cluster
did say they were ‘Willing’ to engage with a data-sharing scenario, what were the
attributes that persuaded them? We could also incorporate results from the cluster
analysis into the modelling of the Data Detail Slider data. Since it appears that
participant decision-making differs when considering the amount of detail to share in
their Medical data and their Mobility data, we could compare participant’s cluster
membership across the Mobility data and Medical data slider answers.
Afterwards, the next step would be to incorporate the participant demographic data,
and the perceptions and experience of COVID-19 data, into our analysis. By doing
this we can ask whether these factors influenced our participant’s willingness to share
data. Prior work has found that there are differences in attitudes to data uses across
demographic groups15, and the mounding evidence of COVID-19’s disproportionate
impact on demographic groups16,17 further motivates this investigation.
Notably, we will assess the demographic make-up of the 7 participant clusters that we
have identified. Knowledge that a cluster is dominated by a certain demographic
would inform our hypotheses for why that cluster’s answers patterned in a certain way.
After identifying clusters of particular interest, we can invite the participants in these
clusters to complete an additional survey, or be interviewed, to investigate the
connection between their social background and their willingness to share data. This
knowledge can then be utilized to design and communicate the design of data-
sharing initiatives to address the concerns of those who are currently less engaged.
CONCLUSION
Our findings from this initial analysis of our survey data re-emphasise how complex
decision-making around data-sharing can be, as has been identified in previous work.
15,18
Further, while we cannot rule out that a global pandemic has no impact on this
decision making, these findings clearly evidence that the urgency of such a situation
does not lead to the public surrendering their data with no concern. Thus, our work
offers implications for the future design of data-sharing initiatives that aim to manage
public health during a pandemic. Further, considering the Government’s intention to
continue and potentially increase data-sharing practices post-pandemic19,20,
our research provides important insights into the public’s reaction to and engagement
with such data-sharing activities and has implications for their design.
17REFERENCES
1. Rachel Allsopp, Claire Bessant, Sneha Dawda, Charlotte Emmett, Matthew Higgs,
Ardi Janjeva, Marion Oswald Guangquan Li, Selina Sutton and Mark Warner.
‘Snapshot Report 1: Data-Driven Public Policy.’ 18th May 2021.
https://www.omddac.org.uk/wp-content/uploads/2021/05/OMDDAC-Snapshot-
Report-1-Public-Policy.pdf
2. Rebecca Hays and Gavin Daker-White, ‘The care.data consensus? A qualitative
analysis of opinions expressed on Twitter.’ (2015) 15(838) BMC Public Health,
https://doi.org/10.1186/s12889-015-2180-9
3. Qualtrics, ‘Qualtrics.’ Version June 2021. Available at: https://www.qualtrics.com
4. Prolific, ‘Prolific.’ Version June 2021. Available at: https://www.prolific.co
5. Office of National Statistics, ‘2011 Census.’
https://www.ons.gov.uk/census/2011census Accessed 12th August 2021.
6. Gov.UK, ‘National Minimum Wage and National Living Wage rates.’ Available at
https://www.gov.uk/national-minimum-wage-rates Accessed 12th August 2021.
7. Monique W.M. Jaspers, Thiemo Steen, Cor van den Bos, and Maud Geene, ‘The think
aloud method: a guide to user interface design.’ (2004) 73(11-12) IJMedInf,
https://doi.org/10.1016/j.ijmedinf.2004.08.003
8. Gov.UK, ‘Coronavirus (COVID-19) in the UK: Vaccinations in United Kingdom.’
Available at https://coronavirus.data.gov.uk/details/deaths Accessed 12th August
2021.
9. Gov.UK, ‘Coronavirus (COVID-19) in the UK: Deaths in United Kingdom.’
https://coronavirus.data.gov.uk/details/vaccinations Accessed 12th August 2021.
10. Damaraju Raghavarao, James B. Wiley, and Pallavi Chitturi, ‘Choice-Based Conjoint
Analysis: Models and Designs’ (CRC Press 2010)
11. BridgetMETHOD DETAILS
E. Weller, Natasha K. Bowen, and Sarah J. Faubert, ‘Latent Class Analysis: A
Guide to Best Practice.’ (2020) 46(4) J. Black Psychol,
https://doi.org/10.1177/0095798420930932
12. David G. Kleinbaum, ‘Logistic Regression. A Self-Learning Text’ (Springer
Science+Business Media, LLC)
13. Ardi Janjeva, Rachel Allsopp, Claire Bessant, Sneha Dawda, Charlotte Emmett,
Matthew Higgs Guangquan Li, Marion Oswald, Selina Sutton and Mark Warner.
‘Snapshot Report 3: Policing and Public Safety.’ 18th May 2021.
https://www.omddac.org.uk/wp-content/uploads/2021/05/OMDDAC-Snapshot-
Report-3-Policing-and-Public-Safety.pdf
1814. Sneha Dawda, Rachel Allsopp, Claire Bessant, Charlotte Emmett, Matthew Higgs,
Ardi Janjeva, Marion Oswald, Guangquan Li, Selina Sutton and Mark Warner.
‘Snapshot Report 2: Tech Driven Approaches to Public Health.’ 18th May 2021.
https://www.omddac.org.uk/wp-content/uploads/2021/05/OMDDAC-Snapshot-
Report-2-Tech-Driven-Approaches-to-Public-Health.pdf
15. Helen Kennedy, Mark Taylor, Susan Oman, Jo Bates, Itzelle Medina-Perea, Hannah
Ditchfield, Lulu Pinney, ‘Living with Data survey report.’ 6th June 2021.
https://livingwithdata.org/project/wp-content/uploads/2021/07/living-with-data-2020-
survey-full-report-final.pdf
16. Public Health England. ‘Disparities in the risk and outcomes of COVID-19.’ August
2020
https://assets.publishing.service.gov.uk/government/uploads/system/uploads/attach
ment_data/file/908434/Disparities_in_the_risk_and_outcomes_of_COVID_August_202
0_update.pdf
17. HM Government. ‘Third quarterly report on progress to address COVID-19 health
inequalities.’ May
2021.https://assets.publishing.service.gov.uk/government/uploads/system/uploads/at
tachment_data/file/988838/Third_quarterly_report_on_progress_to_address_COVID-
19_health_inequalities.pdf
18. Todd Hartman, Helen Kennedy, Robin Steedman, and Rhianne Jones, ‘Public
perceptions of good data management: Findings from a UK-based survey.’ (2020) 7(1)
Big Data and Society, https://doi.org/10.1177/2053951720935616
19. Department for Digital, Culture, Media and Sport. ‘Policy paper: National Data
Strategy.’ 9th December 2020. https://www.gov.uk/government/publications/uk-
national-data-strategy/national-data-strategy accessed 12th August 2021.
20. Department of Health and Social Care. ‘Data saves lives: reshaping health and social
METHOD
care with DETAILS
data (draft).’ 28th July 2021.
https://www.gov.uk/government/publications/data-saves-lives-reshaping-health-and-
social-care-with-data-draft/data-saves-lives-reshaping-health-and-social-care-with-
data-draft accessed 12th August 2021.
19You can also read