Achievement Plan Christian Education Network Community of Learning - Education.govt.nz
←
→
Page content transcription
If your browser does not render page correctly, please read the page content below
Christian Education Network Community of Learning
                                 Te Ropu Whakapono o Waitaha1

                            Achievement Plan

                                              Vision
              “To be a community of faith in which our pupils encounter Christ,
                     excel in their learning and are equipped to serve.”

                                          Whakatauki
                             E kore hoki te aho takitoru e motu wawe
                       A cord of three strands is not quickly broken (Eccl 4:12)

1
    "a group of faith" in Canterbury
Our Community – Profile and Background There is a strong history of cooperation between the schools within this community. The first four schools listed below have been part of the Christian Schools Network (CSN) in Christchurch which was seeded in 2003 and approved as a network by the Minister of Education in 2008. A strong bond of trust and collaboration across all spheres of school leadership has been built on this relationship. Christchurch Adventist School has a growing connection with CSN schools via regular New Zealand Association for Christian Schools S.I. Principals’ meetings, and since 2012 as part of the Christian Schools Network Learning Community Cluster (CSN LCC). The CSN LCC was established in 2012 as part of the earthquake recovery programme in Christchurch. Its purpose was to work together to develop a CSN LCC Plan aimed at providing a seamless high quality Christian education from ECE to Tertiary level for Christchurch families. Initiatives in the plan focused on transitioning students into school from ECE and into Year 11 Senior College in Middleton Grange, curriculum collaboration in maths, science and languages (Mandarin), and IT – managing IT risk in a Special Character environment. Over 2015 and into 2016 CSN LCC Principals and Boards of Trustees discussed the possibility of forming a Christian Schools Community of Learning. These discussions focused on strengthening and broadening collaboration across schools to continue lifting student achievement and increase good practice, and the clear pathways that exist within the network of Christian schools. There was also discussion with two ELCs and two Tertiary Institutions exploring their interest in being part of a Christian Community of Learning. The two Cornerstone Christian Early Learning Centres are co-located with Aidanfield Christian and Middleton Grange schools and there is a strong pathway from them into the respective schools. There are growing connections with the two tertiary institutions with Vision College providing some courses for Gateway students and Laidlaw applying to provide Christian teacher training. The Minister of Education accepted the expressions of interest of 5 schools, 2 ELCs and 2 Tertiary institutions and approved the formation of a Community of Learning in December 2016. Rolleston Christian School was established in 2015 as part of the CSN. In June 2017 its Board of Trustees expressed its interest in becoming part of this COL. Aidanfield Christian School (ACS) Year 1-10 Emmanuel Christian School (ECS) Year 1-10 Hillview Christian School (HCS) Year 1-10 Middleton Grange School (MGS) Year 1-13 Christchurch Adventist School (CAS) Year 1-13 Rolleston Christian School (RCS) Year 1 - 8 Cornerstone Christian Early Learning Centre Aidanfield Cornerstone Christian Early Learning Centre Middleton Laidlaw College Vision College Our Community of Learning includes over 2,600 students from Year 1 – 13, with individual school sizes ranging from 110 to 1,290 domestic students. There is a clear pathway from the Year 1-10 schools into Year 11 at Middleton Grange with in excess of 85% of students making this transition. Rolleston Christian as a new school is yet to establish a clear pathway, but it is likely this will also be into another CSN school at Year 9. As an area school CAS provides its own pathway of learning from Year 1-13 with little crossover into the other schools. Christian Education Network COL (CENCOL) Achievement Plan Page |2
Our school communities are diverse
Denominationally
Ethnically2
TOTAL EUR MAO PAS ASI MELAA OTH
School Name N % % % % % %
Aidanfield Christian School 273 56.0% 6.2% 2.6% 23.8% 9.9% 1.5%
Christchurch Adventist School 224 32.1% 4.5% 22.3% 25.9% 12.1% 3.1%
Emmanuel Christian School 167 59.9% 9.0% 3.0% 14.4% 10.8% 3.0%
Hillview Christian School 532 74.6% 12.8% 7.0% 3.0% 2.1% 0.6%
Middleton Grange School 1280 68.4% 4.6% 4.3% 17.0% 5.2% 0.5%
Rolleston Christian School 110 62.8% 7.3% 3.6% 11.8% 11.8% 2.7%
Economically – with many families making considerable sacrifice to secure a Christian
education for their children
Our school deciles range from 5 to 9
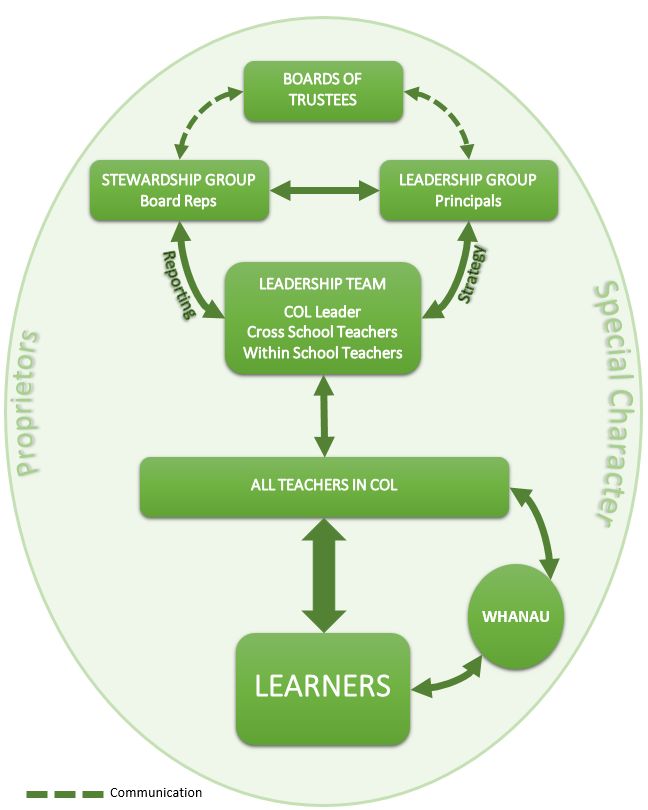
Our Structure
Our community currently operates under the following structure3:
Leadership Group – the principal of each school and a Head Teacher representing ELCs. This
group is working to gather and analyse data and develop the achievement plan. It reports to
the Stewardship Group.
Stewardship Group – is made up of a BOT delegate from each school and a delegate from the
Cornerstone ELC Board of Management. Stewardship Group members have delegated
decision making authority from their respective boards to streamline the decision making in
the set up phase of the COL. They report to their boards and seek input as required. This
group has been meeting to establish operating structures and processes for the COL, provide
oversight of the Leadership Group and to monitor development of the achievement plan.
Our Process for engagement
Working together with other schools on strategic goals and collaborating on curriculum is not
new to the schools in our COL because of the development of the Christian Schools Network
(CSN) and the CSN LCC. Our school communities were intensively consulted at the onset of
these initiatives, and continue to be consulted around charters etc, so COL Leaders are very
aware of their communities’ desires and aspirations. This is being fed into COL development.
The Leadership Group have met a number of times to discuss possible achievement
challenges. Principals were allocated one of the achievement challenges to prepare the
narrative, targets and data analysis in consultation with relevant stakeholders or expertise in
the field. Draft plans were circulated to the Stewardship Group for initial feedback. Suggested
changes were incorporated. Feedback was also sought from the MOE COL advisers. Once the
achievement plan was finalised by the Leadership Group it was submitted to the Stewardship
2
Based on July 2016 Roll returns, domestic students only
3
See Appendix 1 for diagram of organisational structure
Christian Education Network COL (CENCOL) Achievement Plan Page |3Group for approval. Stewards have kept their respective boards informed and consulted with
them as appropriate through this process.
Specific consultation with school communities re COL at this time is seen mainly as conveying
information (keeping parents up to date on COL development) via newsletters and providing
opportunity for feedback on this. As time goes on, a plan for common communication across
schools will be developed. We plan to ‘relish and enjoy the success as it is realised’4.
A launch date (7 August 2017) of the COL is planned to present and engage staff from all the
schools in the rationale for the achievement challenges and begin the process for
implementation.
Our Achievement Challenges
Our shared Christian faith drives our purpose of ensuring every student makes the most of
their God-given talents, encounters Christ in the curriculum and is equipped to serve him in
society. Our concern is for the academic achievement of our students (head) and for how
learning shapes their attitudes (heart) and actions (hands). It is this that drives our vision: “To
be a community of faith in which our pupils encounter Christ, excel in their learning and are
equipped to serve.”
We have identified learning challenges across our COL concerning achievement in writing in
the middle years and our ability to equip the growing number of ELL students in our schools
to succeed. The two schools with senior colleges have identified NCEA endorsements as an
area of challenge.
We have looked for an underlying theme in these challenges that could help us determine a
high-level strategy to address them. The recurring theme that arose throughout our
discussions was building ‘deep thinking’. Not only will this strategy assist in our identified
learning challenges, but it has potential to impact all curriculum areas and year levels.
We have also identified some inconsistencies in data collection and assessment tools used
across our COL, so one of the early tasks of the COL Lead Principal and Across School
Teachers will be to identify what data is required for each achievement challenge and how it
will be collected. This will enable more accurate analysis of the current position of learners
and the progress they make against targets set by the COL.
As a Community of Learning, with clear educational pathways through our schools we
recognise that when it comes to addressing these challenges we are stronger together than
alone – “E kore hoki te aho takitoru e motu wawe” [A cord of three strands is not quickly
broken (Eccl 4:12)]
We also recognise that all educational initiatives our schools participate in have at their core
the Special Character overlay and the achievement challenges should be understood in this
light.
The expected length of time for each Achievement Challenge to be accomplished varies
according to the magnitude of the challenge and the expected level of pedagogical change
needed.
4
Refer MOE Kāhui Ako Personalised Pathways Kit – Iwi Partnerships
Christian Education Network COL (CENCOL) Achievement Plan Page |4For example, in Writing, all schools have trialled various strategies over the past five years to improve Writing, with limited success. In order to achieve the shifts in student achievement we will have to research, identify and embed significantly new approaches to the teaching of Writing. Year 7 is also an entry point to a number of schools in the Community of Learning which means extra measures need to be identified for assessing the entry point of the students’ achievement. This is why this Achievement Challenge looks out to 2022 completion date. The ELL Achievement Challenge has a shorter length of time. One area to focus on first is the correct identification of these students. Then there are two years of strategy implementation for two Year levels in the schools to ensure the strategies implemented can be rolled out to other Year levels in future years. Christian Education Network COL (CENCOL) Achievement Plan Page |5
ACHIEVEMENT CHALLENGE 1
                             Written Language

Background

We know that Literacy is integral to students’ learning in all learning areas. It is imperative that
our students are able to communicate not just orally but also through written language.
Unfortunately, this area of learning does not seem to be a real strength for New Zealand
students from Year 1 – 8.

Historically, New Zealand-wide National Standards data has indicated that achievement levels
in Written Language have been consistently lower than in Reading and Mathematics, and that
boys achieve at a lower level in writing than girls. Longitudinal National Standards data for our
COL (Tab. 1) confirms that these national trends of lower achievement in writing and of boys
achieving at a lower level than girls in the National Standards in Writing across Years 1 – 85 are
evident in our Community of Learning.

Table 1
          Percentage of CENCOL students at or above in National Standards in Writing
                                    2012        2013       2014       2015       2016
          All students             79.7%       79.2%      78.1%      78.8%      75.5%
          Girls                    85.4%       85.4%      83.4%      84.4%      84.1%
          Boys                     73.6%       72.9%      72.9%      73.3%      66.9%

Breaking down 2016 National Standards data by year level shows lower achievement in writing
for students in Years 7 and 8 compared to students in Years 1 to 66. We also identify that
students in Years 9 and 10 are less likely to be at the expected New Zealand Curriculum (NZC)
levels for writing. It would appear that nationally there is an increasing gap between NZC
expectation and the achievement of students in writing in Years 7 to 10. This increasing gap is
also seen in the achievement levels within our COL7. Further analysis by gender also highlights
a significant disparity between the achievement of boys and girls in writing (Tab. 2).

Table 2
                              2016 Written Language - % At and Above
                                      All       Boys        Girls   Variation
                     Year 7         67.6%      49.6%       85.0%     35.4%
                     Year 8         57.0%      43.3%       69.5%     26.2%
                     Year 9         42.8%      36.0%       48.7%     12.7%
                     Year 10        65.1%      58.2%       72.0%     13.8%
                     Year 7-10      58.2%      47.1%       68.6%     21.5%

5
  MOE supplied data re COL NS Achievement. (Rolleston only included in 2016 data due to very recent join up).
6
  See Appendix 2 Table 1
7
  See Appendix 2 Table 2
Christian Education Network COL (CENCOL) Achievement Plan                                           Page |6
To lift overall achievement in Year 7 to 10 written language, our data supports a targeted focus
on improving the engagement and achievement of boys.
Collated National Standards data8 points to a possible additional focus on the achievement of
Māori students in Writing with 99 of 144 (68.8%) achieving at or above National Standards, but
insufficient information is available at this time in terms of Year level and gender breakdown of
Māori students to determine where this focus would be. It is expected this gap in data will be
addressed by the potential actions listed after the table on the following page.
8
See Appendix 2 Table 1
Christian Education Network COL (CENCOL) Achievement Plan Page |7Achievement Challenge To lift achievement in written language for all students in Years 7-10 with a
particular focus on boys.
Achievement Targets 20169 201810 2019 2020 2021 2022
Baseline
1. To lift the written language achievement of
Year 7-10 students so 73% are AT or ABOVE 58% 61% 64% 67% 70% 73%
the appropriate curriculum level by 2022. (502/862) (526/862) (552/862) (578/862) (603/862) (630/862)
This is a shift of 128 students.
2. To lift the written language achievement of
Year 7-10 boys so 62% are AT or ABOVE the 47% 50% 53% 56% 59% 62%
appropriate curriculum level by 2022. This is (196/416) (208/416) (220/416) (233/416) (245/416) (258/416)
a shift of 62 boys.
9
See Appendix 2 Table 2
10
Note all numbers are calculated on 2016 rolls – these will vary from year to year.
Christian Education Network COL (CENCOL) Achievement Plan Page |8Potential Actions
In order to achieve our target of lifting the level of achievement of boys in Years 7 – 10, the
central focus of our inquiry will be to lift the learning achievement of Year 3 – 8 boys in Written
Language, as most of these students are likely to be part of our Middle School programme in
the next 5 years. While the focus will be on boys, we believe that all students will benefit by
positive changes to teaching and learning across the Christian Education Network Community
of Learning.
Schools that have been involved in successful professional development initiatives (e.g.
accelerated literacy learning (ALL) or similar literacy programmes) will be identified in order
that professional learning is shared collaboratively across the community.
A Literacy Leader, with highly effective strategies, will be appointed from within the COL to
assist the designated In-school Lead Teachers to:
carry out an in-depth analysis of achievement in Writing
analyse achievement data across students within the COL, including the year and
gender breakdown for Māori students to identify where there are patterns
within/across cohorts and priority learners requiring assistance
scope current best practice in data gathering and applied analysis
develop a shared understanding and synergy amongst teachers of best practice in the
teaching and learning of Writing
collaborate with teachers in their own schools/across schools to enhance and
transform classroom writing practice, with a focus on strategies to engage and progress
students in their learning of Writing
adopt culturally responsive practices for Māori to improve literacy
Christian Education Network COL (CENCOL) Achievement Plan Page |9ACHIEVEMENT CHALLENGE 2
NCEA Endorsements
Background
Of the 6 schools within the Christian Education Network Community of Learning, 2 are full
Year 1 – 13 Area Schools delivering NCEA Qualifications, namely, Christchurch Adventist
School (CAS) and Middleton Grange School (MGS). At face value, and measured solely by
NCEA results, both schools are performing to a very high standard. Both schools are well
above the former Better Public Service goal of “85% of 18 year olds will have achieved
NCEA Level 2 or equivalent.” While this target has been removed by the government it
sets a good benchmark for schools. Pass rates for CAS and MGS range from 93% to 100%
across Levels 1 – 3.11
In determining what might be a reasonable and valid Curriculum Achievement Challenge
for NCEA students, increasing the % pass rate from 93% to 95%, while admirable, is
investing considerable resource to move 2 or 3 students from Not Achieved to Achieved.
This is significant for those individual students however we believe that a focus in another
aspect of NCEA performance would capture those students as well.
We also felt it important not to have a rigid or narrow focus on pass marks alone. It is not
just the ‘quantity’ of students passing that is important, but also the ‘quality’ of their work,
the depth of their critical thinking that is as important. The benefits to society, to the
students’ future contribution in their vocation can be enhanced when students are
required to think broadly and deeply about the curriculum.
This depth of thinking is reflected within the NCEA Framework, where each Curriculum
Achievement Standard provides 3 levels of attainment:
Achieved
Achieved endorsed with Merit
Achieved endorsed with Excellence
The requirements for achieving the Standard with Merit or Excellence increase in
expectation of the understanding of the curriculum. An Achievement Standard from Level
2 Religious Studies provides a good example of the greater depth of thinking required:
Achieved – Explain the key beliefs of two religious traditions in relation to a significant
religious question:
• outlining the key beliefs of two religious traditions including their meaning and source
• explaining the similarities and differences between the key beliefs
Merit – Explain in detail the key beliefs within two religious traditions in relation to a
significant religious question involves requirements for Achieved level PLUS:
• explaining the significance of the key beliefs within each religious tradition.
11
See Appendix 3 Table 1
Christian Education Network COL (CENCOL) Achievement Plan P a g e | 10Excellence – Comprehensively explain the key beliefs within two religious
traditions in relation to a significant religious question involves requirements for Merit
level PLUS:
• explaining the wider implications of the key beliefs of the two religious traditions
This would also go to some way to addressing observations made by our Tertiary Partners
(Laidlaw College, Vision College) that for some students the ability to critically reflect and
make links between disparate topics is lacking. While a relatively small number of
students currently have a pathway to these Tertiary Institutions we are hoping this will
increase over time. With a focus on thinking skills as a key strategy to enhance student
achievement across NCEA we will see benefits not only for our Tertiary partners but any
Tertiary Institutions students study in.
Analysing 2016 NCEA data highlights a gap between female and male achievement at
endorsement level12.
Total Endorsements
Females Males
Level 1 84% 58%
Level 2 69% 55%
Level 3 64% 36%
Therefore, targeting male student achievement is an essential part of lifting overall
endorsement rates.
Māori and Pasifika student cohorts will also be targeted to raise achievement levels to
match the whole cohort targets. It needs to be noted that the number of Māori and
Pasifika students is low and this can skew achievement percentages from year to year.
It should be noted that it is a given that the high rates of overall achievement through all
year levels of NCEA that have been obtained through focused initiatives and development
over the last number of years must be maintained while making a shift to the increased
number of students achieving the endorsements that the achievement challenge points
to.
Christian Education Network COL (CENCOL) Achievement Plan P a g e | 11Achievement Challenge To raise NCEA endorsement levels across the curriculum for Year 11-13 (Level 1 -
Level 3) students, with a particular focus on males.
Achievement Targets 201612 201813 2019 2020 2021
Baseline Target
1. To raise the NCEA endorsement levels of Year 11 Total 70% (132/188) 74% (139/188) 77% (145/188) 80% (150/188) 84% (158/188)
(Level 1) students from 70% (132/188) in 2016 to Merit 42% (79/188) 44% (83/188) 45% (85/188) 46% (86/188) 48% (90/188)
84% (158/188) in 2021. This is a shift of 26
Excellence 28% (53/188) 30% (56/188) 32% (60/188) 34% (64/188) 36% (68/188)
students.
2. To raise the endorsement levels of Year 11 male Total 58% (57/98) 64% (63/98) 7114% (70/98) 78% (76/98) 84% (82/98)
(Level 1) students from 58% (57/98) in 2016 to Merit 39% (38/98) 41% (40/98) 44% (43/98) 46% (45/98) 48% (47/98)
84% (82/98) in 2021. This is a shift of 25
Excellence 19% (19/98) 23% (23/98) 28% (27/98) 32% (31/98) 36% (35/98)
students.
3. To raise the NCEA endorsement levels of Year 12 Total 62% (139/223) 65% (145/223) 67% (149/223) 73% (163/223) 79% (176/223)
(Level 2) students from 62% (139/223) in 2016 to Merit 36% (80/223) 37% (83/223) 38% (85/223) 41% (92/223) 44% (98/223)
79% (176/223) in 2021. This is a shift of 37
Excellence 26% (59/223) 28% (62/223) 29% (64/223) 32% (71/223) 35% (78/223)
students.
4. To raise the endorsement levels of Year 12 male Total 55% (56/102) 59% (60/102) 66% (67/102) 73% (74/102) 78% (80/102)
(Level 2) students from 55% (56/102) in 2016 to Merit 39% (40/102) 39% (40/102) 41% (42/102) 43% (44/102) 44% (45/102)
78% (80/102) in 2021. This is a shift of 24
Excellence 16% (16/102) 20% (20/102) 25% (25/102) 29% (30/102) 34% (35/102)
students.
5. To raise the NCEA endorsement levels of Year 13 Total 52% (93/180) 53% (96/180) 56% (100/180) 63% (113/180) 67% (121/180)
(Level 3) students from 52% (93/180) in 2016 to Merit 34% (62/180) 36% (64/180) 37% (66/180) 40% (72/180) 42% (76/180)
67% (121/180) in 2021. This is a shift of 28
Excellence 17% (31/180) 18% (32/180) 19% (34/180) 23% (41/180) 25% (45/180)
students.
6. To raise the endorsement levels of Year 13 male Total 36% (28/78) 41% (32/78) 46% (36/78) 56% (44/78) 67% (52/78)
(Level 3) students from 36% (28/78) in 2016 to Merit 24% (19/78) 27% (21/78) 29% (23/78) 36% (28/78) 42% (33/78)
67% (52/78) in 2021. This is a shift of 24
Excellence 12% (9/78) 14% (11/78) 17% (13/78) 21% (16/78) 24% (19/78)
students.
12
See Appendix 3 Table 1
13
Note all numbers are calculated on 2016 rolls – these will vary from year to year.
14
Due to rounding, percentages may not total exactly 100%
Christian Education Network COL (CENCOL) Achievement Plan P a g e | 12Potential Actions
Knowing that pedagogical change takes time for staff to embed and effect change in learning
outcomes we have decided to focus on Level 1 in the first year of the achievement plan,
progressing to Levels 1 & 2 in the second year, and finally to all NCEA Levels in the third year
of the plan. This allows staff to focus on pedagogy and curriculum across one level at a time.
It also means that students in Level 1 will take those new learning strategies with them into
Level 2 and subsequently Level 3.
Our approach could be described as ‘slow burn big bonfire’!
Some of the ‘high level’ strategies to achieve this challenge could include:
Higher order thinking frameworks e.g. surface to deep thinking using SOLO as a
taxonomy
Pedagogical instruction around several ‘high effect size’ strategies that have
particular relevance for Senior College students for example, Conceptual Change
programmes (higher order thinking) and Collective Teacher Efficacy are two areas
where teacher can improve learning
Reducing ‘within school variation’ – primarily focussed within a single unit school,
but can be judiciously applied to ‘within COL variation’. (David Reynolds research:
data, pupil voice, quality of teaching/learning, building professional capacity).
More specific strategies will be identified in consultation with schools, across school teachers
and within school teachers.
Christian Education Network COL (CENCOL) Achievement Plan P a g e | 13ACHIEVEMENT CHALLENGE 3
English Language Learners
Background
The schools within Christian Education Network Community of Learning (Te Ropu
Whakapono o Waitaha) have experienced significant growth in the numbers of English
Language Learner (ELL) students. Such growth adds to the fabric of each school and the
Community of Learning which adds a complexity to the overall achievement outcomes for
the COL. Notwithstanding each ELL student is an individual with their own goals and
aspirations that are of value in and of themselves, each learner also has an impact on the
overall achievement rates of the school and COL.
ELL students who are hindered from making fast (or comparative) progress towards academic
English mastery are limited in their ability to engage with and make progress in the
opportunities a wide curriculum offers. Many of these students speak their mother tongue at
home and often in community settings where they gather with families of the same cultural
background. For many, school is the one consistent place that they encounter spoken and
taught English.
The spread of languages is wide, with no dominant group. The more prominent languages
spoken as a mother tongue are: Mandarin Chinese, Tagalog, Japanese and Afrikaans.
Historic data also highlights ELL student learning as a priority for the COL. e.g. when looking
at trends from ELL MOE funding data for the COL up to and including 2016, it is evident that
32% (84/261) ELL students ceased MOE funding due to reaching the maximum number of
terms, in comparison to 68% (177/261) exceeding the benchmark15. This highlights that a
number of ELL students across the COL may not have made expected progress in their
acquisition of English language across each of the literacy domains (reading, writing, speaking
and listening) within their MOE funding period.
Programmes to support ELL students vary in depth and quality across the COL. The
opportunity to align practice and accelerate learning for ELL students can impact on each
individual’s progress through the years of learning and on their learning pathway through the
COL.
The Achievement Challenge reflects both a process/strategy focus and achievement targets
which are working hand in hand.
Culturally responsive practice
English Language Learners can be New Zealand Māori, children from the Pacific region, New
Zealand born children of migrant families or children of newly arrived migrant families.
A focus on the growing number of ELL students will foster the development of cultural
inclusiveness in classrooms across the COL. This increasing understanding of the
15
Appendix 4 Table 1
Christian Education Network COL (CENCOL) Achievement Plan P a g e | 14cultural learning needs of such students will benefit all students. By developing effective practice around second language acquisition we will enhance access to the curriculum for a large group of learners. The voice of data In reviewing the data on ELL student achievement, it becomes apparent that the accuracy of the use of English Language Learning Progressions (ELLP) assessment varies markedly between schools across the COL. The data shows that some junior children are likely scored incorrectly against the ELLP learning pathway. Some children appear to score higher than is possible for their year level band. This highlights a likely misunderstanding across schools in the use of the assessment tool. The data also shows a disparity between the number of students being identified within schools across the COL. The Christchurch demographic is shifting significantly towards a higher number of migrant families. Anecdotally (qualitatively), it would appear some ELL students are unidentified. This has led to some question of the validity of ELL data presented within the achievement challenge. Observations suggest schools identify obvious needs in students with limited English but miss the needs of students who, on the surface appear to have a suitable grasp of spoken English language. These students can lack the structure and academic English to perform to a suitable level in the New Zealand curriculum. This has the potential to impact on their progress through and achievement in the curriculum and therefore on their goals and aspirations. Early identification allows early support and monitoring, which begins to address the language barrier for these students. Because of the disparity in data, the COL believes it is not getting accurate data on ELL student progression across the COL and this has provided the rationale for a COL focus and the strategy goal to ensure all students who are eligible for ELL support are identified and funding is applied for. We predict the number of identified ELL students will increase on current trends and on improved identification practices. Cohort focus Currently there are 166 students who are identified as ELL across the COL. Of these, there are 107 students in Years 1-3, 39 in Years 4-8 and 20 in Years 9-13. The focus on Year 1 to 3 ELL students is deliberately intended to introduce a compounding effect over the three years of the target. As each ELL student starts at a different time and with varying mastery of English, the measuring of the target becomes fluid with pupils starting and completing their allocated MOE funding period at varying times. Therefore, for the sake of a baseline cohort the COL determined to measure MOE funded Year 1 to 3 students identified as Foundation Stage (total ELLP score of equal or less than 3), Stage 1 (total ELLP score of 4-7) or Stage 2 (total ELLP score of 8) using March 2017 funding figures. The ELL students in Years 4 to 8 are all at differing stages, which makes the setting of a robust target for them problematic. However, this group is expected to benefit from the focus on culturally responsive teaching practice, including second language learning through the implementation of the strategy. Thus, while the numbers of ELL students appear to be low in the initial baseline cohort, the focus on teacher practice is expected to impact significant numbers of students both in the Year 1 to 3 levels but also into all year levels in the primary areas of the COL. The focus at Year 1 also has the opportunity of involving the Early Learning Centres as they too work with an increasing number of ELL students. Christian Education Network COL (CENCOL) Achievement Plan P a g e | 15
Achievement Challenge                                 To ensure all MOE funded Year 1-3 students at foundation stage in 2017 are at
                                                               stage 2 ELLP by 2020 (cohort standard).
         Achievement Targets                                                         March 201716        2018            2019           2020
                                                                     Stage
                                                                                      Baseline         November        November       November
         1.     To lift the achievement of Year 1 ELL          At foundation       95% (36/38)      50% (19/38)     13% (5/38)     0% (0/38)
                students from 0% (0/38) in 2017 to 89%
                (34/38) having achieved Stage 2 (total ELLP    Achieved stage 1    5% (2/38)        50% (19/38)     74% (28/38)    11% (4/38)
                score of 8) by 2020. This equates to a shift
                of 34 students by 2020.                        Achieved stage 2    0% (0/38)        0% (0/38)       13% (5/38)     89% (34/38)
         2.     To lift the achievement of Year 2 ELL          At foundation       69% (24/35)      34%17 (12/35)   14% (5/35)     0% (0/35)
                students from 0% (0/35) in 2017 to 100%
                (35/35) at having achieved Stage 2 (total      Achieved stage 1    31% (11/35)      54% (19/35)     31% (11/35)    0% (0/35)
                ELLP score of 8) by 2020. This equates to a
                shift of 35 students by 2020                   Achieved stage 2    0% (0/35)        11% (4/35)      54% (19/35)    100% (35/35)
         3.     To lift the achievement of Year 3 ELL          At foundation       18% (6/34)       9% (3/34)       0% (0/34)
                students from 9% (3/34) in 2017 to 100%
                (34/34) having achieved reach Stage 2          Achieved stage 1    74% (25/34)      53% (18/34)     0% (0/34)
                (total ELLP score of 8) by 2019. This
                equates to a shift of 31 students by 2019.     Achieved stage 2    9% (3/34)        38% (13/34)     100% (34/34)

16
     See Appendix 4 Table 2
17
     Due to rounding percentages may not total exactly 100%

Christian Education Network COL (CENCOL)                                     Achievement Plan                                                   P a g e | 16
Potential Actions
Strategy Goal: 2018: Ensure all students who are eligible for ELL support are identified and
funding applied for.
Within the Christian Education Network Community of Learning (Te Ropu Whakapono o
Waitaha) there is a developed set of expertise for addressing the needs of English Language
Learners. However, this is not yet being shared across the schools to the benefit of all ELL
students.
The structure of the COL will facilitate the use of the existing knowledge and professional
relationships and multiply this across all schools. To achieve this collaboration, it is thought a
teacher with experience in adult education and a deep understanding of the system of
support needed for ELL students will be appointed to assist schools.
Other potential actions include:
Carry out a review of current identification strategies within each school
Develop teacher knowledge and skill on best practice for identification/assessment of
ELL students
Develop a shared understanding and synergy amongst teachers of best practice in the
teaching and learning for ELL students
Collaborate with teachers in their own schools/across schools to enhance and
transform classroom practice with cultural inclusiveness as a focus. This will also
benefit our Māori and Pasifika students
Raise achievement of ELL students to at least that of same age cohorts in line with the
approved targets.
Christian Education Network COL (CENCOL) Achievement Plan P a g e | 17Appendix 1: Christian Education Network Community of Learning – Organisational Structure Christian Education Network COL (CENCOL) Achievement Plan P a g e | 18
APPENDIX 2 – Writing Data

Table 1 : Overview 2016 CENCOL National Standards – Achievement in Writing18

                                                     CENCOL (Collated) National
                                                       Standards Writing 2016
                                                                 At and Above
                       Grouping                     Total #      #           %
                       All Students                    1475       1113      75.5%
                       Female                            731       615      84.1%
                       Male                              744       498      66.9%
                       Maori                             144        99      68.8%
                       Pasifika                           90        67      74.4%
                       Asian                             241       179      74.3%
                       Other                             104        87      83.7%
                       European/Pakeha                   896       681      76.0%

Table 2 : CENCOL Writing 2016: Year 7 – 10 (Year 7/8 NS19, Year 9/10 other) [Table Redacted]

Table 3: Breakdown of individual school point shifts for writing challenge

                                             Writing – Year 7-10
                          Total              Baseline                  Target               Shift Required
                        students     Number        Percent     Number       Percent      Number       % point
 Aidanfield                62           30          48%           45            73%         15          25%
 Chch Adventist            80           27          34%           58            73%         31          39%
 Emmanuel                  59           38          64%           43            73%          5           9%
 Hillview                  200         106          53%          146            73%         40          20%
 Middleton                 453         295          65%          331            73%         36           8%
 Rolleston Christian        8            6          75%            7            88%          1          13%
 Total                     862         502          58%          630            73%        128          15%

18
  Sourced from 2016 NS data reporting to MOE
19
  Internal data extracted from SMS’s retrospectively, resulting in some inconsistencies with Years 7 & 8 NS data
reported to MOE as per previous table (App 2 Tab 1). This represents a best estimate of breakdown of 2016
data by gender and year with data available at this time.

Christian Education Network COL (CENCOL) Achievement Plan                                          P a g e | 19
Writing – Boys Year 7-10
Total Baseline Target Shift Required
students Number Percent Number Percent Number % point
Aidanfield 33 13 39% 20 62% 7 23%
Chch Adventist 34 9 26% 21 62% 12 36%
Emmanuel 28 13 46% 17 62% 4 16%
Hillview 93 39 42% 58 62% 19 20%
Middleton 223 119 53% 138 62% 19 9%
Rolleston Christian 5 3 60% 4 70% 1 10%
Total 416 196 47% 258 62% 62 15%
Note: due to rounding, totals may be slightly different to the sum of the parts.
Appendix 3: NCEA Data
Table 1: CENCOL Schools - NCEA Achievement 2016 [Table Redacted]
Table 2: Breakdown of individual school point shifts for NCEA challenge
NCEA Level 1 endorsements
Total Baseline Target Shift Required
students Number Percent Number Percent Number % point
Chch Adventist 17 10 59% 14 84% 4 25%
Middleton 171 122 71% 144 84% 22 13%
Total 188 132 70% 158 84% 26 14%
NCEA Level 1 endorsements - Male
Total Baseline Target Shift Required
students Number Percent Number Percent Number % point
Chch Adventist 12 7 58% 10 84% 3 26%
Middleton 86 50 58% 72 84% 22 26%
Total 98 57 58% 82 84% 25 26%
NCEA Level 2 endorsements
Total Baseline Target Shift Required
students Number Percent Number Percent Number % point
Chch Adventist 23 9 39% 18 79% 9 40%
Middleton 200 130 65% 158 79% 28 14%
Total 223 139 62% 176 79% 37 17%
Christian Education Network COL (CENCOL) Achievement Plan P a g e | 20NCEA Level 2 endorsements - Male
Total Baseline Target Shift Required
students Number Percent Number Percent Number % point
Chch Adventist 9 3 33% 7 78% 4 45%
Middleton 93 53 57% 73 78% 20 21%
Total 102 56 55% 80 78% 24 23%
NCEA Level 3 endorsements
Total Baseline Target Shift Required
students Number Percent Number Percent Number % point
Chch Adventist 9 4 44% 6 67% 2 23%
Middleton 171 89 52% 115 67% 26 15%
Total 180 93 52% 121 67% 28 15%
NCEA Level 3 endorsements - Male
Total Baseline Target Shift Required
students Number Percent Number Percent Number % point
Chch Adventist 4 X X X X X X
Middleton 74 X X X X X X
Total 78 28 36% 52 67% 24 31%
Note: due to rounding, totals may be slightly different to the sum of the parts.
Appendix 4: ELL Data
Table 1: Cumulative MOE ELL funding data – cessation of funding
COL ACS CAS ECS HCS MGS
# % # % # % # % # % # %
Exceeded Benchmark 177 68% 14 50% 79 64% 21 78% 9 60% 54 79%
Completed Max Terms 84 32% 14 50% 44 36% 6 22% 6 40% 14 21%
Total 261 28 123 27 15 68
Table 2: CENCOL ELL Progressions Scores Years 1-3 2016 [Table Redacted]
Christian Education Network COL (CENCOL) Achievement Plan P a g e | 21Table 3: Breakdown of individual school point shifts for ELL challenge
ELL Year 1
Total Baseline20 Target Shift Required
students Number Percent Number Percent Number % point
Aidanfield 18 0 0% 16 89% 16 89%
Chch Adventist 3 X X X X X X
Emmanuel 0 X X X X X X
Hillview 2 X X X X X X
Middleton 10 0 0% 9 90% 9 90%
Rolleston Christian 5 0 0% 4 80% 4 80%
Total 38 0 0% 34 89% 34 89%
Note x= data has been redacted
ELL Year 2
Total Baseline20 Target Shift Required
students Number Percent Number Percent Number % point
Aidanfield 12 0 0% 12 100% 12 100%
Chch Adventist 5 X X X X X X
Emmanuel 0 X X X X X X
Hillview 2 X X X X X X
Middleton 10 0 0% 10 100% 10 100%
Rolleston Christian 6 0 0% 6 100% 6 100%
Total 35 0 0% 35 100% 35 100%
Note x= data has been redacted
ELL Year 3
Total Baseline20 Target Shift Required
students Number Percent Number Percent Number % point
Aidanfield 8 0 0% 8 100% 8 100%
Chch Adventist 6 3 50% 6 100% 3 50%
Emmanuel 6 0 0% 6 100% 6 100%
Hillview 2 X X X X X X
Middleton 10 0 0% 10 100% 10 100%
Rolleston Christian 2 X X X X X X
Total 34 3 9% 34 100% 31 91%
Note x= data has been redacted
20
At Stage 2
Christian Education Network COL (CENCOL) Achievement Plan P a g e | 22You can also read