Fl crida - Understanding Florida Standards Assessments Reports 2020 - Florida Department of ...
←
→
Page content transcription
If your browser does not render page correctly, please read the page content below
Fl crida
Standards Assessments

                    Understanding
   Florida Standards Assessments
                          Reports

                                              2020

            Florida Department of Education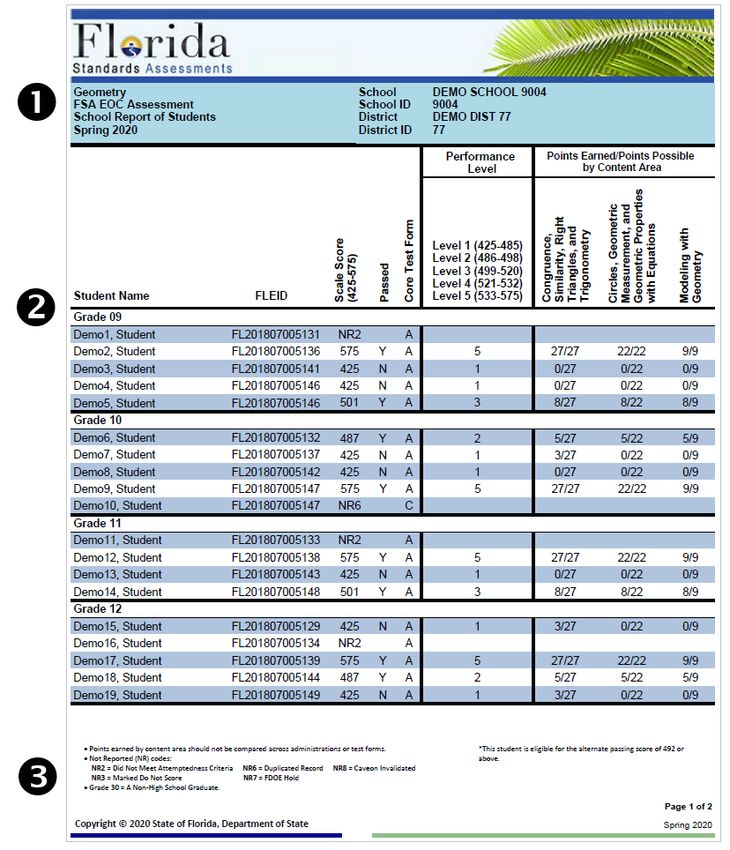
Table of Contents
Introduction.................................................................................................................................................... 2
   Purpose of the FSA .............................................................................................................................................................. 2
   Subjects/Grade Levels Tested in 2020 ................................................................................................................................ 2
   Testing Format .................................................................................................................................................................... 2
   Question Formats................................................................................................................................................................ 3
Florida Standards Assessments Scores ............................................................................................................ 3
   FSA ELA, Mathematics, and EOC Scale Scores and Performance Levels............................................................................. 3
     Passing Scores and Alternate Passing Scores ................................................................................................................. 4
     Reporting Category Performance Details ....................................................................................................................... 4
     Codes for No Data Reported ........................................................................................................................................... 5
FSA Student, School, District, and State Reports ............................................................................................. 6
   FSA ELA, Mathematics, and EOC Individual Score Reports ................................................................................................. 7
     What’s New ..................................................................................................................................................................... 7
     ELA and Mathematics Individual Score Reports ............................................................................................................. 8
     EOC Individual Score Reports........................................................................................................................................ 12
     On-Demand Student Reports........................................................................................................................................ 15
   FSA ELA, Mathematics, and EOC School Report of Students ............................................................................................ 16
     FSA ELA and Mathematics ............................................................................................................................................ 16
     FSA Algebra 1, Algebra 1 Retake, and Geometry EOC .................................................................................................. 17
   FSA ELA, Mathematics, and EOC District and State Reports of Results ............................................................................ 18
   FSA Reporting Categories .................................................................................................................................................. 23
     FSA ELA Reporting Categories ....................................................................................................................................... 23
     FSA Mathematics Reporting Categories ....................................................................................................................... 26
     FSA EOC Reporting Categories ...................................................................................................................................... 29
Glossary ........................................................................................................................................................ 30

                                                                                          1

 Understanding FSA Reports 2020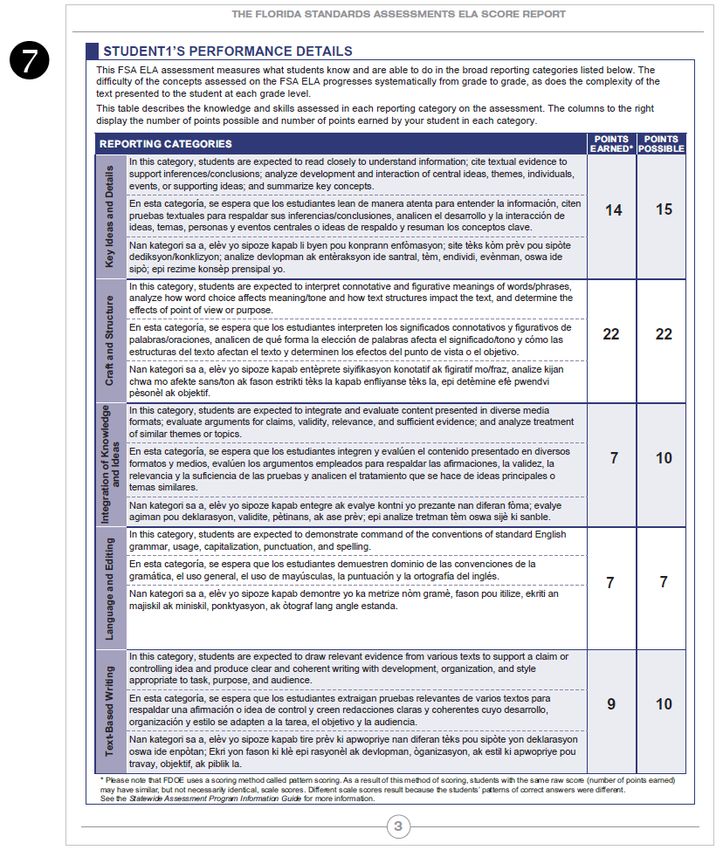
Understanding FSA Reports
Introduction
This document has been prepared to help you understand the score reports for the Florida Standards Assessments
(FSA). It includes explanations of the reports, information about the content assessed in English Language Arts (ELA) and
Mathematics relating to the Florida Standards, and a glossary of the terms used in the reports. The explanations
provided for the sample reports apply to all grade levels unless otherwise noted. For information about student reports
for the Next Generation Sunshine State Standards (NGSSS) Science and Social Studies assessments, please refer to
Understanding NGSSS Reports.

Districts will receive paper copies of individual score reports for distribution to parents/students. All additional reports,
including school-, district-, and state-level reports, can be found in the secure FSA Reporting System. The results posted
in the FSA Reporting System are restricted because they contain confidential student information. Only authorized
district and school personnel can log in to the FSA Reporting System. Please see the FSA Reporting System User Guide for
more information.

Note: Terms that are defined in the glossary appear in bold text the first time they are used in a section.

Purpose of the FSA
All Florida schools teach the Florida Standards in ELA and Mathematics. Student performance on the FSA provides
important information to parents/guardians, teachers, policy makers, and the general public regarding how well
students are learning the Florida Standards.

Subjects/Grade Levels Tested in 2020
      •   Grades 3–10 ELA
                  ELA Reading in grades 3–10; ELA Writing in grades 4–10
      •   Grades 3–8 Mathematics
      •   Algebra 1
      •   Geometry
      •   Retakes: Grade 10 ELA and Algebra 1

Most students, including English language learner (ELL) and exceptional student education (ESE) students, enrolled in
the tested grade levels or courses participate in FSA administrations. Allowable accommodations are provided to ELL
and ESE students who have accommodations documented on their Individual Education Plans (IEPs) or Section 504
Plans.

Testing Format
Grades 3–6 FSA assessments are paper-based tests (PBT) and grades 7–10 and end-of-course (EOC) FSA assessments are
computer-based tests (CBT). In addition, paper-based accommodated test forms are provided for students who have a
paper-based accommodation listed on their IEP or Section 504 Plan. Accommodated paper-based forms include large
print, braille, and one-item-per-page for both paper-based and computer-based tests and regular print for computer-
based tests. Computer-based accommodations, such as answer masking, text-to-speech, and, for ELA only, closed

                                                             2

 Understanding FSA Reports 2020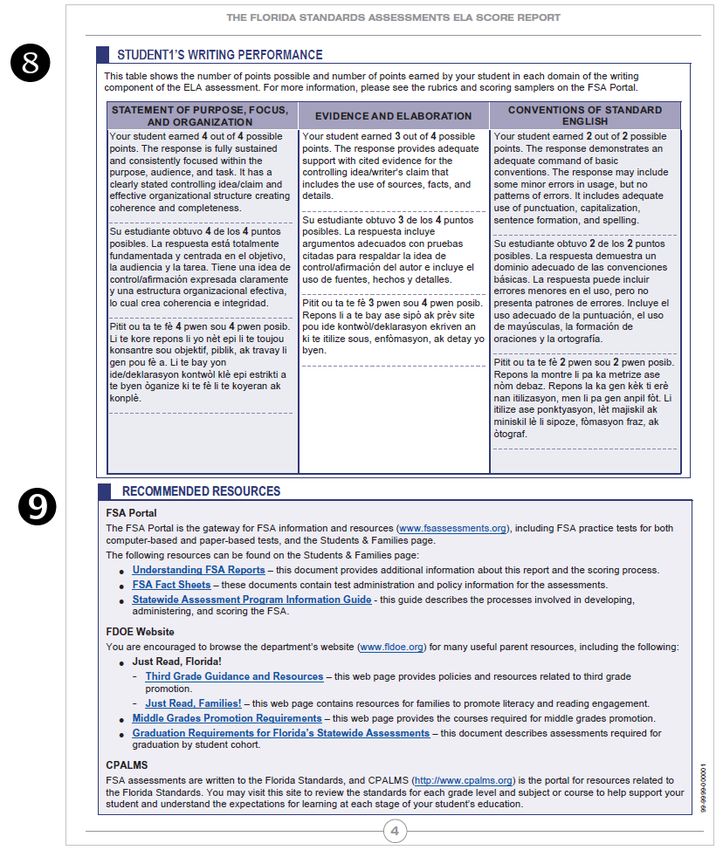
captioning and American Sign Language (ASL) videos, are available in the computer-based platform. ELA Writing and ELA
Reading passage booklets are also available for eligible students.

Question Formats
Students respond to items in multiple ways. The various item types are designed to assess higher-order thinking skills
and offer diverse ways for students to demonstrate what they know and can do. Detailed descriptions of the question
formats and item types are available in the item specifications posted to the FSA Portal.

Florida Standards Assessments Scores
FSA results are reported at the student, school, district, and state levels. Table 3 provides a list of FSA reports, the
format in which the report is delivered, the grade levels for which each report is provided, and the page of this
document on which each type of report is described.

FSA ELA, Mathematics, and EOC Scale Scores and Performance Levels
After the Spring 2015 baseline FSA administration, the Florida Department of Education (FDOE) conducted the standard
setting process to establish the cut scores for the performance levels, also called achievement levels, for each grade
and subject. The Florida State Board of Education adopted achievement level cut scores in January 2016 in State Board
of Education Rule 6A-1.09422, Florida Administrative Code (FAC). Information regarding standard setting is available on
the FDOE Standard Setting page. Both scale scores and performance levels are reported for FSA ELA, Mathematics, and
EOC assessments. The scales on which students receive scores differ by grade and subject.

The scale score ranges comprise the five different performance levels, which correspond to the performance level
descriptions shown in Table 1. The corresponding scale score ranges for each level are shown in Table 2.

For more detailed information about how the assessments are scored, please see the Statewide Assessment Program
Information Guide.

                                                    Table 1. Performance Levels

                                    Below
                 Inadequate:        Satisfactory:         Satisfactory:     Proficient:          Mastery:

                 Highly likely to   Likely to need        May need          Likely to excel in   Highly likely to
                 need               substantial           additional        the next             excel in the
                 substantial        support for the       support for the   grade/course         next
                 support for the    next grade/course     next                                   grade/course
                 next                                     grade/course
                 grade/course

                                                                 3

 Understanding FSA Reports 2020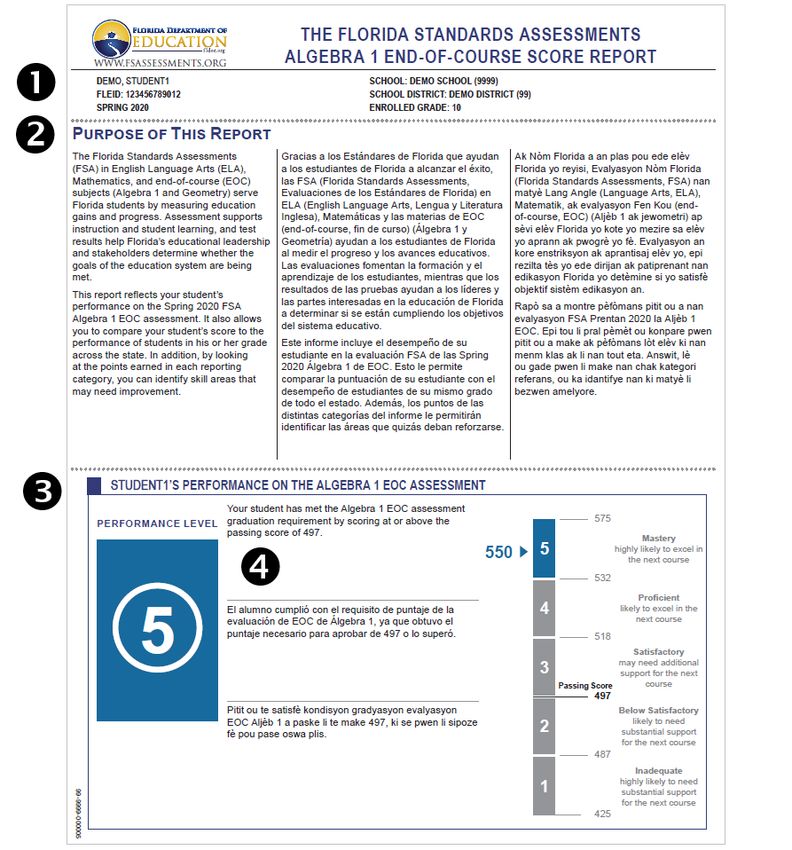
Table 2. Florida Standards Assessments Scale Scores for Each Performance Level

         Assessment             Level 1           Level 2           Level 3            Level 4           Level 5
    Grade 3 ELA                 240-284           285-299           300-314           315-329           330-360

    Grade 4 ELA                 251-296           297-310           311-324           325-339           340-372

    Grade 5 ELA                 257-303           304-320           321-335           336-351           352-385

    Grade 6 ELA                 259-308           309-325           326-338           339-355           356-391

    Grade 7 ELA                 267-317           318-332           333-345           346-359           360-397

    Grade 8 ELA                 274-321           322-336           337-351           352-365           366-403

    Grade 9 ELA                 276-327           328-342           343-354           355-369           370-407

    Grade 10 ELA                284-333           334-349           350-361           362-377           378-412

     Grade 3 Mathematics        240-284           285-296           297-310           311-326           327-360

     Grade 4 Mathematics        251-298           299-309           310-324           325-339           340-376

     Grade 5 Mathematics        256-305           306-319           320-333           334-349           350-388

     Grade 6 Mathematics        260-309           310-324           325-338           339-355           356-390

     Grade 7 Mathematics        269-315           316-329           330-345           346-359           360-391

     Grade 8 Mathematics        273-321           322-336           337-352           353-364           365-393

    Algebra 1 EOC               425-486           487-496           497-517           518-531           532-575
    Geometry EOC                425-485           486-498           499-520           521-532           533-575

Passing Scores and Alternate Passing Scores
For all grade levels and subjects, the minimum scale score in performance level 3 is identified as the passing score.
Earning passing scores on the Grade 10 ELA and Algebra 1 EOC assessments is required for graduation with a standard
high school diploma. A passing score on the Geometry EOC assessment is required for students to qualify for the Scholar
Designation but is not a graduation requirement.

Students who took the Grade 10 FSA ELA, Algebra 1 EOC, or Geometry EOC assessment in the Spring 2015 FSA baseline
administration are eligible to use an alternate passing score for these assessments. The alternate passing scores are
linked to the passing scores on the previous statewide assessments, the NGSSS assessments. In addition, students may
earn a comparative or concordant score to meet an assessment graduation requirement. Passing scores, alternate
passing scores, concordant, and comparative score options and policies are explained in Graduation Requirements for
Florida’s Statewide Assessments.

Reporting Category Performance Details
Each reporting category represents groups of similar skills, or benchmarks, that are assessed within each grade and
subject. Reporting category performance is conveyed by displaying the points earned and the points possible for each
category.

                                                            4

 Understanding FSA Reports 2020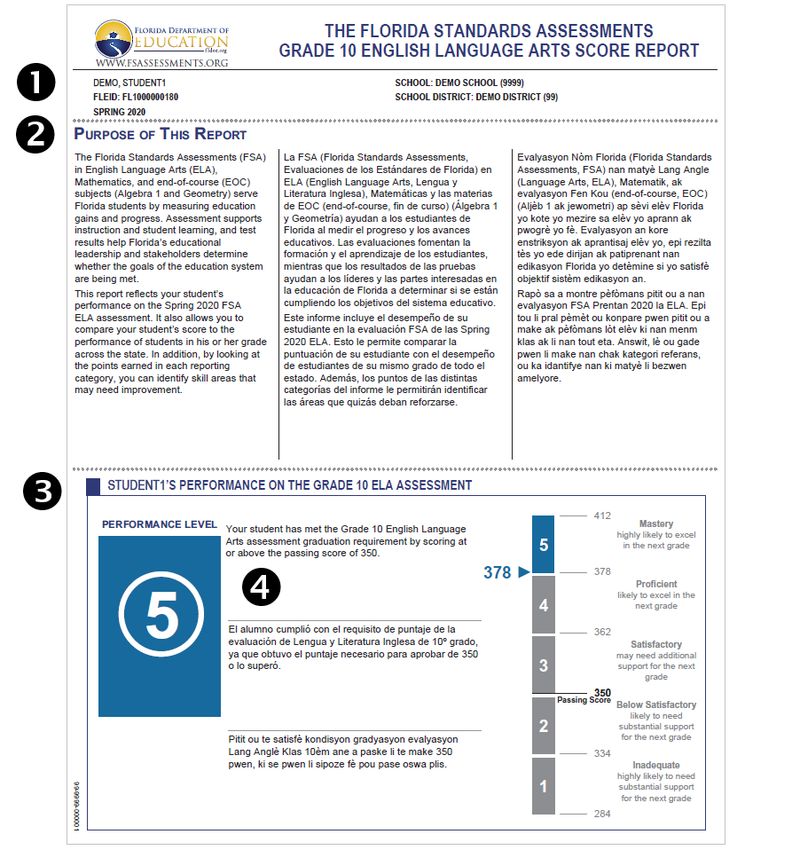
Codes for No Data Reported
The following abbreviations may appear on some student-level reports to indicate that no data are reported. The codes
below describe the reasons that a field may be left blank on Grade 3 ELA Reading, Grades 3–8 Mathematics, or EOC
educator reports.

    •   NR (Not Reported) indicates that no data are reported for one of the following reasons:
            NR2—Did Not Meet Attemptedness Criteria
            NR3—Marked Do Not Score
            NR5—Below-Grade Tester
            NR6—Duplicated Record
            NR7—FDOE Hold
            NR8—Caveon Invalidated

In the FSA Reporting System, the codes above will appear in the scale score column of the School Report of Students for
Mathematics, Algebra 1/Retake EOC, and Geometry EOC. Since the ELA reporting code is determined by both the ELA
Reading and ELA Writing score flags, the reporting codes on grades 4–10/Retake ELA reports do not list a flag number as
they do for Mathematics and EOC assessments. The score flag information for ELA Reading and ELA Writing will be
available in the District Student Results files as well as in the Excel version of the School Report of Students in the FSA
Reporting System. Two separate columns will display the ELA Reading score flags and the ELA Writing score flags for
grades 4–10 so that schools and districts can better understand why the student’s score was not reported. Only the ELA
Reading score flag column will be populated on the Grade 3 ELA School Report of Students, since the grade 3 ELA test
consists of a Reading component only.

A dash (─) on the school-, district-, or state-level reports appears when data are suppressed. To provide meaningful
results and to protect the privacy of individual students, no data are reported if the number of students is fewer than
ten. If all students would be reported in the same performance level, the data are suppressed, with the exception that
the percentage passing and/or the totaled percentage of Performance Levels 3–5 are reported on summary educator
reports.

In addition to NR codes, the following writing condition codes for Grades 4–10/Retake will be available in the FSA ELA
District Student Results files, the Excel version of the School Report of Students, and the Individual Score Reports. These
codes indicate why a student’s writing response cannot be scored.

    •   A—Blank*
    •   B—Insufficient
    •   C—Off-Topic**
    •   D—Foreign Language
    •   F—Illegible/Incomprehensible
    •   G—Copied Text

    *Individual Score Reports for ELA tests are not provided for students whose ELA Writing received the condition code A (Blank).
    ** Responses with condition code C (off-topic) may receive up to two score points for Conventions of Standard English.

                                                                 5

 Understanding FSA Reports 2020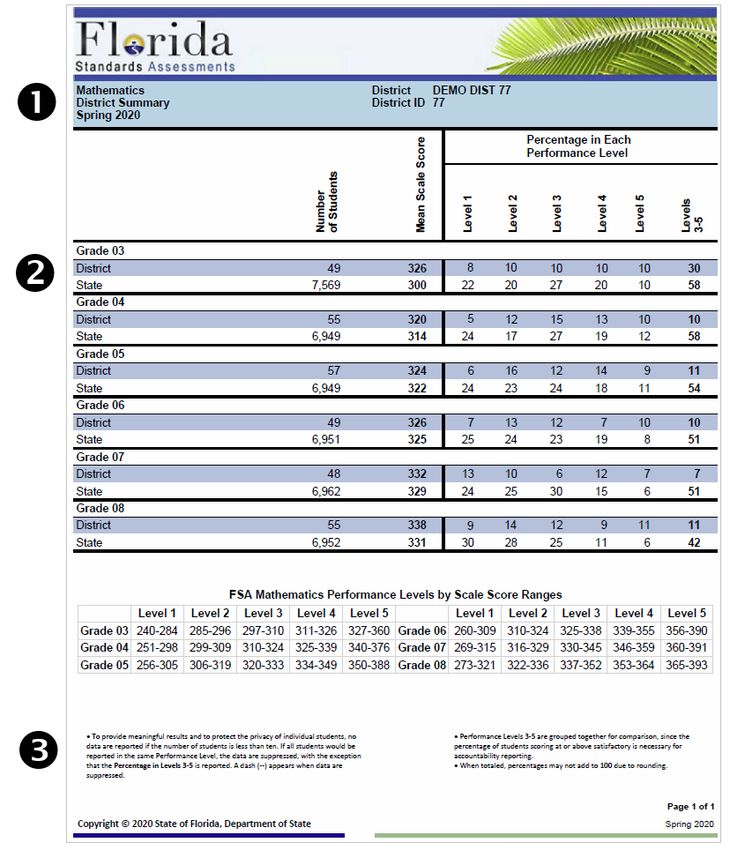
FSA Student, School, District, and State Reports
                                              Table 3: FSA Reports, Format of Delivery, and Grades

                                                                         Format of                                    Page of
                                    FSA Report Type                                         Grade/Subject              Report
                                                                          Delivery
                                                                                                                     Description
                                ELA Individual Score Report               Paper              3–10/Retake                 8
                            Mathematics Individual Score Report           Paper                  3–8                     8
   Student
   Reports

                           Algebra 1 EOC Individual Score Report          Paper            Algebra 1/Retake              12
                           Geometry EOC Individual Score Report           Paper               Geometry                   12
                                On-Demand Student Reports                 Online        All grades and subjects          15
                               ELA School Report of Students              Online             3–10/Retake                 16
   Reports
   School

                          Mathematics School Report of Students           Online                 3–8                     16
                               EOC School Report of Students              Online     Algebra 1/Retake and Geometry       17
                               ELA District Report of Schools             Online                 3–10                    18
                            ELA Retake District Report of Schools         Online              ELA Retake                 18
                           Mathematics District Report of Schools         Online                 3–8                     18
                          Algebra 1 EOC District Report of Schools        Online               Algebra                   18
                       Algebra 1 Retake EOC District Report of Schools    Online           Algebra 1 Retake              18
    District Reports

                          Geometry EOC District Report of Schools         Online              Geometry                   18
                                   ELA District Summary                   Online                 3–10                    20
                                ELA Retake District Summary               Online              ELA Retake                 20
                               Mathematics District Summary               Online                 3–8                     20
                              Algebra 1 EOC District Summary              Online              Algebra 1                  20
                           Algebra 1 Retake EOC District Summary          Online           Algebra 1 Retake              20
                              Geometry EOC District Summary               Online              Geometry                   20
                                ELA State Report of Districts             Online                 3–10                    21
                            ELA Retake State Report of Districts          Online              ELA Retake                 21
                           Mathematics State Report of Districts          Online                 3–8                     21
                           Algebra 1 EOC State Report of Districts        Online              Algebra 1                  21
                       Algebra 1 Retake EOC State Report of Districts     Online           Algebra 1 Retake              21
    State Reports

                           Geometry EOC State Report of Districts         Online              Geometry                   21
                                    ELA State Summary                     Online                 3–10                    22
                                 ELA Retake State Summary                 Online              ELA Retake                 22
                                Mathematics State Summary                 Online                 3–8                     22
                               Algebra 1 EOC State Summary                Online              Algebra 1                  22
                           Algebra 1 Retake EOC State Summary             Online           Algebra 1 Retake              22
                               Geometry EOC State Summary                 Online              Geometry                   22

                                                                          6

Understanding FSA Reports 2020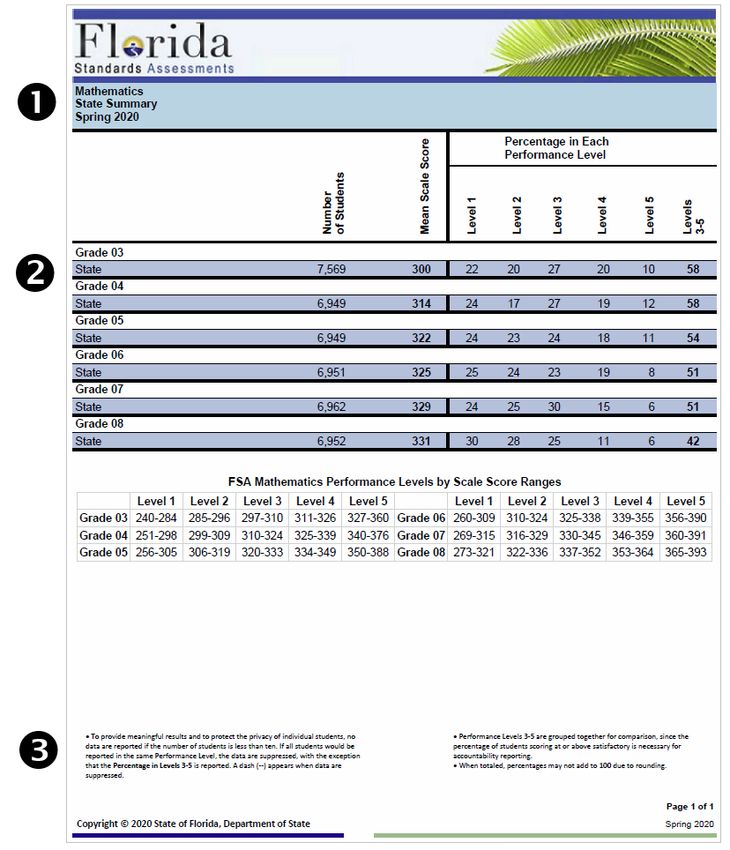
FSA ELA, Mathematics, and EOC Individual Score Reports
Readers should have their FSA ELA Individual Score Report, FSA Mathematics Individual Score Report, or FSA EOC
Individual Score Report (Algebra 1/Retake or Geometry) when reviewing and interpreting information provided in this
section. Below you will find explanations of elements on the score reports.

Note: Not all elements are present on each score report.

What’s New
For the Spring 2020 administration, new On-Demand Student Reports are posted in the FSA Reporting System for
download. These reports are one page and offer basic reporting information, such as a student’s scale score and
performance level. Full student reports continue to be shipped to districts. Please see below for more information.

                                                           7

 Understanding FSA Reports 2020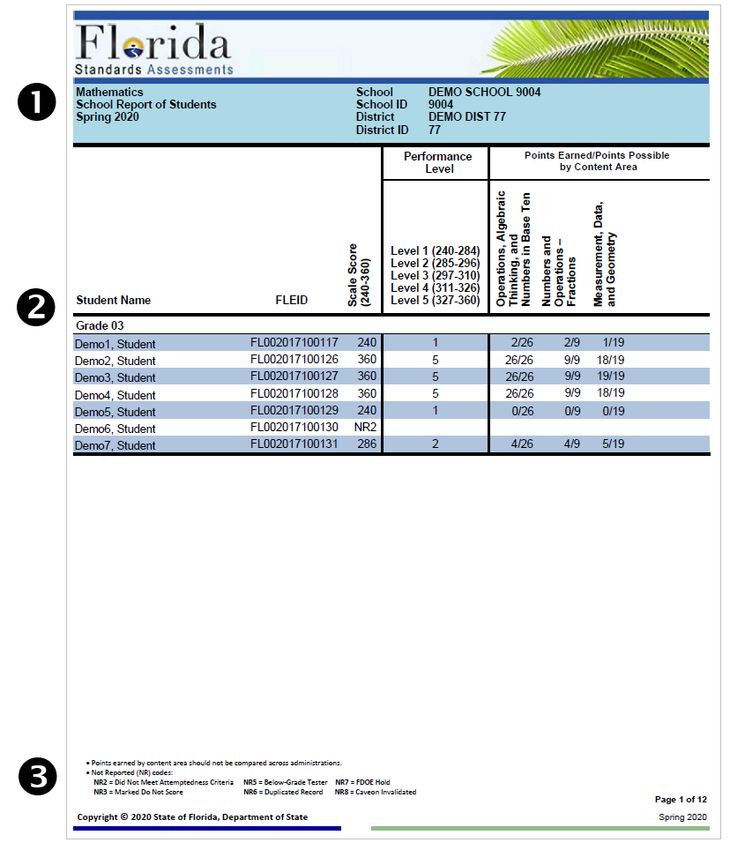
ELA and Mathematics Individual Score Reports
The FSA ELA and Mathematics Individual Score Report are four-page color reports. The report provides general
information about the FSA program and the student’s 2020 FSA results, including the student’s scale score, performance
level, previous performance, and reporting category scores. The report also indicates how the student’s performance
compares to that of other students who took the same test in the same school, district, and the state, and provides a list
of helpful resources. The information on this report is presented in English, Spanish, and Haitian Creole.

                                                 Page 1 of Score Report

                                                                                                Top of Report: The test,
                                                                                                student, Florida Education
                                                                                                Identifier (FLEID),
                                                                                                administration, school, and
                                                                                                district are identified at the
                                                                                                top of the report.

                                                                                                Purpose of This Report: A
                                                                                                description of the FSA
                                                                                                program and the score report.
                                                                                                Each FSA score report is
                                                                                                customized by grade and
                                                                                                subject.

                                                                                                Performance Level & Scale
                                                                                                Score: Performance levels are
                                                                                                indicated by both number and
                                                                                                color for easy interpretation.
                                                                                                An icon displays the student’s
                                                                                                performance level. Next to
                                                                                                the icon, a statement provides
                                                                                                further information regarding
                                                                                                the performance level and
                                                                                                charts the scale score on a
                                                                                                graph.

                                                                                                For the Grade 10/Retake ELA
                                                                                                assessment, achieving a
                                                                                                passing score is a graduation
                                                                                                requirement. Therefore, in
                                                                                                addition to the performance
                                                                                                level indicator provided on
                                                                                                the report, a statement also
                                                                                                appears indicating whether
                                                                                                the student met the
                                                                                                graduation requirement.

                                                                                                For the grades 3 and 4 ELA
                                                                                                assessments, if the student
                                                                                                receives a level 1 or level 2, in
                                                                                                addition to the performance
                                                                                                level indicator provided on
                                                                                                the report, this section will
                                                                                                also include information
                                                                                                about Reading Scholarship
                                                                                                Accounts.

                                                            8

 Understanding FSA Reports 2020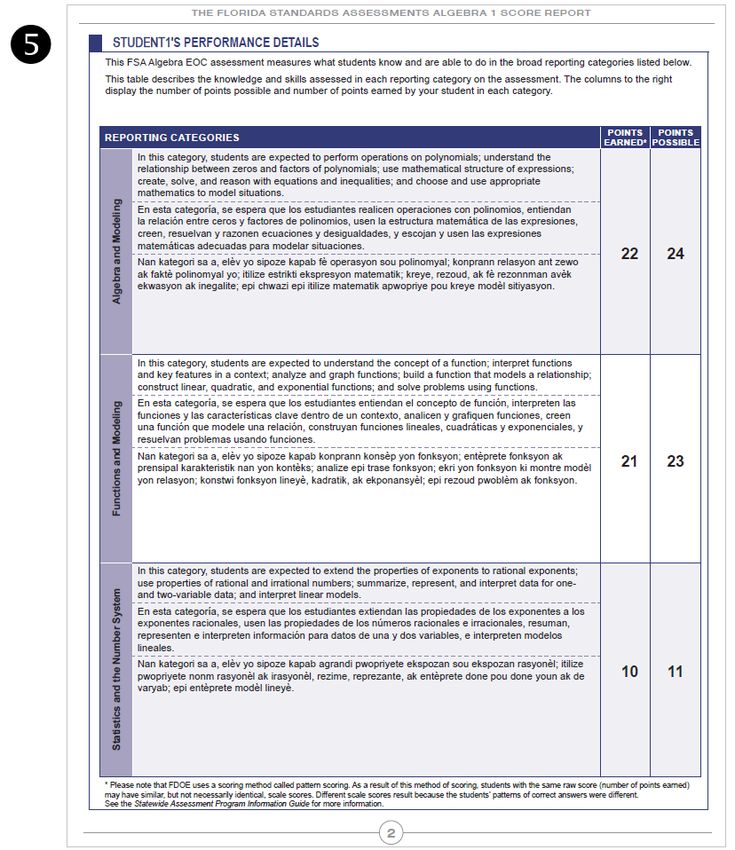
Page 2 of Score Report

                                                          Previous Performance Chart:
                                                          For students who
                                                          participated in a grade 4–10
                                                          ELA assessment and/or a
                                                          grade 4–8 Mathematics
                                                          assessment, this chart
                                                          displays student
                                                          performance levels over
                                                          time. It includes the
                                                          student’s most recent, as
                                                          well as previous,
                                                          performance on the FSA ELA
                                                          or Mathematics assessment
                                                          dating back to spring 2015 (if
                                                          available). The arrows
                                                          indicate generally where the
                                                          student’s score fell within the
                                                          performance level.

                                                          Note: Even if a student
                                                          participated in prior years, if
                                                          the student’s record could
                                                          not be matched to previous
                                                          results, that information will
                                                          not be displayed in this
                                                          section.

                                                          Performance Compared: A
                                                          table lists the percentage of
                                                          students in each
                                                          performance level in the
                                                          student’s school, district, and
                                                          the state. The performance
                                                          level in which the student
                                                          scored is highlighted.

                                           9

Understanding FSA Reports 2020
Page 3 of Score Report
Performance Details: A table
lists the FSA ELA or
Mathematics reporting
categories assessed. The
Points Earned column shows
the actual number of points
earned by the student. The
Points Possible column
provides the total number of
points possible for each of
the reporting categories.
10
Understanding FSA Reports 2020Page 4 of Score Report
Writing Performance: For
grades 4–10/Retake ELA
reports, this chart
indicates the number of
points earned by the
student and the number
of points possible for
each domain of the ELA
Writing assessment.
Recommended
Resources: This section
provides information and
resources for students
and parents/guardians.
11
Understanding FSA Reports 2020EOC Individual Score Reports
The FSA EOC Individual Score Report is a three-page color report. The report provides general information about the FSA
program and the student’s 2020 FSA results, including the student’s scale score, performance level, and reporting
category scores. The report also indicates how the student’s performance compares to that of other students who took
the same test in the same school, district, and the state. The information on this report is presented in English, Spanish,
and Haitian Creole.
Page 1 of Score Report
Top of Report: The test,
student, FLEID,
administration, school, and
district are identified at the
top of the report.
Purpose of This Report: A
description of the FSA
program and the student
report. Each FSA EOC score
report is customized by
subject.
Performance Level & Scale
Score: Performance levels
are indicated by both
number and color for easy
interpretation. An icon
displays the student’s
performance level. Next to
the icon, a statement
provides further information
regarding the performance
level and charts the scale
score on a graph.
For the Algebra 1/Retake
EOC assessment, achieving a
passing score is a graduation
requirement. Therefore, in
addition to the performance
level indicator provided on
the report, a statement also
appears indicating whether
the student met the
graduation requirement.
12
Understanding FSA Reports 2020Page 2 of Score Report
Performance Details: A
table lists the EOC
reporting categories
assessed. The Points
Earned column shows the
actual number of points
earned by the student.
The Points Possible
column provides the total
number of points possible
for each of the reporting
categories.
13
Understanding FSA Reports 2020Page 3 of Score Report
Performance Compared: A
table lists the percentage
of students in each
performance level in the
student’s school, district,
and the state. The
performance level in
which the student scored
is highlighted.
Recommended Resources:
This section provides
information and resources
for students and
parents/guardians.
14
Understanding FSA Reports 2020On-Demand Student Reports
All On-Demand Student Reports are one page and can be downloaded from the FSA Reporting System. The report is a
condensed version of the full report and includes the students scale score, performance level, and applicable reporting
category scores. The information on this report is presented in English only. This report can be printed for parents if
they need their student’s score information prior to when hard-copy four-page reports arrive in districts.
Top of Report: Student
name, FLEID, administration,
school, district, and enrolled
grade are identified at the
top of the report.
Student’s Performance:
Scale Score, Performance
Level, and points earned in
each reporting category are
listed in this table.
Performance Level
Description: Gives
descriptions of each possible
performance level.
Recommended Resources:
This section lists resources
available to students and
families on the FSA Portal.
15
Understanding FSA Reports 2020FSA ELA, Mathematics, and EOC School Report of Students
The School Report of Students for the FSA ELA, Mathematics, and EOC assessments are available in the FSA Reporting
System. Reports are produced for each FSA assessment, and will contain results, listed by grade level, for all students
tested within the school. In addition, a district-level School Report of Students is available for district users and contains
the School Reports of Students for all schools in the district.
FSA ELA and Mathematics
Readers should have their FSA ELA School Report of Students or FSA Mathematics School Report of Students when
reviewing and interpreting information provided in this section.
Top of Report: The subject, title
of the report, administration,
school, and district information
are listed at the top of the
report.
Report Results Table: A table
lists each student’s name,
FLEID, scale score,
performance level, and the
points earned/points possible
by content area. The scale
score ranges for each
performance level are indicated
in the subheading of the
Performance Level column, and
results are presented by grade
level in ascending order.
If a student received an NR
code, it will appear in the Scale
Score column.
Note: A passing indicator is
listed for the ELA assessments
on the Grade 10 and Retake
reports only and will display NA
for all other ELA grades.
Bottom of Report: Footnotes
on how to read certain results
in the table are included at the
bottom of the report, along
with the page number of the
report and the administration
and year for which the results
were released.
16
Understanding FSA Reports 2020FSA Algebra 1, Algebra 1 Retake, and Geometry EOC
Readers should have their FSA EOC Assessment School Report of Students when reviewing and interpreting information
provided in this section.
Top of Report: The subject, title
of the report, administration,
school, and district information
are listed at the top of the report.
Report Results Table: A table lists
each student’s name, FLEID, scale
score, passing indicator,
performance level, and the points
earned/points possible by
content area. The scale score
ranges for each performance level
are indicated in the subheading of
the Performance Level column,
and results are presented by
grade level in ascending order.
If a student received an NR code,
it will appear in the Scale Score
column.
Note: The Core Test Form column,
which indicates the unique form
administered to the student,
appears on reports for spring
administrations only.
Bottom of Report: Footnotes on
how to read certain results in the
table are included here, along
with the page number of the
report and the administration and
year for which the results were
released.
17
Understanding FSA Reports 2020FSA ELA, Mathematics, and EOC District and State Reports of Results
Readers should have one of the following FSA ELA, Mathematics, or EOC reports when reviewing and interpreting
information provided in this section: District Report of Schools, District Summary, State Report of Districts, and/or State
Summary. These reports (shown on the following pages) are formatted similarly and include the following features:
Top of Report: The subject, title of the report, and administration are displayed at the top of the report. District
information is listed at the top of district-level reports.
Report Results Table: Identifying information for the district or school is provided in the first column. On the District
Summary and State Summary, grade level information is also provided in this column. The number of students
tested, mean scale score, and, on certain reports, the percentage passing appears after the identifying information.
The percentage of students in each performance level is provided on the right side of the table along with a
percentage of the passing levels (Levels 3–5).
Bottom of Report: Footnotes on how to read certain results in the table are included here, along with the page
number of the report and the administration and year for which the results were released. The District Summary
and State Summary reports for ELA and Mathematics also include a table of the scale score ranges for each
performance level by grade.
18
Understanding FSA Reports 2020District Report of Schools
19
Understanding FSA Reports 2020District Summary Report
20
Understanding FSA Reports 2020State Report of Districts
21
Understanding FSA Reports 2020State Summary Report
22
Understanding FSA Reports 2020FSA Reporting Categories
The content of each FSA ELA, Mathematics, and EOC assessment is organized by Reporting Category. Reporting
categories group the assessed student knowledge and skills into broad content areas.
As the text-based writing reporting category is also broken out into three writing domain scores, the cautions and
information below should be taken into consideration when interpreting these sub-scores provided in the writing
performance section.
Reporting categories should not be considered the sole indicators for determining the educational needs of students.
Furthermore, providing instruction in a specific reporting category may not be justified and may actually be an
inefficient use of instructional time.
When interpreting student results provided under the performance details for each reporting category, the following
cautions and information should be considered:
• The number of items in a reporting category will vary by grade level (ELA and Mathematics assessments) and
test form (EOC assessments). Consequently, users should not compare reporting category scores across grade
levels or test forms.
• The difficulty of the items measuring each benchmark will vary from one year to the next. Consequently, users
should not compare reporting category scores across years.
Definitions for each reporting category for each of the FSA assessments are provided below. The writing domains for the
FSA ELA Writing component are defined with the text-based writing reporting category. For more information about
how the ELA Writing component is scored, please see the Writing Scoring Samplers and Rubrics on the FSA Portal.
FSA ELA Reporting Categories
FSA ELA assessments measure student performance of the Florida Standards in English language arts. For all grade levels
tested, the FSA ELA tests assess what students know and are able to do in the broad reporting categories listed below.
The difficulty of the concepts assessed on the FSA ELA tests progresses systematically from grade to grade, as does the
complexity of the text presented to the student at each grade level.
Grade 3
• Key Ideas and Details
In this category, students are expected to read closely to comprehend, analyze, and summarize essential
information and concepts, referencing evidence from the text to support inferences and conclusions.
• Craft and Structure
In this category, students are expected to interpret literal and nonliteral meanings of words/phrases, determine
how text structures and text features impact meaning, and distinguish personal point of view from that of the
narrator or author.
• Integration of Knowledge and Ideas
In this category, students are expected to integrate and analyze content presented in diverse media formats and
analyze treatment of similar themes or topics.
• Language and Editing
In this category, students are expected to demonstrate command of the conventions of standard English
grammar, usage, capitalization, punctuation, and spelling.
23
Understanding FSA Reports 2020Grades 4–5
• Key Ideas and Details
In this category, students are expected to read closely to comprehend, analyze, and summarize essential
information and concepts, citing textual evidence to support inferences and conclusions.
• Craft and Structure
In this category, students are expected to interpret connotative and figurative meanings of words/phrases,
analyze how text structures and text features impact the text, and determine the effects of point of view or
purpose.
• Integration of Knowledge and Ideas
In this category, students are expected to integrate and evaluate content presented in diverse media formats
and analyze the treatment of similar themes or topics and how the author uses reasons and evidence to support
points.
• Language and Editing
In this category, students are expected to demonstrate command of the conventions of standard English
grammar, usage, capitalization, punctuation, and spelling.
• Text-Based Writing
In this category, students are expected to draw relevant evidence from various texts to support a claim or
controlling idea and produce clear and coherent writing with development, organization, and style appropriate
to task, purpose, and audience.
Purpose, Focus, and Organization
In this domain, students are expected to write a response that is fully sustained and consistently focused
within the purpose, audience, and task. It should have a clearly stated controlling idea/opinion and
effective organizational structure creating coherence and completeness.
Evidence and Elaboration
In this domain, students are expected to write a response that provides thorough and convincing
support/evidence for the controlling idea/writer’s opinion that includes the effective use of sources,
facts, and details.
Conventions of Standard English
In this domain, students are expected to write a response that demonstrates an adequate command of
basic conventions. The response may include some minor errors in usage, but no patterns of errors. It
should include adequate use of punctuation, capitalization, sentence formation, and spelling.
Grades 6–10 and Retake
• Key Ideas and Details
In this category, students are expected to read closely to understand information; cite textual evidence to
support inferences/conclusions; analyze development and interaction of central ideas, themes, individuals,
events, or supporting ideas; and summarize key concepts.
• Craft and Structure
In this category, students are expected to interpret connotative and figurative meanings of words/phrases,
analyze how word choice affects meaning/tone and how text structures impact the text, and determine the
effects of point of view or purpose.
24
Understanding FSA Reports 2020• Integration of Knowledge and Ideas
In this category, students are expected to integrate and evaluate content presented in diverse media formats;
evaluate arguments for claims, validity, relevance, and sufficient evidence; and analyze treatment of similar
themes or topics.
• Language and Editing
In this category, students are expected to demonstrate command of the conventions of standard English
grammar, usage, capitalization, punctuation, and spelling.
• Text-Based Writing
In this category, students are expected to draw relevant evidence from various texts to support a claim or
controlling idea and produce clear and coherent writing with development, organization, and style appropriate
to task, purpose, and audience.
Purpose, Focus, and Organization
In this domain, students are expected to write a response that is fully sustained and consistently focused
within the purpose, audience, and task. It should have a clearly stated controlling idea/opinion and
effective organizational structure creating coherence and completeness.
Evidence and Elaboration
In this domain, students are expected to write a response that provides thorough and convincing
support with cited evidence for the controlling idea/writer’s claim that includes the effective use of
sources, facts, and details.
Conventions of Standard English
In this domain, students are expected to write a response that demonstrates an adequate command of
basic conventions. The response may include some minor errors in usage, but no patterns of errors. It
should include adequate use of punctuation, capitalization, sentence formation, and spelling.
25
Understanding FSA Reports 2020FSA Mathematics Reporting Categories
FSA Mathematics assessments measure student performance of the Florida Standards in Mathematics. For all grade
levels tested, the FSA Mathematics tests assess what students know and are able to do in the broad reporting categories
listed below. The difficulty of the concepts assessed on the FSA Mathematics tests progresses systematically from grade
to grade, as does the complexity of the numerals and mathematical operations included at each grade level.
Grade 3
• Operations, Algebraic Thinking, and Numbers in Base Ten
In this category, students are expected to represent and solve problems involving multiplication and division;
understand properties of multiplication and the relationship between multiplication and division; multiply and
divide within 100; solve problems involving the four operations, and identify and explain patterns in arithmetic;
and use place value understanding and properties of operations to perform multi-digit arithmetic.
• Numbers and Operations—Fractions
In this category, students are expected to develop understanding of fractions as numbers.
• Measurement, Data, and Geometry
In this category, students are expected to solve problems involving measurement and estimation of intervals of
time, liquid volumes, and masses of objects; represent and interpret data; understand concepts of area and
relate area to multiplication and addition; recognize perimeter as an attribute of plane figures and distinguish
between linear and area measures; and reason with shapes and their attributes.
Grade 4
• Operations and Algebraic Thinking
In this category, students are expected to use the four operations with whole numbers to solve problems, gain
familiarity with factors and multiples, and generate and analyze patterns.
• Numbers and Operations in Base Ten
In this category, students are expected to generalize place value understanding for multi-digit whole numbers
and use place value understanding and properties of operations to perform multi-digit arithmetic.
• Numbers and Operations—Fractions
In this category, students are expected to extend understanding of fraction equivalence and ordering, build
fractions from unit fractions by applying and extending previous understandings of operations on whole
numbers, and understand decimal notation for fractions and compare decimal fractions.
• Measurement, Data, and Geometry
In this category, students are expected to solve problems involving measurement and conversion of
measurements from a larger unit to a smaller unit, represent and interpret data, understand concepts of angle
and measure angles, and draw and identify lines and angles and classify shapes by properties of their lines and
angles.
Grade 5
• Operations, Algebraic Thinking, and Fractions
In this category, students are expected to write and interpret numerical expressions, analyze patterns and
relationships, use equivalent fractions as a strategy to add and subtract fractions, and apply and extend previous
understandings of multiplication and division to multiply and divide fractions.
26
Understanding FSA Reports 2020• Numbers and Operations in Base Ten
In this category, students are expected to understand the place value system and perform operations with
multi-digit whole numbers and decimals to hundredths.
• Measurement, Data, and Geometry
In this category, students are expected to convert like measurement units within a given measurement system,
represent and interpret data, understand concepts of volume and relate volume to multiplication and addition,
graph points on the coordinate plane to solve real-world and mathematical problems, and classify two-
dimensional figures into categories based on their properties.
Grade 6
• Ratio and Proportional Relationships
In this category, students are expected to understand ratio concepts and use ratio reasoning to solve problems.
• Expressions and Equations
In this category, students are expected to apply and extend previous understandings of arithmetic to algebraic
expressions, reason about and solve one-variable equations and inequalities, and represent and analyze
quantitative relationships between dependent and independent variables.
• Geometry
In this category, students are expected to solve real-world and mathematical problems involving area, surface
area, and volume.
• Statistics and Probability
In this category, students are expected to develop understanding of statistical variability and summarize and
describe distributions.
• The Number System
In this category, students are expected to apply and extend previous understandings of multiplication and
division to divide fractions by fractions, compute fluently with multi-digit numbers and find common factors and
multiples, and apply and extend previous understandings of numbers to the system of rational numbers.
Grade 7
• Ratio and Proportional Relationships
In this category, students are expected to analyze proportional relationships and use them to solve real-world
and mathematical problems.
• Expressions and Equations
In this category, students are expected to use properties of operations to generate equivalent expressions and
solve real-life and mathematical problems using numerical and algebraic expressions and equations.
• Geometry
In this category, students are expected to draw, construct, and describe geometrical figures and describe the
relationships between them and solve real-life and mathematical problems involving angle measure, area,
surface area, and volume.
• Statistics and Probability
In this category, students are expected to use random sampling to draw inferences about a population; draw
informal comparative inferences about two populations; and investigate chance processes and develop, use,
and evaluate probability models.
27
Understanding FSA Reports 2020• The Number System
In this category, students are expected to apply and extend previous understandings of operations with fractions
to add, subtract, multiply, and divide rational numbers.
Grade 8
• Expressions and Equations
In this category, students are expected to work with radicals and integer exponents and understand the
connections between proportional relationships, lines, and linear equations.
• Functions
In this category, students are expected to define, evaluate, and compare functions and use functions to model
relationships between quantities.
• Geometry
In this category, students are expected to understand congruence and similarity using physical models,
transparencies, or geometry software; understand and apply the Pythagorean Theorem; and solve real-world
and mathematical problems involving volume of cylinders, cones, and spheres.
• Statistics and Probability and the Number System
In this category, students are expected to investigate patterns of association in bivariate data and know that
there are numbers that are not rational and approximate them by rational numbers.
28
Understanding FSA Reports 2020FSA EOC Reporting Categories
The content of the FSA EOC assessments is organized by reporting categories that are used for test design, scoring, and
reporting purposes. Reporting categories group the assessed student knowledge and skills into broad content areas.
Definitions for each reporting category are provided below for each of the FSA EOC assessments.
Algebra 1 and Retake
• Algebra and Modeling
In this category, students are expected to perform operations on polynomials; understand the relationship
between zeros and factors of polynomials; use mathematical structure of expressions; create, solve, and reason
with equations and inequalities; and choose and use appropriate mathematics to model situations.
• Functions and Modeling
In this category, students are expected to understand the concept of a function; interpret functions and key
features in a context; analyze and graph functions; build a function that models a relationship; construct linear,
quadratic, and exponential functions; and solve problems using functions.
• Statistics and the Number System
In this category, students are expected to extend the properties of exponents to rational exponents; use
properties of rational and irrational numbers; summarize, represent, and interpret data for one- and two-
variable data; and interpret linear models.
Geometry
• Congruence, Similarity, Right Triangles, and Trigonometry
In this category, students are expected to understand congruence and similarity in terms of transformations,
prove and use geometric theorems, demonstrate geometric constructions, define trigonometric ratios, solve
problems involving right triangles, and use congruence and similarity criteria for triangles.
• Circles, Geometric Measurement, and Geometric Properties with Equations
In this category, students are expected to prove and apply theorems about circles, find arc lengths and areas of
sectors, derive the equation of a circle, use coordinates to prove theorems and to solve problems algebraically,
and explain and use volume formulas.
• Modeling with Geometry
In this category, students are expected to apply geometric concepts in modeling situations.
29
Understanding FSA Reports 2020Glossary
Note: Terms defined in this glossary that have been cross-referenced appear in bold text the first time they are
referenced in a definition other than their own.
Achievement Levels— See Performance Levels.
Achievement Level Cut Scores—The minimum scale scores for placement in each of the five performance levels. The
cut scores are established through a process called standard setting and were established in State Board of Education
Rule 6A-1.09422, FAC.
Alternate Passing Score—The passing score that students who participated in the baseline administration (prior to the
establishment of achievement level cut scores) may use to meet the graduation requirement for passing the Grade 10
ELA/Retake and Algebra 1/Retake EOC (or to receive the scholar designation by passing the Geometry EOC assessment).
Baseline Administration—The first administration of new assessments aligned to statewide standards. The FSA baseline
administration for FSA took place in spring 2015. Student results from the baseline administration are used in the
process of standard setting.
Computer-Based Test (CBT)—In 2020, the FSA grades 7–10/Retake ELA, grades 7–8 Mathematics, Algebra 1/Retake
EOC, and Geometry EOC assessments were given in a computer-based format, with paper-based accommodations
provided for eligible students. When taking the test on the computer, students record their answer choices using the
mouse or keyboard, and they may use various CBT tools, such as a highlighter or notepad, as they respond. Before
exiting the assessment and submitting their responses, students are taken to a screen that identifies questions that are
answered, unanswered, and marked for review.
Florida Education Identifier (FLEID)—A code issued by FDOE used to uniquely identify a person in Florida's education
data system.
FSA Reporting System—The system used to access student-, school-, district-, and state-level score reports. Only
authorized users have access to this system.
Items—Test questions that students are required to answer. Information about item types are included in the Test Item
Specifications available on the FSA Portal. In addition, student practice tests (also available on the portal) include
possible item types students may encounter on a test.
Mean—An average of the individual scores that describes the performance of a group of students. The mean is
computed by finding the sum of all scores and dividing by the number of scores used in the sum.
Mean Scale Score—The calculated mean scale score of all students at the school, district, or state level.
Passing Score—The minimum scale score in performance level 3 for each grade and subject. For the grade 10 ELA and
EOC assessments, see alternate passing score.
Paper-Based Test (PBT) — In 2020, the FSA grades 3–6 ELA and grades 3–6 Mathematics assessments were given in a
paper-based format. Paper-based accommodations such as One-Item-Per-Page, Large Print and Braille were provided to
eligible students.
30
Understanding FSA Reports 2020Performance Level— Also referred to as achievement levels, five categories of performance that represent the success
students demonstrate with the content assessed. The performance levels are helpful in interpreting what a student’s
score represents. Performance levels range from 1 to 5, with Level 1 being the lowest and Level 5 being the highest.
Achieving a score in Level 3 or higher is considered satisfactory. The minimum score in Level 3 is the passing score for
each assessment.
Points Earned— The number of raw score points earned by the student in a Reporting Category.
Points Possible—The number of raw score points that may be earned in a Reporting Category. The number of points
possible in a reporting category may change slightly each year.
Previous Performance— The performance of a student in the selected subject in past FSA administrations.
Reporting Category—Broad content areas into which the assessed student knowledge and skills are grouped.
Reporting Category Scores—The points earned out of the points possible for each Reporting Category. Reporting
category scores are also referred to as raw scores.
Scale Score—A scale score is used to report student results on the entire test on the FSA scale. An overall theta score,
which is dependent on how a student answers individual items, is calculated and converted to the scale score in order to
reflect the student’s performance level.
Standard Setting—The process by which achievement level cut scores are established. Standard setting is based on
input from educators, community and business leaders, and the public, as well as the state’s education leadership.
Writing Condition Code—The descriptor assigned to a student ELA Writing response indicating the reason an irregular
score was assigned. (For example, “C” indicates a response that is off topic but receives a conventions score of 0–2.
Similarly, “G” indicates a response that is completely copied text and receives a score of 0.)
Writing Domain Scores— While the ELA Writing component is one category (Text-Based Writing) that contributes to the
overall ELA score, there are three domain scores awarded for each response. The sum of these sub-scores is the total
score for the Text-Based Writing Reporting Category (10 raw score points).
31
Understanding FSA Reports 2020Copyright Statement for this Office of Assessment Publication
Authorization for reproduction of this document is hereby granted to persons acting in an official capacity
within the Uniform System of Public K–12 Schools as defined in Section 1000.01(4), Florida Statutes. This
copyright notice must be included in all copies.
All trademarks and trade names found in this publication are the property of their respective owners and are
not associated with the publisher of this publication.
This publication is provided by the Florida Department of Education to Florida public schools free of charge
and is not intended for resale.
Permission is NOT granted for distribution or reproduction outside the Uniform System of Public K–12 Schools
or for commercial distribution of the copyrighted materials without written authorization from the Florida
Department of Education. Questions regarding use of these copyrighted materials should be sent to the
following:
Office of Assessment
Florida Department of Education
325 West Gaines Street, Suite 414
Tallahassee, Florida 32399-0400
Copyright © 2020
State of Florida
Department of State
32
Understanding FSA Reports 2020You can also read