Watershed Management Planning for the Murrells Inlet Estuary using GIS: Delineation, Assessment, Identification, and Solutions for Fecal Coliform ...
←
→
Page content transcription
If your browser does not render page correctly, please read the page content below
Watershed Management Planning for the Murrells Inlet Estuary using
          GIS: Delineation, Assessment, Identification, and Solutions for Fecal
          Coliform Loading

           Stephen G. Williams M.S.1, Daniel Newquist2, Susan Libes3, Steven G. Strickland P.E.4

          AUTHORS: 1The Earthworks Group, Murrells Inlet, SC 29576, USA, 2 Waccamaw Regional Council of Governments,
          Georgetown, SC 29440, 3Coastal Carolina University, Conway SC 29526, 4The Earthworks Group
          REFERENCE Proceedings of the 2014 South Carolina Water Resources Conference, held October 15-16, 2014 at the
          Columbia Metropolitan Convention Center

   ABSTRACT. Nonpoint source impacts from fecal                     Soils data for the watershed to provide a curve number
coliform bacteria and the resulting closures of shellfish           data layer. This process was also replicated using almost
harvesting grounds has increased the awareness and                  20 year old historic NAPP color infrared aerial
concern in the Murrells Inlet community. The Murrells               photography. The final application of these data were to
Inlet watershed, which extends from the Huntington                  prioritize subwatersheds based upon the location of their
Beach State Park in Georgetown County to the southern               outfalls in relation to SCDHEC monitoring stations
end of Surfside Beach in Horry County, is an elongated              within the inlet with the goal of identifying areas of
watershed with no major incoming freshwater tributary.              concern for Best Management Practice implementation.
The watershed is approximately 14.5 square miles. South                This watershed-based planning effort will provide the
Carolina Department of Health and Environmental                     framework for water quality solutions within the
Control (SCDHEC) approved a TMDL in 2005 to assess                  Murrells Inlet estuary that are likely to aid in reducing
fecal coliform impairment within the inlet. In 2008, the            fecal coliform loading from subwatersheds that discharge
community group Murrells Inlet 2020 (MI2020)                        near the higher priority SCDHEC monitoring stations.
sponsored a volunteer water monitoring program in                   Suggested improvements which could easily be
partnership with Coastal Carolina University (CCU),                 implemented watershed-wide that would quickly begin
Horry, and Georgetown County. When SCDHEC                           benefiting the estuary include pet waste stations and
released the 2011 Shellfish report it resulted in the               educational outreach. The plan also provides engineered
closure of approximately 241 acres of shellfish                     solutions that could be implemented with additional
harvesting grounds on the south end of the inlet. This              funding.
prompted MI2020 to endorse the development of a
watershed-based plan that was funded in part by EPA                                    INTRODUCTION
Section 319 and 604(b) grants provided by SCDHEC.
    The Earthworks Group was a major contributor of                     The Murrells Inlet Watershed Based Plan (WBP) is
services as part of the local grant funding match. Our role         the result of an almost two year effort that started in 2011
included the application of engineering and GIS to                  when SCDHEC revised Shellfish classifications within
address fecal coliform loading within the estuary. Our              Murrells Inlet. These revisions changed many areas that
GIS centric approach included assessing several key                 had previously been approved to conditionally approved
areas. First was the development of a LiDAR surface                 and further increased the areas of restricted classification
model which was used to define the overall watershed.               on the southern end of the estuary. After guidance from
These data were supplemented by stormwater                          CCU, MI2020 was advised that a WBP could help
infrastructure information provided by both counties to             determine why these changes were occurring. As a result,
further define 53 subwatersheds ranging in size from                MI2020 approached Horry and Georgetown County
632.9 to 4.7 acres. There are 25 subwatersheds situated             during the spring of 2012 about partnering on a plan.
along the Murrells Inlet shoreline with runoff entering             Coincidentally, after the counties agreed to join
the inlet via overland sheet flow.                                  SCDHEC announced grant funding opportunities for
    Subwatersheds were analyzed using the SCS Runoff                communities interested in pursuing watershed
Curve Number (CN) method with a 2 year storm event                  management plans.         However, these opportunities
and Time of Concentration (Tc) flow paths. To generate              stipulated that involvement from a Council of
curve numbers a localized Land Use Land Cover (LULC)                Governments (COG) was required. Shortly thereafter,
data layer was created and integrated with USDA NRCS                the WRCOG agreed to oversee the plan. In June 2012,

                                                               1
WRCOG applied for a Section 319 Watershed-based The currently accepted primary delineation is the U.S.
Plan Development Grant which was awarded in October Geological Survey (USGS) 12-digit Hydrologic Unit
2012. EARTHWORKS then became involved as a Code (HUC), named Main Creek, for Murrells Inlet
significant contributor of services to fulfill a portion of which has the classification number 030402080308
the local grant funding match. Other key stakeholders (Seaber et al. 2007). This HUC consists of approximately
included Grand Strand Water and Sewer Authority 10,049 acres and is seen in Figure 1.
(GSWSA), and Georgetown County Water and Sewer
District (GCWSD). Lastly, and as equally important, the
Steering Committee reached out and sought input from
local residents.
The plan’s main concern is the impact fecal coliform
bacteria concentrations are having on the Eastern Oyster
(Crassostrea virginica) which is prompting shellfish bed
restrictions and closures. Oysters are a distinct part of the Figure 1 – USGS 12-digit HUC
local culture of Murrells Inlet, which is widely regarded
as the most economically important shellfish producing METHODS
area along the northern South Carolina coast (WRCOG
2014). The current 12-digit HUC classification was derived
This WBP sought to identify sources of fecal coliform from information which lacks sufficient localized
bacteria impacting water quality in and around the oyster stormwater infrastructure as well as decent base
beds. Then, over a 20 year period, the WBP
topography. Therefore, our first step was to develop a
recommends ways to improve water quality by reducing
higher resolution base topographic layer. This layer was
fecal coliform loadings. In 2005 SCDHEC drafted a
created using Light Detection and Ranging (LiDAR) data
Total Maximum Daily Load (TMDL) report for the provided by Horry and Georgetown Counties and
Murrells Inlet watershed that identified non-point sources became the foundation for delineating an accurate
of pollution as the main contributor to eight monitoring
watershed.
sites failing to meet the fecal coliform standard at that
Further, previous delineations have only included the
time. The standard established in the TMDL requires an overall watershed. Because of variability within the
80% reduction in bacteria loads in order to comply with
coliform data found between monitoring stations from
the water quality standard for shellfish harvesting which the northern and southern ends of the estuary, it was
is implemented nationwide under the National Shellfish determined that further sub-delineations would be
Sanitation Program as overseen by the US Food and
required to meet our goal of localized data specific to
Drug Administration (FDA) (WRCOG 2014). each monitoring station. This subwatershed approach
Additional goals include highlighting the history of
was imperative because a review of the historical
the Murrells Inlet fisheries industry while promoting the
monitoring yielded the need to focus resources on
cultural, economic, and outdoor recreational benefits
addressing fecal coliform loads at monitoring stations
associated with shellfish harvesting sustainability. The which remained consistently above the Shellfish Fecal
plan’s final goal was to increase the public’s Coliform water quality standard.
environmental sensitivity awareness regarding the LiDAR data were processed from 3-dimensional point
shellfish harvesting areas and protecting water quality cloud data LAS (Laser) files using ESRI ArcGIS into a
within the inlet (WRCOG 2014). singular mosaic ArcInfo 32 bit floating point grid file. A
The primary goal of EARTHWORKS services
grid is a raster array of equally sized square cells, in this
included providing baseline spatial data and analysis, and case 5’x5’. Digital Elevation Model (DEM) grids are
technical assistance needed to quantify localized particularly beneficial in spatial modeling and hydrologic
hydrology entering the estuary along with how land use
flow analysis.
issues within the watershed were impacting fecal At this point the DEM was processed using ArcGIS
coliform levels. EARTHWORKS was also fully engaged Spatial Analyst hydrology tools. Because it is best to use
in all other stakeholder level aspects of the planning
a dataset free of sinks (ESRI 2014), the raw DEM file
process as well. was processed to fill sinks which smoothes irregularities.
The Murrells Inlet watershed generally extends from
The smoothed DEM provides a more accurate
the Huntington Beach State Park and North Litchfield representation of overall flow and became the base for a
portions of Georgetown County to the Garden City flow accumulation grid. A flow direction grid was also
Beach and the southern tip of Surfside Beach in Horry
created to account for direction of flow by determining
County along the Hwy 17 corridor.
2the direction of steepest descent from each cell (ESRI As a result the overall watershed was subdivided into
2014). 53 subwatersheds (Figure 3) ranging in size from the
Stormwater infrastructure data obtained from both largest, the 632 acre Melody basin to the smallest, the 4.7
Horry and Georgetown Counties included pipes, ditches, acre Boat Landing subwatershed. All of the
catch basins, manholes, and junction boxes. Most of subwatersheds were named based upon recognizable
these data were obtained in GIS format although there local landmarks, streets, neighborhoods, or other
were also hardcopy engineering plans that were digitized community features that would distinguish them with the
and manually input into the final watershed maps residents.
included in the WBP. The originally delineated 815 subwatersheds were
With the requisite input data layers processed, a base combined into larger subwatersheds based upon their
watershed layer was created using the watershed tool. eventual outfalls into the estuary. There were 21
The default watershed size was initially set to a mean of subwatersheds, of the final 53 subwatersheds, with no
10 acres so that substantially smaller neighborhood-sized singular outfall location into the inlet. These
subwatersheds could be delineated and then assessed subwatersheds are primarily those directly adjacent to the
relative to county stormwater infrastructure data. These estuary and consist of directly discharging overland flow.
watersheds ranged in size from 57 acres, the largest, to a These larger final subwatersheds were important
less than 1 acre sized subwatershed. The watershed tool because the steering committee designated the SCDHEC
processed total areas flowing to a given outlet or pour monitoring stations with priority levels by tier. For
point, typically the lowest points within the mean 10 acre example, Tier One sites were those that have not met the
area. Often these areas would terminate at locations 90th Percentile nor Geometric Mean standard for the
where stormwater infrastructure information indicated an entire assessment period of the long term trend analysis.
existing structure or conveyance.
Figure 2 – Overall Murrells Inlet watershed
Figure 4 – Subwatersheds with prioritization
The final overall watershed area, seen in Figure 2, is
approximately 9,248 acres or 14.5 square miles. The Station 04-16 as displayed above in Figure 4, a Tier
estuary comprises approximately 2,938 acres with the One site, can be seen relative to the closest contributing
remaining 6,310 acres consisting of upland areas that subwatersheds. In this example those watersheds were
contribute stormwater runoff to the estuary. Our primary Mariner/Wesley, Coquina, and Wachesaw. At 408.8
goal was to isolate, as much as possible, areas within the acres, Mariner/Wesley is the fourth largest subwatershed
watershed which were contributing to the variability discharging into the estuary and a significant contributor
found between the coliform levels at monitoring stations to hydrology that courses past Station 04-16. Knowing
from the northern to southern ends of the estuary. which subwatersheds discharge into the estuary closest to
the monitoring stations showing impairment allowed the
steering committee to assess targeted BMP
implementation options.
Land use and historic land use change were also
analyzed in conjunction with United States Department
of Agriculture (USDA) soil survey data with the goal of
developing a set of curve number data layers for 1994
and 2012 with the goal of illustrating changes in overland
flow based upon development.
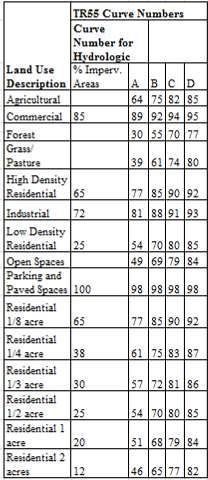
The USDA Soil Conservation Service (SCS)
Figure 3 – Subwatersheds with SCDHEC monitoring developed the Curve Number (CN) method to help
stations determine rainfall runoff rates during storm events. They
3are calculated by evaluating the hydrologic classification CN table, seen simplified for display in Table 1 (USDA
given to soil groups in conjunction with the type of land 1982).
use present. Other data layers that were assessed included septic
Land use/Land Cover (LULC) data are available and sewer system information gathered from GCWSD
through USGS, as well as through SCDNR as part of the and GSWSA. Particular attention was given to the
National Wetland Inventory/LULC data set. These data, locations of pump stations which were closest to the
while valuable, were heavily outdated and created at estuary and SCDHEC monitoring stations.
1:24000 scale which didn’t provide the localized
mapping resolution required to prepare an accurate CN DISCUSSION
layer.
The LULC was used as a starting point and cropped To understand fecal coliform loading into the estuary it
to the overall watershed and then edited extensively by was paramount that an accurate assessment of
manually creating polygons for all of the varying types of stormwater drainage be obtained. During rainfall events
residential and commercial development and forested water that doesn’t infiltrate into the ground becomes
areas as seen in the 2012 natural color aerial imagery. runoff that flows across the surface and into ditches,
Further these data were joined with impervious data streams, or other stormwater conveyances before
available from Horry County. Impervious data from eventually reaching the closest main waterbody. Most
Horry County included paved roads, sidewalks, conventional storm sewer systems do not have treatment
driveways, parking lots, and building footprints. mechanisms; therefore runoff carrying debris, sediment,
Impervious data were not available from Georgetown bacteria, or other non-point source contaminants is
County. Therefore street centerline data were used to discharged into the inlet.
create a paved road layer with widths based upon road Impervious surfaces halt groundwater infiltration
type. While LULC classifications are designed to account which leads to higher surface runoff rates and volumes.
for the impervious nature of a given land use, having As development changes the natural hydrology within a
additional impervious data provided a more accurate watershed, there is increasing pressure to retrofit existing
stormwater runoff representation. stormwater infrastructure to cope. Balancing water
To assess changes in land use properties over time, quality and water quantity requirements in the design of
the processes described in the previous paragraph were stormwater infrastructure in new developments continues
recreated with polygons derived from 1994 National to provide challenges for engineers and stormwater
Aerial Photography Program (NAPP) Color Infrared managers.
(CIR) aerial photographs. Impervious data from current In addition to the subwatershed information, the CN
county data sets were data were beneficial to stormwater engineers when
removed if those features calculating cursory discharge figures for each
were not present at that subwatershed. These discharge rates were valuable in
time. understanding the rate at which coliforms were arriving
With the base LULC into the estuary. Understanding how CN values work
layers completed, the final can be thought in terms of permeability, which is the rate
step to create a CN data at which the ground can absorb rainfall before overland
layer was to join these data sheet flow begins to occur. Soils with high permeability
with the USDA SCS soils (Type A) that can retain more water during rainfall
data available online events, if found in a forested area with no impervious
through SCDNR. Each soil surfaces, would have a very low CN value (e.g. 30). A
series is designated with an 30 value means that the landscape will retain and release
engineering property for water from the watershed slowly.
that soils type. For example, Comparatively, an area of Medium Density
a Type A soil is highly Residential (1/4 acre lots) land use with poorly drained
permeable whereas a Type soils (Type D) would have a much higher Curve Number
D soil is far less permeable. Value (e.g. 87). Those areas would more rapidly release
When soils data were water if there was a lack of onsite retention. Finally,
combined into the new CN fully impervious surfaces such as asphalt parking lots,
layer it became possible to driveways, and roads are designated with the highest
create a new attribute within Curve Number (e.g. 98). These areas exhibit the highest
the data to expresses CN per runoff rates following rain events because water
Table 1 – TR55 Curve polygon. These attributes
Numbers were derived from the TR55
4immediately begins flowing across them with no of MI2020, and generous decision to provide a
infiltration (WRCOG 2012). significant contribution of professional services for the
local grant funding match. Also of particular importance
are Daniel Newquist (WRCOG) and Sue Sledz (MI2020)
who co-led this process. I also acknowledge the
dedication and commitment of my fellow WBP Steering
Committee members Susan Libes, Dave Fuss, Tracy
Jones, Gary Weinreich, Heather Young, Sandra Bundy,
Jim Wilkie, Dan Hitchcock, and Lee Hewitt who were a
Figure 5 – Curve Number layer with subwatersheds joy to work with during this process.
The overall curve number layer is seen above in REFERENCES CITED
Figure 5. In this figure it is apparent that the south-end of
the watershed is less developed meaning fewer Environmental Systems Research Institute, 2014, ArcGIS
impervious surfaces, which are indicated by the higher Desktop Help, online, January 2008
concentrations of yellow and green. This should allow
for bacteria die-off or infiltration into the soil before Seaber, Paul R., Kapinos, Paul F., and Knapp George L.,
being washed into the inlet. This happens because the 2007, Water Supply Paper 2294, U.S. Geological
rate at which the bacteria arrive in the inlet via Survey, Denver, CO
stormwater runoff is lessened, increasing their die-off
rate through additional sunlight/UV exposure. Also, South Carolina Department of Health and Environmental
longer exposure to the soil profile via infiltration Control, 2005, Total Maximum Daily Loads for Fecal
increases the chances that fecal coliform will adsorb to Coliform in Shellfish Waters of the Murrell’s Inlet
soil particles lessening their odds of arriving into the Estuary, South Carolina. SCDHEC Technical Report
estuary. However, the wildlife and waterfowl Number 025-05. Columbia, SC, July 2005
concentration on the south-end is higher because these
natural habitats become a migration point for other United States Department of Agriculture (USDA) Soil
animals from the developed areas in the inlet (WRCOG Conservation Service (SCS), 1982, Soil Survey of
2014). Georgetown County, South Carolina, USDA,
Areas of the inlet’s east and west shorelines, and on Washington, D.C. 1982
the north-end, have greater development indicated by the
browns and grays, resulting in more impervious surfaces. Waccamaw Regional Council of Governments, 2014,
These impervious surfaces cause the water carrying the 2014 Murrells Inlet Watershed Plan: A Community-
bacteria to arrive in the inlet more quickly without based Management Plan to Address Fecal Coliform
natural filtration. Additionally, more fresh water inputs Impairments in Local Shellfish Harvesting Areas.
into the inlet reduce salinity which allows bacteria to Submitted to SCDHEC, Columbia, SC, April 2014
survive longer (WRCOG 2014).
CONCLUSIONS
GIS software and the ever increasing complexity and
resolution of spatial data continues to provide watershed
planners, scientists, and engineers with analytical tools to
develop continually more creative solutions for
watershed improvements. While a subwatershed
approach is not a new concept, our ability to synthesize
all of the differing data sets and present them in ways
that the stakeholders and community could understand
was greatly beneficial. The strong baseline dataset
helped focus the efforts of all involved more effectively.
ACKNOWLEDGEMENTS
EARTHWORKS involvement would not be possible
without Steve Strickland’s passion for the inlet, support
5You can also read