Investor Day Chicago, Illinois March 15, 2017 - AMC Theatres

 
CONTINUE READING
Investor Day Chicago, Illinois March 15, 2017 - AMC Theatres
Investor Day
  Chicago, Illinois
  March 15, 2017
Investor Day Chicago, Illinois March 15, 2017 - AMC Theatres
Disclaimer
While the information included herein is believed to be reliable, AMC and Nordic Cinema Group do not make any representations or warranties, expressed or implied, as to the accuracy or completeness of such
information contained herein or made available, orally or in writing, in connection with the transaction, and nothing contained herein is, or shall be relied upon as, a promise or representation, whether as to the past
or to the future. This presentation does not purport to contain all of the information that may be required to evaluate the transaction and any recipient hereof should conduct its own independent analysis of the
transaction and the data contained or referred to herein. Except as expressly set forth herein, information regarding Nordic Cinema Group has been supplied by Nordic Cinema Group and its representatives and
has not been prepared or confirmed by AMC or its management. Additionally, the business and financial information and materials and any other statement or disclosure on, or made available through, AMC's
website and Nordic Cinema Group’s website or other websites referred to herein shall not be incorporated by reference herein unless specifically identified as such.

AMC’s consolidated financial statements are prepared and presented in accordance with generally accepted accounting principles ("GAAP"). Certain items contained in this presentation, including Adjusted EBITDA
and Pro Forma Adjusted EBITDA for the “Completed Acquisitions”, are non-GAAP financial measures and are provided as a supplement and should not be considered an alternative to any GAAP measure of our
operating performance, liquidity or profitability. The presentation of these financial measures is not intended to be a substitute for or superior to any financial information prepared and presented in accordance with
GAAP. While management believes such non-GAAP measures provide recipients with useful supplemental information, there are material limitations associated with the use of non-GAAP financial measures as an
analytical tool, and these measures may be different from non-GAAP financial measures (even those similarly-titled) used by other companies, including members of the peer group shown throughout this
presentation. Such non-GAAP measures are presented here because we believe they are widely used by investors and analysts to measure performance. Our management also uses such measures for their
internal analysis. The non-GAAP financial measures included in this presentation should be reviewed in conjunction with AMC’s financial statements and related footnotes contained in documents filed with the SEC.

This presentation includes “forward-looking statements”. Forward-looking statements may be identified by the use of words such as “forecast,” “plan,” “estimate,” “will,” “would,” “project,” “maintain,” “intend,”
“expect,” “anticipate,” “strategy,” “future,” “likely,” “may,” “should,” “believe,” “continue,” and other similar expressions that predict or indicate future events or trends or that are not statements of historical matters.
Similarly, statements made herein and elsewhere regarding the pending acquisition of Nordic Cinema Group (“the target”) are also forward-looking statements, including statements regarding the anticipated closing
date of the acquisition, the source and structure of financing, management’s statements about effect of the acquisition on AMC’s future business, operations and financial performance and AMC’s ability to
successfully integrate the targets into its operations. These forward-looking statements are based on information available at the time the statements are made and/or management’s good faith belief as of that time
with respect to future events, and are subject to risks, trends, uncertainties and other facts that could cause actual performance or results to differ materially from those expressed in or suggested by the forward-
looking statements. These risks, trends, uncertainties and facts include, but are not limited to, risks related to: motion picture production and performance; AMC's lack of control over distributors of films; intense
competition in the geographic areas in which AMC operates; increased use of alternative film delivery methods or other forms of entertainment; shrinking exclusive theatrical release windows; international
economic, political and other risks; risks and uncertainties relating to AMC's significant indebtedness; limitations on the availability of capital; risks relating to AMC's inability to achieve the expected benefits and
performance from its recent acquisitions; AMC's ability to comply with a settlement it entered into with the U.S. Department of Justice pursuant to which it agreed to divest theatres and divest holdings in National
CineMedia, LLC; the failure to obtain the necessary financing arrangements as set forth in the debt commitment letters entered in connection with the Nordic Acquisition, or the failure of the Nordic Acquisition to
close for any other reason, including the failure to receive regulatory approval; AMC's ability to refinance its indebtedness on favorable terms; optimizing AMC's theatre circuit through construction and the
transformation of its existing theatres may be subject to delay and unanticipated costs; failures, unavailability or security breaches of AMC's information systems; risks relating to impairment losses and theatre and
other closure charges; AMC's ability to utilize net operating loss carryforwards to reduce its future tax liability; review by antitrust authorities in connection with acquisition opportunities; risks relating to unexpected
costs or unknown liabilities relating to recently completed acquisitions; risks relating to the incurrence of legal liability; general political, social and economic conditions and risks, trends, uncertainties and other facts
discussed in the reports AMC has filed with the SEC. Should one or more of these risks, trends, uncertainties or facts materialize, or should underlying assumptions prove incorrect, actual results may vary
materially from those indicated or anticipated by the forward-looking statements contained herein. Accordingly, you are cautioned not to place undue reliance on these forward-looking statements, which speak only
as of the date they are made. Forward-looking statements should not be read as a guarantee of future performance or results, and will not necessarily be accurate indications of the times at, or by, which such
performance or results will be achieved. For a detailed discussion of risks, trends and uncertainties facing AMC, see the section entitled “Risk Factors” in the documents AMC has filed with the SEC, and the risks,
trends and uncertainties identified in their other public filings. AMC does not intend, and undertakes no duty, to update any information contained herein to reflect future events or circumstances, except as required
by applicable law.

                                                                                                                                                                                                                                    2
Investor Day Chicago, Illinois March 15, 2017 - AMC Theatres
Company Representatives

            Adam Aron
            Chief Executive Officer and President

            Craig Ramsey
            Executive Vice President and Chief Financial Officer

                                                                   3
Investor Day Chicago, Illinois March 15, 2017 - AMC Theatres
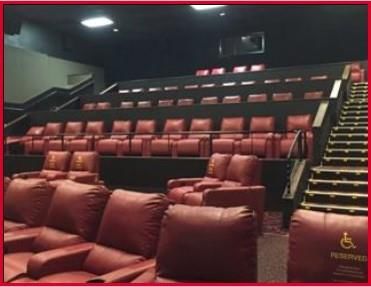
AMC Today – Global Scale & Diversity

                                                                                              Recent M&A Transactions Have Created Largest
       AMC is the largest exhibitor in the US, in Europe                                      Circuit in the World
       and in the World


                                                                                              (Screen Count as of 12/31/16)

       AMC’s footprint including Nordic Cinema:
                                                                                                  11,225

       – Operates in 15 countries
                                                                                                       (1)
                                                                                                   667

       – Over 1,000 theatres and 11,000 screens (1)
                                                                                                   2,249
                                                                                                                           Over 50% larger than the
                                                                                                                            next largest competitor
       – 385mm of annual attendance (2)

       – #1 operator in 8 countries; #1 or #2 operator in 11                                                 7,267
                                                                                                                7,267

             countries (3)                                                                         2,895

      Customer experience leader with universally
       deployable strategy and growth initiatives
                                                                                                                   5,903
                                                                                                                            5,903
                                                                                                                           5,414        5,414

                                                                                                                                    4,917           4,917

      Largest global procurer of films, theatrical food
       and beverage items, lighting and supplies
                                                                                                                                            2,895 2,877           2,895           2,877
                                                                                                   5,414
                                                                                                                                                          2,565                              2,565
Pro Forma Summary Financials (Ex-Nordic)(4)                                                                                                                       2,249                                    2,249
                                                                                                                                                                          2,053                                           2,053
(FY2016, $ in mm)                                                                                                                                                                  1,875
                                                                                                                                                                                           1,683

                                                                                                                                                                                                   1,051
                                                                                                                                                                                                              (1)
                                                                                                                                                                                                           667
                                                      Adj. EBITDA                      $842                                                                                                                         528

     Revenue                   $4,915
                                                           Margin                       17%      AMC
                                                                                                   ProPF
                                                                                                  AMC  PF Regal Cinemark
                                                                                                           Cinemark        AMC CJCinepolis
                                                                                                                     Cinepolis    CJV      Carmike
                                                                                                                                           Odeon   CJ Vue
                                                                                                                                                      CJV Cinemex
                                                                                                                                                              Pathe Odeon  Cinew
                                                                                                                                                                       Kinepolis
                                                                                                  Forma

       (1)     Includes 50 theatres in which Nordic has a “substantial minority interest”.
       (2)     LTM September 2016.                                                                                                                                                                                  4
       (3)     Based on numbers of screens.
       (4)     Represents AMC Pro-forma for Carmike and Odeon excluding synergies.
Investor Day Chicago, Illinois March 15, 2017 - AMC Theatres
Global Platform
Pro forma circuit, including Nordic, will have more than 1,000 theatres and 11,000 screens, in 15 countries (1)

 U.S.: Large Market and Customer Experience Leader                                                           Europe: Platform for Investment and Expansion (1)

      660 theatres                                                                                            364 theatres
     8,293 screens                                                                                           2,932 screens
#1                                                                                                      #1

                                                                                                                                                                             Nordic
                                                                                                                                                                             Odeon and UCI

                                                                                     AMC Major Market
                                                                                     AMC Location
                                                                                                                   -Sweden                                   -Finland
                                                                                                                     Theatres     Screens                      Theatres   Screens
                                                                                                                       72           384                          24         132
                                                                                                              #1                                                                       #1

                                                                                                                         -Lithuania, Estonia, Latvia         -Norway
                                                                                                                     Theatres     Screens                      Theatres   Screens
                                                                                                                        9           67                           11         74
                                                                            183 Legacy                        #1
     52% of U.S.                       #1 or #2
                                                                           AMC Recliner                                                    -Denmark
     Population                     Position in 22                                                                                            Theatres   Screens
                                                                              Reseat
      Within 10                     of the Top 25                                                                                                2         10
                                                                           Theatres (28%
       Miles                        U.S. Markets(2)
                                                                             of Circuit)                           -United Kingdom         -Ireland          -Spain       -Portugal
                                                                                                                     Theatres (3) Screens                      Theatres   Screens
                                                                                                                       123          976                          49         567
                                                                                                                                                                                       #1

                                                                                                                    -Italy                                    -Germany      -Austria
                                                                                                                     Theatres     Screens                      Theatres   Screens
      Note:   Theatre and screen counts as of 12/31/2016.                                                              48           481                          26         241
                                                                                                              #1
              Includes 50 theatres in which Nordic has a “substantial minority interest”.
      (1)
      (2)     Based on Box Office revenue.
                                                                                                                                                                                             5
      (3)     Includes one legacy AMC theatre (16 screens).
Investor Day Chicago, Illinois March 15, 2017 - AMC Theatres
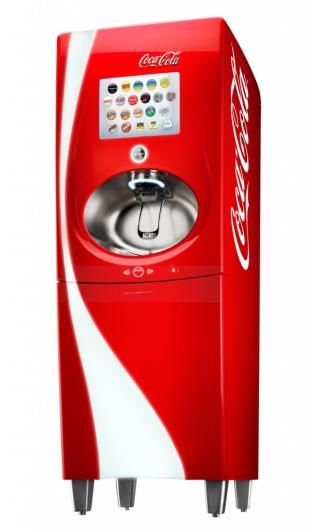
Industry is Large and Stable with Attractive Value Proposition
The Box Office Has Demonstrated a Positive Long-Term Trend
                                                                        North American Box Office, $ in billions

        $12
        $11
        $10
         $9
         $8
         $7
           Dec-03 Dec-04 Dec-05 Dec-06 Dec-07 Dec-08 Dec-09 Dec-10 Dec-11 Dec-12 Dec-13 Dec-14 Dec-15 Dec-16

                                                                      NA Box Office, Trailing 12 Months             Trend Line

Movies Offer Value vs Other Out-of-Home Entertainment Options
                                                                     Cost of Comparable Entertainment Options

      Average Ticket Price for a Family of Four
                                                                                                                                                         $600

                                                                                                                                             $422
                                                                                                                    $343         $344
                                                                                        $216               $249
                                                    $193              $209
                                  $116
                 $34

                                                              (1)                              (3)            (3)
              Movies              MLB             Dinner            Theme               NBA                NHL      NFL          Skiing (4) Concert (5) Broadway
                                                                    Parks (2)                                                                             Show (6)
    Source:   Rentrak, National Association of Theatre Owners, Wall street research, MPAA, Ticketmaster.
    Note:     North America box office figures represent the U.S. and Canada.
    (1)       Based on $39 pix-fixe dinner plus 24% in tax and tip.
    (2)       Theme park average ticket data based on latest available from 2014.
    (3)       NBA and NHL data is for 2014-15 season.
    (4)       Based on Killington single-day lift tickets for 2017.                                                                                                  6
    (5)       Based on Billy Joel tickets at Madison Square Garden.
    (6)       Based on Lion King Broadway tickets at $150 per ticket, including tax.
Investor Day Chicago, Illinois March 15, 2017 - AMC Theatres
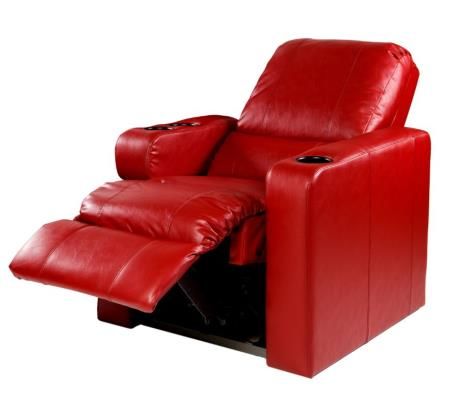
Record Industry Box Office and AMC Initiatives Create Growth Potential
 Record Box Office Performance in 2015 and 2016
 (Box Office in $ billions)(1)

                                  North America                                                                                                         Europe(2)

                                                             $11.5            $11.9
                            $11.1           $11.4
            $10.3                                                                                                                  $4.3                       $5.0                    $4.9

           2014A           2015A            2016A           2017E             2018E                                              2014A                      2015A                  2016A

                                      2017 Films                                                                                                         2018 Films
   •   Lego Batman Movie –                                    •      Wonder Woman –                                    •      Bad Boys for Life                       •    Jurassic World 2

   •   Beauty and the Beast –                                 •      Cars 3                                            •      The Predator                            •    Ant-Man & The Wasp

   •   The Fate of the Furious –                              •      Despicable Me 3                                   •      Wreck It Ralph 2                        •    Secret Life of Pets 2

   •   Guardians of the Galaxy 2 –                            •      Thor: Ragnarok                                    •      Avengers: Infinity War                  •    Fantastic Beasts and

   •   Pirates of the Caribbean: Dead                         •      Justice League                                    •      Star Wars: Han Solo                          Where to Find Them 2

       Men Tell No Tales –                                    •      Star Wars Episode                                 •      Toy Story 4                             •    Avatar 2

                                                                     VIII -

                                                                     : Indicates Film has been already announced in IMAX Format
       Source: Wall Street research, Screen Digest.                                                                                                                                                7
       (1) As of 12/31/16.
       (2) Based on AMC’s footprint in Europe. Includes Germany, Austria, U.K., Ireland, Spain, Portugal, Italy, Finland, Estonia, Latvia, Lithuania, Norway and Sweden.
Investor Day Chicago, Illinois March 15, 2017 - AMC Theatres
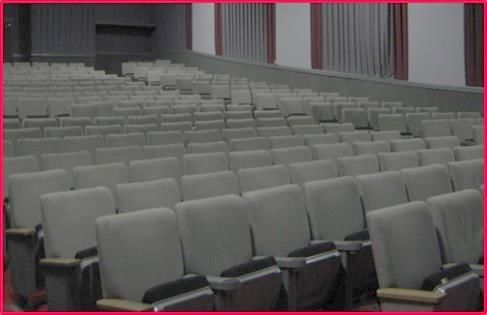
AMC’s Strategy: Enhance + Engage + Expand
Leveraging AMC’s Success Across a Larger Base
Creates Value                                                                                                     1      Enhance
                                                                                                                      Comfort and convenience initiatives
                                                                                                                       – Recliner seating / Reserved seating
                                                                                                                      Food & Beverage
                                                                                                                       – Coke Freestyle / MacGuffins /
                                                                                                                         Expanded Food Offerings
                                                                                                                      Premium Sight & Sound
                                                                              1                                        – IMAX / Dolby Cinema at AMC / PLF

      3                                                                                                           2      Engage
                                                                                                                      World class marketing
                                                                                                                       – Rapidly growing AMC Stubs loyalty program
                                                                                                                       – Newly re-launched website, mobile apps and
                                                                                                                         social media
                                                                                                                       – Pricing optimization
                                                                                                                      New U.S. Theatre Branding
                                                                                                                      Targeted programming

                                                                                                                  3      Expand
                                                                                                                      Disciplined and value accretive acquisitions
                                                                                                                       – Three acquisitions totaling over $3.25bn executed
                                                                                                                          in past 12 months (1)
                                                 2                                                                    Increases pipeline to deploy initiatives
                                                                                                                      Global procurement savings
                                                                                                                      Overhead efficiency

                                                                                                                                                                             8
     (1)   Based on publicly announced transaction size / firm value. Assumes SEK/USD of 0.1126 and GBP/USD of 1.2375 as of 01/20/2017.
Investor Day Chicago, Illinois March 15, 2017 - AMC Theatres
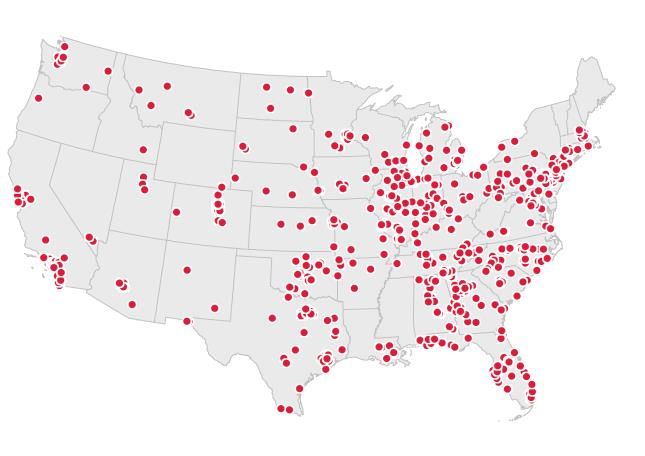
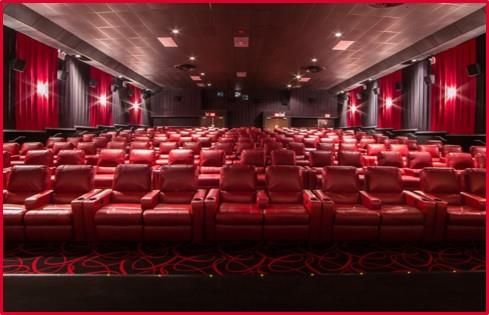
1 Quicken Pace of Theatre Innovation Deployment
Recliner Reseats at Legacy AMC                                                (1)
                                                                                        Progress to Date                                      Legacy AMC
                                                                                         at Legacy AMC                                          Pipeline
                                                                               Screens:(2)                              1,898                          Screens
                                                                               % of Legacy AMC                           35%
                                                                                                                                            2017:       2,650
                                                                               Growth to Date(3)
                                                                                  Attendance:                            47%
                                                                                                                                            2018:       3,350
                                                                                  ATP:                                     7%
                                                                                  Total Revenue:                         64%

                    Pre-Renovation Theatres                                                                                       Renovated Theatres

  (1)   Excludes Odeon, Carmike and Nordic.
  (2)   As of December 31, 2016. Includes 1,740 recliner screens, 110 DIT recliner screens and 48 Dolby Cinema recliner screens                                  9
  (3)   First 74 locations converted prior to January 1, 2016, excludes screens acquired, DIT and Dolby recliner screens.
1 Legacy AMC Food & Beverage Innovation has Increased Revenue
Growing F&B Take Rates…                                                 …Have Diversified Legacy AMC’s Revenues…
(F&B Take Rate as % of Total Attendance)(1,2)                           (F&B Revenues as a % of Total Revenue)(2)

                                                           71%                                                      31.5%
                                                                                                                    31.5%
                                                          71.0%

                                                                                      27.6%
                                                                                      27.6%
                64%
               64.0%

              2011A                                       2016A                       2011A                         2016A

…And Improved F&B Margins
(LTM as of 12/31/16)(2)

                           86%
                          Gross Profit
                            Margin

      (1)    For legacy AMC (excludes Odeon, Carmike, and Nordic).                                                          10
      (2)    52 weeks ended December 29, 2011, and December 31, 2016.
1 Sight and Sound Remains an Opportunity (1)

                                                           • Largest IMAX operator in the US with 178 locations expected to be open by
                                                             end of March 2017

                                                           • Premium Large Format (PLF) experience

                                                           • Global brand

                                                           • Announced expansion with a total of 185 IMAX screens to be operational by
                                                             2019

                                                            • Largest Dolby Cinema operator in the US with 48 locations

                                                            • Dolby Atmos Sound, HDR Laser, with power recliners

                                                            • 50 additional Dolby Cinema at AMC auditoriums are expected to be open by
                                                              the end of 2017

                                                            • Announced acceleration of up to 160 auditoriums by the end of 2018

        Prime at              ccccc                          • Prime at AMC proprietary PLF experience

                                                             • Designed for smaller locations that can’t support high-end premium
                                                               investment

                                                             • No shared economics

                                                             • Launches March 2017

                                                                                                                                         11
  (1)     As of 12/31/2016, for legacy AMC circuit and excludes Odeon, Carmike, and Nordic.
2     World Class Marketing to Drive Growth (1)
            Re-launch of AMC Stubs
                                                                • Introduced new free loyalty tier, relaunched paid tier

                                                                • More than doubled membership since January 1, 2016

                                                                • Surpassed 6 million member households

                                                                • Early box office and food & beverage results are very positive

    Re-launch of AMC Website and App                             • New website and Smartphone app rolled out in December 2016

                                                                 • More graphically rich interface

                                                                 • More robust content

                                                                 • Increase ease of use, drive action, online ticketing growth

                                                                 • New Vice President of Pricing and new pricing department
       Increased Focus on Pricing
                                                                 • First pricing department in AMC’s 95-year history

                                                                 • Dedicated to optimizing pricing across box office and food & beverage

                                                                 • Develop pricing strategies and competitive actions

                                                                 • AMC Theatres – 400 theatres, larger, more urban markets, AMC amazing
       New U.S. Theatre Branding
                                                                 • AMC Classic Theatres – 200 theatres, midsized, non-urban, value oriented

                                                                 • AMC Dine-In Theatres – 60 theatres, full kitchens, MacGuffins, full dining service

                                                                 • Aligns guest expectations and cost structure

                                                                                                                                                    12
      (1)      As of 03/01/2017, for legacy AMC circuit and excludes Odeon, Carmike, and Nordic.
3 Acquisitions Provide Scale and Growth Opportunities

 Theatres / Screens (1)                                        271 / 2,923                                        245 / 2,249                                         118 / 667 (2)

                                                                                                               Western and                              Scandinavia, Nordic and Baltic
 Geographic Footprint                                Suburban and rural U.S.
                                                                                                              Southern Europe                                     Regions
                                                Combined the #2 and #4                             Largest European exhibitor                         Expands AMC’s leadership
                                                 U.S. theatre exhibitors to                          with prime locations                                position in Europe and
                                                 create the customer                                                                                     Globally
                                                 experience leader
                                                                                                    Theatre renovations could
                                                                                                     lead to meaningful increase                        Compelling market share
                                                Limited geographic overlap                          in Odeon EBITDA
                                                 and complementary genre
                                                 box office performance                                                                                 High-quality operator with
                                                                                                    Attractive valuation relative                       attractive growth and
 Rationale                                                                                           to European public                                  margins
                                                Apply AMC’s proven growth                           comparables
                                                 initiatives and management
                                                 expertise to Carmike’s                                                                                 Attractive new build pipeline
                                                 business                                           The Pound was near all-time                         – Nordic has 10 theatres in
                                                                                                     lows vs the Dollar which                            development
                                                                                                     reduced the purchase price
                                                Extensive cost synergies
                                                 (Film, F&B and G&A)                                                                                    Opportunity to combine back
                                                                                                                                                         office functions with Odeon

 Cost Synergies                                                  ~$35mm                                             ~$10mm                                               ~$5mm

 Equity Issued In Connection
                                                               $624mm (3)                                          $157mm (4)                                         $268mm (5)
 with Transaction
     (1)     Theatre and screen counts as of 12/31/2016. Carmike circuit as of acquisition date of 12/21/2016.
     (2)     Includes a substantial minority interest (~50% ownership) in 50 associated theatres to which Nordic provides a variety of services.
     (3)     Represents the issuance of 8,189,808 AMC Class A Common Stock in connection with the Carmike Acquisition and $350 million of equity proceeds used to repay the Carmike funded bridge. Based

     (4)
             on a closing share price of $33.45 on 12/20/2016.
             Represents the issuance of 4,536,466 AMC Class A Common Stock in a private placement in connection with the Odeon Acquisition. Based on a closing share price of $34.55 on 11/29/2016.
                                                                                                                                                                                                       13
     (5)     Represents net proceeds after repayment of the Carmike funded bridge from the $640mm of gross primary proceeds raised in February 2017.
Larger Platform for Growth Initiatives (1)
                                                              Core                               Growth Initiative Pipeline
                                                             Circuit
                                                          (w/o recliner                             Recliner                                      Dine-In                                    Total
                                                             seats)                                 Re-seats                                     Theatres
                                                                                                                                       w/o recliners         w/recliners

 Legacy AMC Screens                                            3,330                                     1,788                            202                  110                           5,430
 As of 12/31/16

 5-Year Target Screens

   Legacy AMC (2)                                              2,159                                     3,744                            210                  127                           6,240

   (+) Carmike (3)                                             2,504                                       458                               -                  18                           2,980

   (+) Odeon (3)                                               1,656                                       580                               -                    -                          2,236

   (+) Nordic (3)(4)                                             459                                        48                             12                     -                            519

 5-Yr. Target Screens
                                                               6,778                                     4,830                            222                  145                          11,975
 in 2021

                                    Acquisitions Doubled Addressable Screen Count

                                    Opportunity to Triple the Number of Recliners in Legacy AMC
                                    Recliner Screens will Increase From 35% to 42% of Circuit in Five Years

        (1) Incremental initiatives by AMC. These objectives are aspirational, are subject to significant business, economic, regulatory and competitive uncertainties and contingencies, many of which are
            beyond the control of the Company and its management, and are based upon assumptions with respect to future decisions, which are subject to change. Actual results will vary and those
            variations may be material. Nothing in this presentation should be regarded as a representation by any person that these objectives will be achieved and the Company undertakes no duty to
            update its objectives.
        (2) Includes new builds, spot acquisitions, conversions and closures.                                                                                                                                 14
        (3) Includes conversions and committed new builds.
        (4) Three-year targeted screens.
AMC Has Delivered Above and Beyond December 2013 IPO Story
Legacy AMC Revenue                                                                         Legacy AMC Theatre Adjusted EBITDA
($ in millions)                                                                            ($ in millions)

                          Growth Comparison                   CAGR (1)                                        Growth Comparison                 CAGR (1)
                                                               ’14-’16                                                                           ’14-’16

                          AMC Targets at IPO (2)               ~4 – 5%                                        AMC Targets at IPO (2)             ~8 – 9%

                          AMC’s Actual Growth Rate               8.2%                                         AMC’s Actual Growth Rate            14.1%

                          U.S. Peer Actuals     (3)
                                                             ~4.5 – 6.5%                                      U.S. Peer Actuals   (3)
                                                                                                                                                ~6.5 – 9.0%

                                             $2,947                     $3,094
                                                                                                                                                           $540
                  $2,695                                                                                                            $502
                                                                                                             $429

                    2014                      2015                 9/30/16 LTM                               2014                   2015             9/30/16 LTM

   Average Ticket Price                                                                     Theatre EBITDA Margin
                    $9.43                      $9.61                      $9.60                              15.9%                      17.0%                 17.5%

   Concession Per Patron                                                                    Operating Cash Flow
                    $4.26                      $4.62                      $4.79                              $297                       $468                  $470
         Note:    Excludes financial impact from Odeon, Carmike and Nordic acquisitions.
         (1)      CAGR through 9/30/2016 LTM.                                                                                                                         15
         (2)      Represents long-term targets at time of IPO.
         (3)      Includes Regal and Cinemark.
AMC’s Recent Financial Performance
AMC has had a strong last 12 months, with EBITDA up over 12% from same time last year.

FY2016 Performance (1)                                                                                        Key Messages
($ in millions)
Admissions Revenue
                                                8.3%
                                                                                                               2016 Domestic Box Office grew ~2% YoY to an all-time
                     $1,892                                            $2,049

                                                                                                                   high of $11.4 billion

                     2015A                                             2016A                                   AMC exceeded $3 billion in annual revenues for the first
F&B Revenue
                                              12.0%
                                                                                                                   time ever
                      $910                                             $1,019

                                                                                                               59% growth (YoY) in AMC Theatres offering recliners.
                     2015A                                             2016A                                       Recliners now represent 35% of the legacy AMC footprint
Total Revenue
                                                9.8%

                     $2,947                                            $3,236
                                                                                                               Redesigned AMC Stubs program exceeds 6 million

                                                                                                                   members
                     2015A                                             2016A
Adj. EBITDA
                                                                                                               AMC initiates new International reporting segment
                                              12.2%

                      $536                                              $602

                     2015A                                             2016A
Margin
                      18.2%                                             18.6%
    Source: Company filings.                                                                                                                                                                              16
    (1)     Results for the 2016 fourth quarter include the contribution from two acquisitions completed during the quarter. On November 30, 2016, AMC completed the transaction to acquire Odeon & UCI
            Cinemas Holdings Ltd., and on December 21, 2016, AMC completed the transaction to acquire Carmike Cinemas, Inc.
2016 Pro Forma Results
          AMC, Odeon & Carmike                      Nordic Information
             LTM 12/31/2016                            LTM 9/30/16

              $842M
                2016 Pro forma
                 Adj. EBITDA
                                                     $375M
                  (ex-Nordic)                      Total Revenue

       $35M
     Expected Carmike
                          +           $10M
                                  Expected Odeon
        Synergies                    Synergies
                                                        $5M
                                                      Expected Nordic
                                                         Synergies

                           =                        $842M
                                                   Total Revenue
                                                      Operating
                                                   margins greater
           $887M        (ex-Nordic)
                                                     than legacy
                                                    AMC’s margins

                                                                         17
AMC Investment Highlights

   #1 operator in the U.S., Europe and the World

   Exhibition industry is large and stable with a positive outlook

   Proven track record of success

   Large pipeline of theatres to deploy proven growth initiatives

   Well positioned to deliver superior results through our growth strategies

   Financing of recent acquisitions reflect commitment to both debt and equity
    stakeholders

                                                                                  18
Appendix
      Reconciliation of Pro Forma
      Adjusted EBITDA:
      (dollars in thousands)
      (unaudited)
                                                                         LTM
                                                                     December 31,

                                                                        2016
      Earnings from Continuing operations                            $ (19,357)
      Plus:
                 Income tax provision                                $ 27,862
                 Interest expense                                    $ 241,129
                 Depreciation and amortization                       $ 475,675
                 Impairment of long-lived assets                     $   9,036
                 Certain operating expenses (2)                      $ 23,129
                 Equity in earnings of non-consolidated entities     $ (51,947)
                 Cash distributions from non-consolidated entities   $ 40,052
                 Investment income                                   $ (10,154)
                 Other expense                                       $ 90,829
                 General and administrative expense-unallocated:
                  Merger, acquisition and transaction costs          $   1,281
                  Stock-based compensation expense (3)               $ 14,612
      Adjusted EBITDA (1)                                            $ 842,147

                                                                                    19
You can also read