September 2021 Investor Presentation - Pivoting toGrowth

Page created by Esther Ellis
 
CONTINUE READING
September 2021 Investor Presentation - Pivoting toGrowth
Advancing Simplification,
   Pivoting to Growth

   September 2021
Investor Presentation
September 2021 Investor Presentation - Pivoting toGrowth
Statements in this presentation that are not historical facts are forward-looking statements within the
   SAFE                meaning of the Private Securities Litigation Reform Act of 1995 that involve a number of risks and
                       uncertainties that could cause actual results to differ materially from those contemplated by the relevant

   HARBO R             forward-looking statements.

                       These forward-looking statements include, but are not limited to, statements regarding possible or

   STATEMENT           assumed future results of operations, business strategies, growth opportunities and competitive positions,
                       as well as the rapidly changing challenges with, and the Company's plans and responses to, the novel
                       coronavirus (COVID-19) pandemic and related economic disruptions. Such forward-looking statements
                       speak only as of the date the statements were made and are not guarantees of future performance.
                       Forward-looking statements are subject to a number of risks, uncertainties, assumptions and other factors
                       that could cause actual results and the timing of certain events to differ materially from those expressed in
                       or implied by the forward-looking statements. These factors include, but are not limited to, prevailing
                       market conditions and other factors related to the Company's REIT status and the Company's business, risks
                       associated with COVID-19 and its impacts on the Company's businesses, results of operations, liquidity and
                       financial condition, the evaluation of alternatives by the Company related to its materials and construction
                       business and by the Company's joint venture related to the development of Kukui‘ula, generally discussed
                       in the Company's most recent Form 10-K, Form 10-Q and other filings with the SEC. The information in this
                       presentation should be evaluated in light of these important risk factors. We do not undertake any
                       obligation to update the Company's forward-looking statements.

Partners for Hawai‘i                                                                        Alexander & Baldwin I NYSE: ALEX   2
September 2021 Investor Presentation - Pivoting toGrowth
SUPERIOR
                       M A R K E T F U N D A M E N TA L S
                       Dynamic, Growing Market with Structural Limitations
                       on New Supply

                       HIGH-QUALITY
                       PORTFOLIO
    ADVANCING          Irreplaceable Assets with
                       Embedded Growth Opportunities
    SIMPLIFICATION,
    PIVOTING TO        S I M P L I F I C AT I O N
                       NEARING COMPLETION
                       Facilitates Pivot Back to CRE Investments
    GROWTH
                       STRONG
                       BALANCE SHEET
                       Supports Accelerated Investment Activity

                       COMMITMENT TO
                       C O R P O R AT E R E S P O N S I B I L I T Y
                       Significant Progress in ESG Initiatives in Recent Years

Partners for Hawai‘i
             Hawai’i                        Alexander & Baldwin I NYSE: ALEX   3
September 2021 Investor Presentation - Pivoting toGrowth
KAUAI                          OAHU

     I R R E P L A C E A B L E                    A S S E T S

     O UTSTA ND ING
                                                                                                                                                          MAUI
       PO RTFO LIO
           Strategically located portfolio of
      high-quality, needs-based retail, industrial
               and ground lease assets                            $104.2M                                                                                                    HAWAI‘I ISLAND

Largest portfolio of grocery-anchored, neighborhood             Total NOI (2019; Pre-COVID)
             shopping centers in Hawai‘i                                                                                              OAHU
                                                                                                                                      Hawai‘i GDP I 74%
          The “one-stop shop” for new market
           entrants with both retail and light
              industrial/distribution needs
                                                                   $94.3M                                                             Q2 2021 NOI I 73%

                                                                     Total NOI (2020)                                                 MAUI
    High-performing market with compelling
              growth opportunities                                                                                                    Hawai‘i GDP I 11%
  • Many retail chains’ top-performing stores are                                                                                     Q2 2021 NOI I 13%
       in Hawai‘i (e.g., Sam’s Club, Safeway,
     Home Depot and California Pizza Kitchen)                       $28.5M                                                            OTHER ISLANDS
    • 32%1 of nation’s top-25 retailers and QSRs                   Total NOI (Q2 2021)                                                Hawai‘i GDP I 15%
        do not currently have any operational
                                                                                                                                      Q2 2021 NOI I 14%
                  Hawai‘i locations
                                                                                                                                     2: Per State of Hawai‘i DBEDT data.

 1: Per QSR Magazine and National Retail Federation data.           Note: See appendix for a statement on management’s use of non-GAAP financial measures and reconciliations.
 Partners for Hawai‘i                                                                                                                                        Alexander & Baldwin I NYSE: ALEX   4
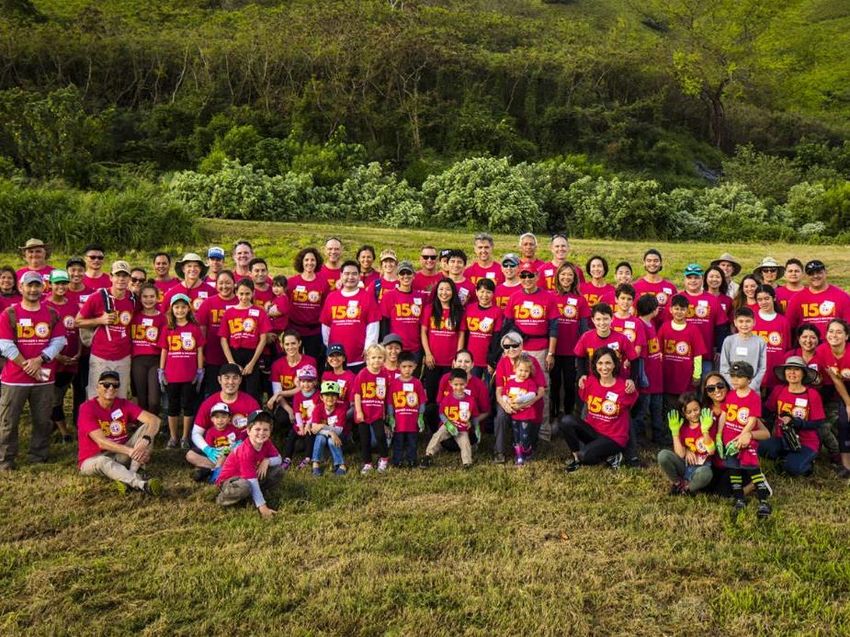
September 2021 Investor Presentation - Pivoting toGrowth
Estimated return
                              Return of 10%                                        Return of 11%
                                                                                                                             of 9% on
                              on repositioning                                     on repositioning
                                                                                                                             repositioning
                              capital spent and                                    capital spent and
                                                                                                                             capital spend and
                              current occupancy                                    current occupancy
                                                                                                                             current occupancy
                              of 99.1%.                                            of 100%.
                                                                                                                             of 94.0%.

                                                                                                       A I K A H I PA R K S H O P P I N G
               PEARL HIGHLANDS                                                                                     CENTER
                                                                       LAU HALA SHOPS
                      CENTER                                                                             Reversion of Ground Lease Asset,
                                                                            Reversion of
                 Refresh of Asset and                                                                   Redevelopment of Aging Asset and
                                                                         Ground Lease Asset
                   Effective Leasing                                                                              GLA Expansion

IRREPLACEABLE ASSETS WITH EMBEDDED GROWTH UPSIDE
E X P E R T I S E       I N    U N L O C K I N G   V A L U E - A D D    O P P O R T U N I T I E S

 Partners for Hawai’i                                                                                        Alexander & Baldwin I NYSE: ALEX   5
September 2021 Investor Presentation - Pivoting toGrowth
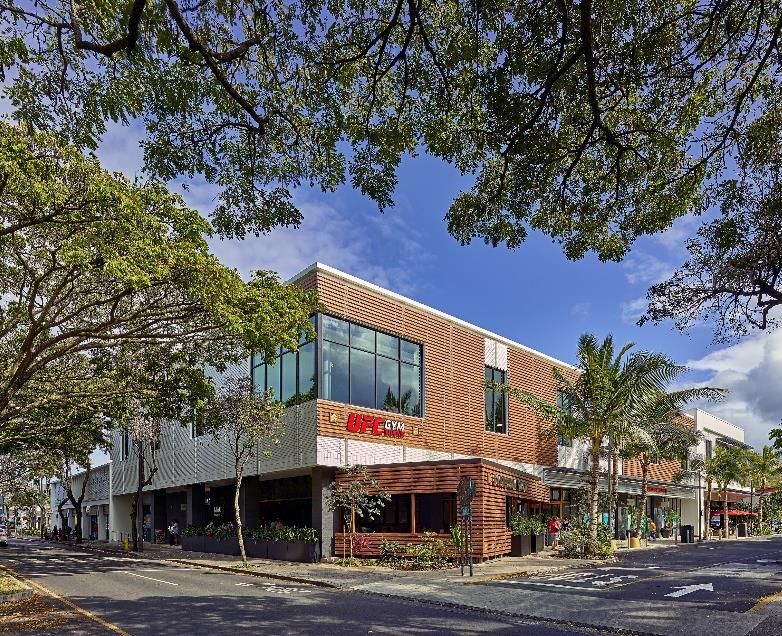
High Retail and Industrial Performance
                                                                                  Due to Market Factors

                                                                                            Fundamentals Drive
                                                                                                  Performance
                                                                                                                                           $32.59                   vs        $20.29
         D Y N A M I C M A R K E T W I T H S U B S TA N T I A L                                                                            A&B Q2 2021                        Q2 2021 Peer*
         BARRIERS TO ENTRY                                                                                                                 Retail ABR PSF                        Average
                                                                                                                                                                              Retail ABR PSF

         HAWAI‘I MARKET:                                                                                                                   $14.98
                                                                                                                                           A&B Q2 2021
                                                                                                                                                                    vs             $8.48
                                                                                                                                                                              Q2 2021 Peer*

         SUPERIOR LONG - T ERM                                                                                                           Industrial ABR PSF                      Average
                                                                                                                                                                            Industrial ABR PSF

         FUNDAMENTALS                                                             Source: Green Street Advisors and
                                                                                  Company disclosures; comparative
                                                                                  data set represents strip retail and industrial
                                                                                                                                           $797                                +6%
                                                                                  REITs under Green Street coverage.
                                                                                                                                    A&B Full-Year 2020 Average    Increase Over Prior Year
                                                                                                                                     Traditional Grocer Sales Average Traditional Grocer Sales

  Strong Consumer Demand Due to                                                   Supply Constraints Due to
  Favorable Market Metrics                                                        Long Entitlement Process
  5-Year Hawai‘i Forecasts                                                           Lengthy &
(Growth Rates Annualized;              2.8%                         3.0%               Complex                              3-5                       3-5                               3-5
            Rankings 1-50                                                           Entitlement
        with 1 being best)             JOB GROWTH                 INCOME GROWTH         Process                          YEARS FOR               YEAR FOR STATE               YEARS FOR COUNTY
                                                                                                                          COUNTY                LAND USE URBAN                  URBAN ZONING
                                                                                                                       GENERAL PLAN               DESIGNATION
                                          #3                          #4                                                INCLUSION

                                          RANK IN                  RANK IN

   Source: Green Street Advisors.
                                    JOB GROWTH OUT OF
                                            50
                                                              INCOME GROWTH OUT
                                                                     OF 50                                                                 9 to 15 years
      Partners for Hawai‘i                                                                                                                      Alexander & Baldwin I NYSE: ALEX    6
September 2021 Investor Presentation - Pivoting toGrowth
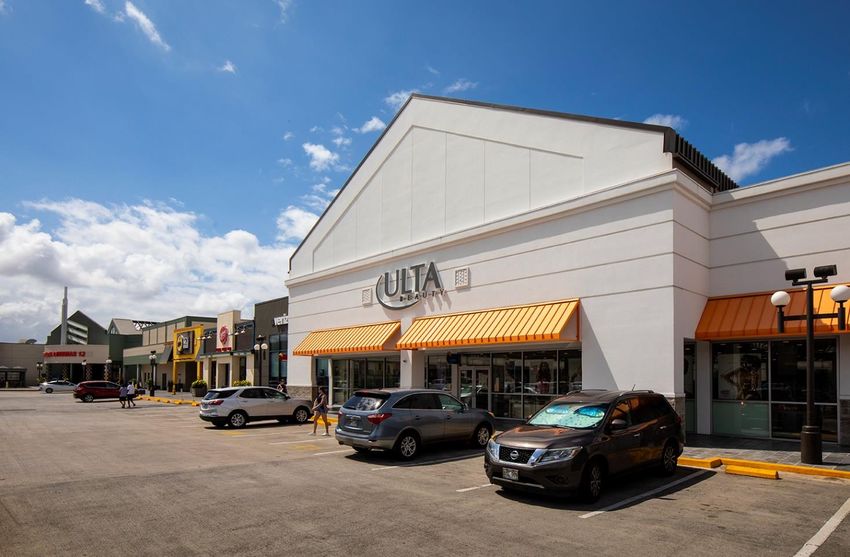
IDENTIFIED ASSET VALUE
                                                                                                                            At June 30, 2021
                                                                                                                                                                               Internal capital sources
                                                                                                                                                                                 to fuel CRE growth
                                                                                                                                        Land Ops.
  FA C I L I TAT E S P I V OT B A C K T O                                                                                               $236.9M
  CRE INVESTMENTS
                                                                76%                                                                               Materials &
                                                                                                                                                  Construction
                                                                                                                                                                                      24%
  SIMPLIFICATIO N                                           CRE-Identified
                                                             Assets Value                              CRE              $2.0B
                                                                                                                                                   $202.1M
                                                                                                                                                     Other $25.5M
                                                                                                                                                                                     Non-CRE
                                                                                                                                                                                    Assets Value
                                                                                                    $1,491.5M
  NEARING                                                22                   10
                                                                                                                          Asset Value
                                                                                                                                                                           • Land Operations

  CO MPLETIO N                                          Retail
                                                      Properties
                                                                           Industrial
                                                                           Properties
                                                                                                                                                                           • 25,900-acre land portfolio

                                                                                                                                                                           • Development-for-sale
  Well-positioned for continued simplification.
  Expect to achieve vision of becoming a pure-play       4                   50+                                                                                             portfolio

  Hawai‘i commercial real estate company in near        Office          Ground Leases                                                                                      • Materials & Construction
  term.                                               Properties         on 149 Acres                                                                                        businesses

  Steady monetization of non-core assets to date         HAWAI‘I NOI
  and strong prospects for continued simplification
  in 2021 have strengthened balance sheet and                                   2020                                          $94.3M
  enabled a renewed focus on CRE growth.                                                                                                                                                        Nearly
                                                                                                                                                                                               Fourfold
                                                              2019 (Pre-COVID)                                                    $104.2M
                                                                                                                                                                                              Hawai‘i NOI
                                                                                                                                                                                               Increase
                                                                                2012            $26.7M                                                                                        Since 2012

                                                                                         0                20                40              60                 80               100               120
                                                                                                                                       $ in Millions
Partners for Hawai‘i
             Hawai’i                                                                                                                                           Alexander & Baldwin I NYSE: ALEX   7
                                                        Note: See appendix for a statement on management’s use of non-GAAP financial measures and reconciliations.
September 2021 Investor Presentation - Pivoting toGrowth
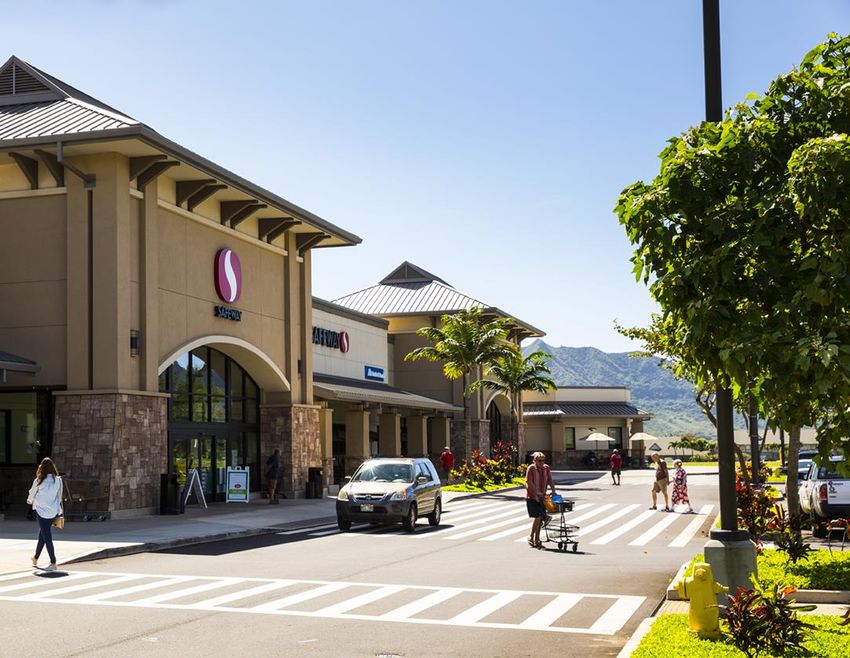
M U LT I - P R O N G E D A P P R O A C H              ACTIVE INVESTMENTS TEAM                                            P O T E N T I A L U T I L I Z AT I O N
                                                          New acquisitions expected in 2021                                  OP Units to facilitate tax-advantaged transactions

    GROW CRE                                              150-YEAR HISTORY
                                                          Successfully operating in high-performing, high barrier
                                                                                                                             DEEP EXPERTISE
                                                                                                                             In development and redevelopment
                                                          to entry Hawai‘i market
    PORTFOLIO                                             HAWAI‘I “SHARPSHOOTER”                                             GROW CRE PORTFOLIO
    THROUGH EXISTING GROUND LEASE, REDEVELOPMENT
                                                          Deep market knowledge providing superior                           Internal options through existing entitled land,
    AND ENTITLED LAND OPPORTUNITIES
                                                          sourcing advantages, including off-market and                      ground lease and redevelopment opportunities
                                                          first look opportunities

Vast growth opportunities in preferred asset types
                                                          Grocery or drugstore                   INDUSTRIAL ASSET
   A N C H O R E D R E TA I L A S S E T
    OWNERSHIP IN HAWAI‘I                             15   anchored assets                      OWNERSHIP IN HAWAI‘I                               10         Industrial assets

                                                                                                                    2%
                                               2.2M       Sq. Ft. of GLA                                                                   1.2M              Sq. Ft. of GLA
                               22%
                                               92.3%      Occupancy                                                                      97.8%               Occupancy

                                                          Of Total Improved                                     98%                                          Of Total Improved
                         78%
                                                62%       Property NOI in 2020                                                               23%             Property NOI in 2020

                                                          Sq. Ft. of GLA                                                                                     Sq. Ft. of GLA
                         A&B   Other
                                               ~10M       Total Market                                     A&B       Other                ~60M               Total Market
  Partners for Hawai‘i
               Hawai’i                                                                                                                     Alexander & Baldwin I NYSE: ALEX   8
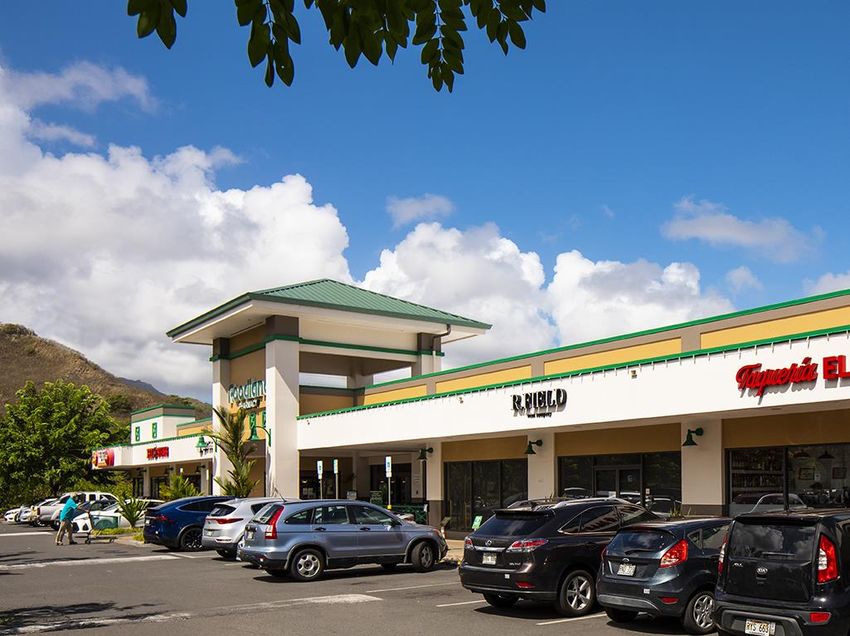
September 2021 Investor Presentation - Pivoting toGrowth
$20 M
                                                                       Improved Debt Characteristics

                                                                       • Weighted-average interest rate
  STRO NG                                                              • Weighted-average maturity
                                                                                                                                                  $443M
  BALANCE SHEET                                                           EFFECTIVE                             PRIOR
  FULL RANGE OF FINANCIAL TOOLS
  AND AMPLE LIQUIDITY TO SUPPORT                                          9/1/2021                            6/30/2021                              $423 M
  A C C E L E R AT E D C R E G R O W T H
                                                                          $0.813.64%
                                                                                 to $0.87                        $0.69 to $0.77
                                                                                                                     4.15%                TOTAL LIQUIDITY I 442.8M
                                                                             7%
                                                                              4.3toyears
                                                                                    10%                             1% to
                                                                                                                    4.0   4%
                                                                                                                        years                              CASH I $19.9M
                                                                                                                                    UNDRAWN REVOLVER I $422.9M

   To improve our financial tools as we focus on growth of our portfolio:
                                                                                                                                  After completing recast of credit facility,
                                                                                                                                  no material debt maturities until 2024
   •       Completed a recast of our credit facility, which includes favorable changes to all unsecured
           debt covenants
   •       Completed note purchase agreement amendments to our Prudential Private Placement and
           AIG notes to conform covenants with bank credit facility
   •       Established an At-the-Market equity issuance program, though no imminent issuance is                                   As of June 30, 2021, Net Debt to TTM
           anticipated                                                                                                            Consolidated Adjusted EBITDA was 5.4x,
              −        Combined with existing share repurchase authorization, provides us robust capital market tools as we       down from 6.4x last quarter and from
                       complete our simplification efforts and pivot to growth                                                    7.1x one year ago
Partners for Hawai‘i                                                                                                                       Alexander & Baldwin I NYSE: ALEX   9
September 2021 Investor Presentation - Pivoting toGrowth
IMPROVING HAWAI‘I’S COMMUNITIES AND CREATING VALUE FOR STAKEHOLDERS AS PARTNERS FOR HAWAI‘I

 COMMITMENT
 TO CO RPO RATE                                               ENVIRONMENTAL                    SOCIAL                                   GOVERNANCE

                                                              • Lau Hala Shops                 • Supported 230 local                    • Increased Board
 RESPO NSIBILITY                                                redevelopment in
                                                                Kailua won two awards,
                                                                                                 organizations and non-
                                                                                                 profits during 2020
                                                                                                                                          independence, and
                                                                                                                                          enhanced gender and
                                                                including prestigious                                                     ethnic diversity
 Proactive ESG agenda implemented over past several
                                                                national gold award            • Recognized by Nareit as
 years, consistent with Company’s DNA and local
                                                                from ICSC                        Silver Award winner for                • Board refresh adds new
 commitment                                                                                      Diversity, Equity and                    perspectives and keeps
                                                                                                 Inclusion                                the CEO and Chairman
 Published second Corporate Responsibility Report                                                                                         roles separate
 with enhanced GHG and SASB disclosures                                                        • Recognized by Pacific
                                                                                                 Business News as
 2020 Nareit Diversity, Equity & Inclusion (DEI)                                                 Corporate Award winner
 Silver Award Winner; other local and national awards                                            at Business of Pride
 for ESG efforts                                                                                 Awards

                                                              RECENT ESG
                                                              RECOGNITIONS
                       LINK TO VIDEO

Partners for Hawai‘i                                                                                                       Alexander & Baldwin I NYSE: ALEX   10
Number of Properties                                                                        86+
                               Retail (“Needs-Based”)                                                                     22
                               Industrial                                                                                 10
                               Ground Lease                                                                              50+
                               Office                                                                                      4
                             Total GLA (Sq. Ft.)1                                                                  3.9 M
                               Retail                                                                               2.5M
                               Industrial                                                                           1.2M
                               Office                                                                               0.1M
                               Ground Leases                                                                   149 acres
       Alexander & Baldwin   Portfolio Leased Occupancy %                                                           94.0%
       BUSINESS OVERVIEW*    Portfolio Economic Occupancy %                                                         92.2%
                             Total Portfolio Rent Spread                                                            11.5%
                               Total portfolio rent spread for trailing four quarters                                7.2%
                             Annualized Base Rent (ABR) Per Sq. Ft.                                                 $26.66
                               Retail                                                                               $32.59
                               Industrial                                                                           $14.98
                               Office                                                                               $32.78
                             % of Retail ABR from Anchored Properties
                                                                                                                         89%
                             (Grocery/Pharmacy/Warehouse Club)
                             Equity Market Cap                                                                      $1.3B
                             Net Debt to TTM Consolidated Adjusted EBITDA                                                5.4x
                             Total Liquidity                                                                    $442.8M
                             *As of June 30, 2021
                             1: Due to rounding, Total GLA does not foot to portfolio segments.

             Hawai’i
Partners for Hawai‘i                                                             Alexander & Baldwin I NYSE: ALEX   11
CRE PORTFOLIO CONTINUES TO
                       PERFORM VERY WELL
                       Improved tenant performance as Hawai‘i’s economy recovers, with NOI
                       up nearly 13% over prior quarter and up nearly 29% year-over-year

                       STRONG DEMAND PERSISTS FOR
                       NON-CORE ASSETS
                       Surge in demand for Hawai‘i real estate has supported monetization
                       efforts of non-core assets

                       W I T H I N TA R G E T E D
                       LEVERAGE RANGE,
                       AT 5 . 4 T I M E S E B I T D A
                       Shrinks non-CRE asset base and supports pivot back to growth

 Q2 2021 HIGHLIGHTS:   via acquisitions

                       S E C O N D C O N S E C U T I V E Q U A R T E R LY
 STRONG PERFORMANCE    DIVIDEND INCREASE

 CONTINUES             Dividend is just a penny below pre-COVID levels at $0.18 per share
                       following 2-cent, or 12.5%, increase

Partners for Hawai‘i                                         Alexander & Baldwin I NYSE: ALEX   12
REVISED
                           GUIDANCE
                The Company increased its annual 2021 guidance        ORGANIC SAME-STORE GROWTH
                                                                      Significant contractual rent step-ups across Same-Store portfolio, including
                           to reflect its improved outlook            $1+ million in ground lease growth

                                                                      I N C R E M E N TA L G R O W T H F R O M D E V E L O P M E N T
   • Core FFO per diluted share                                       AND REDEVELOPMENT
                                                                      New economic occupancy at Ho‘okele Shopping Center and Aikahi Park
   • CRE Same-Store NOI                                               Shopping Center: high-six-figure incremental NOI in 2021 and additional
                                                                      upside beyond this year

                                                                      COLLECTIONS
                   REVISED                             PRIOR
                                                                      AND BAD DEBT RESERVES
                                                                      Cash recoveries related to reserves established in 2020 may continue to
                   $0.81 to $0.87                    $0.69 to $0.77
                                                                      provide an upside opportunity in 2021
                       7% to 10%                        1% to 4%

                                                                      Note: See appendix for a statement on management’s use of
                                                                      non-GAAP financial measures and reconciliations.

Partners for Hawai‘i                                                                                                     Alexander & Baldwin I NYSE: ALEX   13
COMMERCIAL
                       R EA L ESTAT E

Partners for Hawai’i                    Alexander & Baldwin I NYSE: ALEX   14
A B R E X P O S U R E BY C AT E G O R Y A S O F Q 2 2 0 2 1

  PORTFOLIO                                                     Strategically diversified portfolio of primarily
                                                                grocery-anchored, community-based retail and
  CO MPO SITIO N O F                                            services well positioned for an evolving market
                                                                a s p e o p l e ’s l i v e s i n c r e a s i n g l y a r e c e n t e r e d
  IRREPLACEABLE ASSETS                                          around their neighborhoods.

                            Portfolio Composition                                             ABR Exposure by Category
                                  % of ABR
                                                                       Ground/Industrial/Office        Essential Retail                Non- Essential Retail

                                                                 18%
                                                                 16%
                         Non-Essential
                                                                 14%
                            Retail
                                                                 12%
                             19%                                 10%
                                             Essential            8%
                                         Retail/Restaurants       6%
                       Ground Leases,                             4%
                        Industrial and
                                              48%                 2%
                            Office                                0%

                           33%

Partners for Hawai‘i
             Hawai’i                                                                                         Alexander
                                                                                                         Alexander     & Baldwin
                                                                                                                   & Baldwin     I NYSE:ALEX
                                                                                                                              I NYSE:    ALEX   15
ABR BY ANCHORED PROPERTY TYPE

  HIGH - QUALITY AS S ETS
                       Total Portfolio ABR by Anchored Property Type                           Retail ABR by Anchored Property Type

                                           Office
                                            4%
                                                                                                    Strip Retail
                             Industrial                                                                 11%
                                16%

                                                              Grocer/                       Warehouse
                                                             Pharmacy                         Club
                                                               43%1                           22%
                        Ground
                         16%                                                                                        Grocer/Pharmacy
                                                                                                                          67%

                           Strip Retail
                               7%         Warehouse
                                            Club
                                            14%

                                                         1: Includes Shadow-Anchored
                                                                                       89% of Retail ABR is derived from centers anchored
                                                                                          by Grocery, Pharmacy or Warehouse Clubs

Partners for Hawai’i                                                                                                 Alexander & Baldwin I NYSE: ALEX   16
HIGH - QUALITY TENANTS
                                                    Top Ten Tenants
           Tenant1                      # of Leases                 ABR                   Status2               Category

                                               7                   $7,425                  Paying
                                                                                                                Grocery –
                                                                                                                National
                                                                                                                                                         Low Exposure to Green Street
                                               1                   $3,308                  Paying
                                                                                                              Warehouse –                                “National Watchlist” Tenants
                                                                                                               National
                                                                                                               Drugstore –
                                               6                   $2,752                  Paying
                                                                                                                National
                                                                                                                 Fitness –
                                                                                                                                              Strip Center REITs - Watchlist & Bankruptcy Tenants
                                               1                   $2,640                  Paying
                                                                                                                 National                                (Estimated % of Pro-Rata Rent)
                                                                                                                                 9%
                                               7                   $2,045                  Paying            Grocery – Local
                                                                                                                                 8%
                                                                                                                Discount –
                                               2                   $1,992                  Paying                                7%
                                                                                                                 National
                                                                                                                                 6%
                                                                                                                Moving –
                                               2                   $1,889                  Paying                                5%
                                                                                                                National
                                                                                                                                 4%
                                                                                                              Materials &
                                                                                                                                 3%
                                               1                   $1,636                  Paying            Construction –
                                                                                                                 Local           2%
                                                                                                                 Beauty –        1%
                                               3                   $1,508                  Paying
                                                                                                                 National
                                                                                                                                 0%
                                               3                   $1,358                  Paying            Pet – National               SITC RPAI KIM                  UE       BRX       AKR          WRI    FRT ROIC REG ALEX
                                                                                                                                                                          BK Tenants        Watchlist Tenants
Total                                         33                  $26,553
1: Excludes ground leases. The leased premises in the GP/RM Prestress, LLC lease is yard space and therefore, not included in   Source: Green Street Advisors Strip Center Sector Report, August 2020.
GLA.
2: Current status as of June 30, 2021.
   Partners for Hawai’i                                                                                                                                                                          Alexander
                                                                                                                                                                                             Alexander     & Baldwin
                                                                                                                                                                                                       & Baldwin     I NYSE:ALEX
                                                                                                                                                                                                                  I NYSE:    ALEX   17
2020

                                                                             KAIMUKI
      SECURE, WITH UPSIDE                                                    SHOPPING CENTER
                                                                             Kaimuki Shopping Center ground
     GROUND LEASES                                                           lease FMV reset resulted in a 29%
                                                                             ABR increase with additional
                                                                             contract steps in years 3 and 7.

     1         Tenant leases land and operates property for
               lease term                                                    2021

               A&B collects ground rent, including FMV and                   HART
     2         contractual escalations and/or percentage rent                Honolulu County ground lease
               during the lease term                                         contractual step-up resulted in a
                                                                             37% ABR increase.
     3         Building and other tenant improvements revert
               to A&B upon expiration or tenant default

BENEFITS        • Ground lease payment is senior to all other financial      FUTURE OPPORTUNITY
                  obligations
                                                                             WINDWARD CITY
                • Costs of ownership are passed to tenant; minimal           SHOPPING CENTER
                  landlord ownership and operating expenses                  Windward City Shopping Center
                • No capital expenditure or tenant improvement costs         ground lease FMV reset upcoming
                                                                             in 2023, with similar recent FMV
                • Minimal property management required                       resets resulting in 30% to 70%
                • Significant value creation upside at lease reversion and   ABR increases.
                  FMV reset
   Partners for Hawai’i                                                                                          Alexander & Baldwin I NYSE: ALEX   18
GROWTH FRO M VALUE -
  ADD REDEVELO PMENT
  EXISTING ASSETS WITH OPPORTUNITIES TO
  D E P L OY C A P I TA L AT AT T R A C T I V E R E T U R N S

   AIKAHI PARK SHOPPING CENTER
   •        $18.8 million redevelopment at 98,000-sq. ft. center in Kailua remains on budget
   •        Substantial completion of central shops
                                                                                               After closing the recast credit facility,
   •        Safeway’s exterior fully renovated                                                 no material debt maturities until 2024
   •        Starbucks grand opening was in May
   •        Expected to generate incremental NOI in 2021 and additional upside upon
            completion

                                                                                               As of June 30, 2021, Net Debt to TTM
                                                                                               Consolidated Adjusted EBITDA was
           8.2% to 9%                     $1.7M                                                5.4x, down from 6.4x last quarter and
           RETURN ON OVERALL COSTS        ANTICIPATED
                                          INCREMENTAL ANNUAL                                   from 7.1x one year ago
                                          NOI UPLIFT
Partners for Hawai‘i                                                                                    Alexander
                                                                                                    Alexander     & Baldwin
                                                                                                              & Baldwin     I NYSE:ALEX
                                                                                                                         I NYSE:    ALEX   19
C O M P E T I T I V E        A D V A N T A G E        A T    M A U I   B U S I N E S S   P A R K   I I

  GROUND - UP DEVELO PMENT O F
  CO MMERCIAL ASSETS
                                                    M AU I B U S I N E S S PA R K I I
                                                                                                             R E TA I L
                                                                                                             Ho’okele Shopping Center

                                                                                                             • Phase one development of
                                                                                                               71,400-sq. ft. center complete
                                                                                                             • Safeway grocery store, gas
                                                                                                               station, and convenience store
                                                                                                               anchor property
                                                                                                             • Strong phase one leasing
                                                                                                               activity continues
                                                                                                             • Expected stabilized yield of
                                                                                                               approximately 8%

                                                                                                             INDUSTRIAL

                                                                                                             Highly desirable commercial and
                                                                                                             light industrial development
                                                                                                             given proximity to Kahului
           • 60.3 acres remaining of light industrial lots in Kahului, Maui                                  Airport, Kahului Harbor and main
                                                                                                             Maui roadways
           • Flexible zoning for light industrial, retail and office use

           • Strategically developing and offering build-to-suit lease arrangements for tenants,
             while monetizing select parcels to owner-users
Partners  forHawai‘i
Partners for  Hawai‘i                                                                                                                               Alexander
                                                                                                                                                Alexander     & Baldwin
                                                                                                                                                          & Baldwin     I NYSE:ALEX
                                                                                                                                                                     I NYSE:    ALEX   20
GROWTH VEHICLES                                                                              CRE GROWTH
                                                                                               VIA ACQUISITIONS
  CRE PO RTFO LIO                                                                              Focused on growth via acquisitions as non-core disposition process continues. Deep
                                                                                               market knowledge and long-standing relationships provide an acquisition advantage,
 INVESTMENTS                                                                                   with off-market or first look opportunities.
 VIA 1031 EXCHANGES
                                                                                               RECENT ACQUISITIONS (LATE 2018 – EARLY 2019)
 Local presence provides
 access to off-market                             $1.0B                        90%+            Ag land sale proceeds fully reinvested in A&B’s preferred asset classes of grocery-
                                                                                               anchored, industrial and ground leases; geographically balanced between Oahu and
 pipeline:                                           Invested                  First-look or
                                                    since 2013                  off-market     neighbor islands.
                                                                               acquisitions
                                                                                                   Grocery-Anchored                    Industrial                             Ground Lease
                                                                                                     Retail Assets                       Assets                                  Assets
           Actively looking to strategically grow CRE portfolio, focused on
          industrial and anchored retail assets, with ample future growth
                 opportunities for both asset classes within Hawai‘i

      Target property types
      •   Anchored & strip retail centers            •   Sale-leasebacks with creditworthy
      •   Industrial/flex warehouses                     businesses                                 Queens’ MarketPlace          Kapolei Enterprise Center          Kapolei Business Park West Lot 31
      •   Mixed-use urban with retail                •   Leased-fee interests
          components                                 •   Retail/industrial development
                                                         opportunities

      UPREIT
      Structure can provide unique diversification, liquidity and estate benefits to sellers
                                                                                                   Waipouli Town Center           Opule Street Industrial                    Home Depot Iwilei

Partners for Hawai’i                                                                                                                  Alexander &Alexander
                                                                                                                                                  Baldwin –&
                                                                                                                                                 Alexander   Baldwin
                                                                                                                                                           &Partners II NYSE:
                                                                                                                                                             Baldwin for      ALEX
                                                                                                                                                                         Hawaii
                                                                                                                                                                        NYSE: ALEX   21 21
COVID
                       U P DAT E

Partners for Hawai’i               Alexander & Baldwin I NYSE: ALEX   22
CO VID UP D AT E :
MO D E ST RE ST RICTIO NS                                                                                  Hawai‘i Epidemic Curve
                                                                                                             1/1/2021 – 9/18/2021
SUCCE SSFUL IN
CURBIN G D E LT A SURGE
IN H AWAI‘I
•     2020 Hawai‘i COVID restrictions led to best health outcomes in
      nation, but severe impact to economy
•     2021 recovery in tourism and employment has been dramatic,
      with arrivals approaching pre-pandemic levels through most of
      summer; July arrivals nearly 90% of 2019 level
•     Delta variant surge led to reinstatement of gathering
      restrictions, but no stay-at-home order or increased restrictions
      on tourism
          •      Gatherings limited to no more than 10 people indoors
                 and 25 outdoors
          •      50% capacity rules for restaurants and gyms and 6 ft
                 distancing still in effect
•     Governor’s suggestion that visitors stay away has had modest
      impact on arrivals
•     COVID case counts have dropped in September as gathering
      limits seem to be working                                           Source: COVID-19 State of Hawai‘i Portal, Data as of 9/20/2021.

Partnersfor
Partners forHawai‘i
             Hawai‘i                                                                                                                        Alexander & Baldwin I NYSE: ALEX   23
CRE RECOVERY
                                  CRE NOI Grew 13% Over Prior Quarter                                                                                      CRE NOI Growth
                              As Cash Collections Continue to Trend Upward                                                                       As Covid-Related NOI Charges Decline
           30                                                                          44                                      $29.5                                                                                 $7.5

                                                                                                                                                                                                                            Covid-Related NOI Charges, Net ($M)
                                                                                       42                                      $28.5                                                                                 $6.5
           28

                                                                                            Cash Collections ($M)
                                                                                                                               $27.5
                                                                                       40                                                                                                                            $5.5

           26                                                                                                                  $26.5
NOI ($M)

                                                                                                                    NOI ($M)
                                                                                       38                                                                                                                            $4.5
                                                                                                                               $25.5
                                                                                       36                                                                                                                            $3.5
           24                                                                                                                  $24.5
                                                                                       34                                                                                                                            $2.5
                                                                                                                               $23.5
           22
                                                                                       32                                      $22.5                                                                                 $1.5

           20                                                                          30                                      $21.5                                                                                 $0.5
                     Q2 2020         Q3 2020         Q4 2020       Q1 2021   Q2 2021                                                   Q2 2020       Q3 2020       Q4 2020         Q1 2021              Q2 2021

                                               NOI        Collections                                                                              NOI         Covid-Related NOI Charges (Net)

            Partners  forHawai‘i
            Partners for  Hawai‘i                                                                                                                                            Alexander & Baldwin I NYSE: ALEX   24
Q2 2021

  CRE BAD DEBT RES ERVE
     • $14.3 million total reserve as of the end of Q2 2021
     • Resort retail responsible for about one-fifth of reserve, despite being just 4% of portfolio

                                     Office Ground Leases
                        Industrial    1%         1%
                           10%
                                                                                                                        Resort
                                                                                                                        Retail
                                               Resort Retail                                              Ground Leases  4%
                                                  19%                                                         16%

                                                                                                Office
                                                                                                 4%

                                     Q2 2021                                                                     Q2 2021         Retail
                                                                                                                                  Non-
                                 Bad Debt Reserve                                            Industrial
                                                                                                               ABR - Portfolio   Resort
                                                                                                16%                               60%

                                        Retail Non-Resort
                                               69%

Partners for Hawai’i                                                                                                             Alexander & Baldwin I NYSE: ALEX   25
MOVING FORWARD

           OUR
           ACTIONS

  Business             Advocacy                   Communication            Operations           Tenant Assistance                        Cost Control
  Continuity
  Fully operational    Continued                  Business resources and   Increased safety     Marketing and operational                Continued strategic
  workforce with       collaboration with local   reopening information    measures and         support, and guidance in                 expense and capital
  phased return to     and national               provided to ensure       signage to welcome   accessing government relief              spending reductions
  office starting in   organizations to           tenants are well         more visitors and    resources                                to partially offset
  March                advocate for further       informed                 successful BOPIS                                              cash flow impact
                                                                                                Organized with local partners to
                       reopening the island                                program in place
                                                                                                provide food boxes to our
                       economy                                                                  impacted tenants and their
                                                                                                employees

                                                                                                Proactively provided deferrals
                                                                                                to highest-risk tenants and
                                                                                                addressed rent relief requests
                                                                                                on a case-by-case basis to
Partners for Hawai‘i                                                                            protect long-term health and     Alexander & Baldwin I NYSE: ALEX   26
                                                                                                cash flows of tenants
CASE STUDY

           SUPPORTING
           OUR TENANTS
           A&B created a free Seek & Treat Scavenger Hunt for kids and
           families to have physically-distanced fun, while driving foot       “Fantastic idea, well executed and such a home run for Merchant’s Row.
           traffic to tenants across our shopping centers in Kailua Town.      We got so many customers that didn’t know about our store, or even how Hekili Street has
                                                                               changed over the years. We’ve already had return customers that discovered us from the
                                                                               seek & treat!” ― Kailua Town Tenant

                  Media coverage through a             Additional online and            Over 1,200 kids and                           Center’s website saw
                  local news station and               social media push                their families joined                         a 157% increase in
                  community newspaper                  created buzz                     the scavenger hunt,                           website views
                                                                                        creating additional                           compared to the
                                                                                        shopping and dining                           annual Halloween
                                                                                        traffic                                       event the prior year

Partners for Hawai‘i                                                                                                           Alexander & Baldwin I NYSE: ALEX   27
COMMITMENT TO
                         CO R P O R AT E
                       RESPONSIBILITY

Partners for Hawai’i                       Alexander & Baldwin I NYSE: ALEX   28
SUPPO RTING
 O UR
 COMMUNITIES
 A&B allocated 20% of its annual giving budget in 2020
 to support non-profits on the frontline of COVID-19
 relief and to provide stability to those most affected by
 the impacts of this pandemic in key communities,
 working with trusted long-term non-profit partners.

Partners for Hawai‘i                                         Alexander & Baldwin I NYSE: ALEX   29
ALIGNED WITH COMMITMENT TO PRINCIPLES OF ESG

 BOARD OF
 DIREC TO RS UPDATE

  BOA RD O F DI RECTO RS ME T RI CS
                                                    2016                        Now

    CHAIR                                    Non-Independent                 Independent

    INDEPENDENT (NYSE)                              70%*                        86%
                                                                                                 Eric Yeaman                   Doug Pasquale                                   John Leong
                                                                                             Independent Director        Lead Independent Director                        Independent Director
    FEMALE                                           20%                        29%
                                                                                                  Since 2012                     Since 2018                               Since October 1, 2020
    CURRENT/FORMER                                                                         Chairman of the Board since                                              Highly respected young leader
                                                      3                          1
    A&B CEO                                                                                     October 1, 2020                                                               in Hawai‘i

    ETHNICALLY DIVERSE                               50%                        43%                                                                                 Brings valuable environmental
                                                                                                                                                                     and non-profit perspectives
    REIT EXPERTISE                                   10%                        43%
   *Includes a former CEO who was deemed independent under NYSE standards.

Partners for Hawai‘i                                                                                                                                 Alexander & Baldwin I NYSE: ALEX   30
SUPERIOR
                       M A R K E T F U N D A M E N TA L S
                       Dynamic, Growing Market with Structural Limitations
                       on New Supply

                       HIGH-QUALITY
                       PORTFOLIO
    ADVANCING          Irreplaceable Assets with
                       Embedded Growth Opportunities
    SIMPLIFICATION,
    PIVOTING TO        S I M P L I F I C AT I O N
                       NEARING COMPLETION
                       Facilitates Pivot Back to CRE Investments
    GROWTH
                       STRONG
                       BALANCE SHEET
                       Supports Accelerated Investment Activity

                       COMMITMENT TO
                       C O R P O R AT E R E S P O N S I B I L I T Y
                       Significant Progress in ESG Initiatives in Recent Years

Partners for Hawai‘i
             Hawai’i                        Alexander & Baldwin I NYSE: ALEX   31
APPENDIX

Partners for Hawai’i              Alexander & Baldwin I NYSE: ALEX   32
CRE NET OPERAT ING INCO ME
            RECONCILIATION OF GAAP TO NON- GAAP MEASURES
            DOLLARS IN MILLIONS

                                                                                                                Three Months Ended    Three Months Ended
                                                                                                                                                           Change
                                                                                                                   June 30, 2021         June 30, 2020

             CRE Operating Profit (Loss)                                                                                   $18.6             $8.9           $9.7

                       Plus: Depreciation and amortization                                                                  9.5              10.6           (1.1)

                       Less: Straight-line lease adjustments                                                               (1.0)             1.3            (2.3)

                       Less: Favorable/(unfavorable) lease amortization                                                    (0.2)             (0.5)          0.3

                       Plus: Other (income)/expense, net                                                                   (0.1)             0.1            (0.2)

                       Plus: Selling, general, administrative and other expenses                                            1.7              1.8            (0.1)

             NOI                                                                                                           $28.5            $22.2           $6.3

                       Less: NOI from acquisitions, dispositions and other adjustments                                     (0.7)             (0.6)          (0.1)

             Same-Store NOI                                                                                                $27.8            $21.6           $6.2

            Note: Additional information is included in the Company’s quarterly Supplemental Information report, which is furnished
            to the SEC and available at www.alexanderbaldwin.com.

Partners for Hawai‘i                                                                                                                                                Alexander & Baldwin I NYSE: ALEX   33
FUNDS FROM O PERAT IO NS ( FFO)
            AND CO RE FFO
            RECONCILIATION OF NET INCOME (LOSS) AVAILABLE TO A&B COMMON SHAREHOLDERS TO FFO AND CORE FFO
            DOLLARS IN MILLIONS

                                                                                                                              Three Months Ended    Three Months Ended
                                                                                                                                 June 30, 2021         June 30, 2020
             Net income (loss) available to A&B common shareholders                                                                      $12.8            $(4.7)

                       Depreciation and amortization of commercial real estate properties                                                 9.5              10.6

                       Gain on the disposal of commercial real estate properties, net                                                       -                -

             FFO                                                                                                                         $22.3             $5.9

             Exclude items not related to core business:

                       Land Operations Operating (Profit)                                                                                (9.1)             (4.0)

                       Materials & Construction Operating (Profit) Loss                                                                   1.9              6.9

                       Loss from discontinued operations                                                                                  0.1              0.6

                       Income (loss) attributable to noncontrolling interest                                                              0.2                -

                       Income tax expense (benefit)                                                                                         -                -

                       Non-core business interest expense                                                                                 3.1              3.7

             Core FFO                                                                                                                    $18.5            $13.1

Partners for Hawai‘i      Note: Additional information is included in the Company’s quarterly Supplemental Information report, which is furnished                        Alexander & Baldwin I NYSE: ALEX   34
                          to the SEC and available at www.alexanderbaldwin.com.
CO RE FUNDS F RO M O PERAT IONS (CORE FFO)
            RECONCILIATION OF CORE FFO STARTING FROM COMMERCIAL REAL ESTATE OPERATING PROFIT
            DOLLARS IN MILLIONS

                                                                                                                        Three Months Ended    Three Months Ended
                                                                                                                           June 30, 2021         June 30, 2020
              CRE Operating Profit                                                                                                    $18.6          $8.9

                       Depreciation and amortization of commercial real estate properties                                              9.5           10.6

                       Corporate and other expense                                                                                    (6.0)          (2.3)

                       Core business interest expense                                                                                 (3.6)          (4.1)

              Core FFO                                                                                                                $18.5         $13.1

            Note: Additional information is included in the Company’s quarterly Supplemental Information report, which is furnished
            to the SEC and available at www.alexanderbaldwin.com.

Partners for Hawai‘i                                                                                                                                               Alexander & Baldwin I NYSE: ALEX   35
CO NSOLIDAT ED
            ADJUSTED EBITDA
            RECONCILIATION OF CONSOLIDATED NET INCOME TO CONSOLIDATED ADJUSTED EBITDA
            DOLLARS IN MILLIONS

                                                                                                            TTM                           TTM
                                                                                                        June 30, 2021                 June 30, 2020
             Net Income (Loss)                                                                                $27.2                      $(45.0)

                       Depreciation and amortization                                                           51.3                       54.5

                       Interest expense                                                                        28.4                       31.5

                       Income tax expense (benefit)                                                           (0.3)                       (0.9)

             Consolidated EBITDA                                                                             $106.6                       $40.1

                       Asset impairments related to the M&C segment                                              -                        55.3

             Consolidated Adjusted EBITDA                                                                    $106.6                       $95.4

            Note: Additional information is included in the Company’s quarterly Supplemental Information report, which is furnished
            to the SEC and available at www.alexanderbaldwin.com.

Partners for Hawai‘i                                                                                                                                  Alexander & Baldwin I NYSE: ALEX   36
You can also read