Management Presentation - BNP Paribas 15th High Yield and Leveraged Finance Conference
←
→
Page content transcription
If your browser does not render page correctly, please read the page content below

Management
Presentation
17TH JANUARY 2019

BNP Paribas 15th High Yield and
Leveraged Finance Conference

BNPP HIGH YIELD CONFERENCE JANUARY 2019

             Disclaimer (1/2)

This presentation is made by Selecta Group B.V. (the “Company”), and neither this presentation nor its content may be copied, distributed or otherwise made available to any other person by any recipient without the consent
of the Company. The information in this presentation is not, and should not be construed as, a prospectus, is not intended for potential investors, and does not constitute or form part of, and should not be construed as an
offer or the solicitation of an offer or a recommendation to sell, subscribe for or purchase any securities of the Company, any of its parent companies or any of its subsidiaries, in any jurisdiction and the information shall not
be used to form the basis of, or be relied on, in connection with any contract or commitment whatsoever, in particular, the information in this presentation must not be used in making any investment decision.

This presentation is for information purposes only. These materials do not constitute or form part of, and should not be construed as, any offer for sale or subscription of, or solicitation of any offer to buy or subscribe for any
securities of the Company in any jurisdiction.

Although all reasonable care has been taken to ensure the facts stated herein are accurate and that the opinions contained herein are fair and reasonable, this document is selective in nature and is intended to provide an
introduction to, and overview of, the Company’s business. No representation, warranty or undertaking, express or implied, is made as to, and no reliance should be placed on, the fairness, accuracy, completeness or
correctness of the information or the opinions contained herein. The Company, or any of its affiliates, advisors or representatives, shall have no liability whatsoever (in negligence or otherwise) for any loss howsoever arising
from any use of this presentation or its contents. Neither the Company nor any of its affiliates is under any obligation to keep current the information contained in this presentation and any opinions expressed in it are subject
to change without notice. The information contained in this presentation does not constitute investment advice.

The market and industry data and forecasts included in this presentation were obtained from internal surveys, estimates, experts and studies, where appropriate, as well as external market research, publicly available
information and industry publications. The Company and its affiliates, directors, officers, advisors and employees have not independently verified the accuracy of any such market and industry data and forecasts and make no
representations or warranties in relation thereto. Such data and forecasts are included herein for information purposes only and no reliance should be placed on, the fairness, accuracy, completeness or correctness of the
information in this presentation, the opinions expressed herein or at the presentation meeting or any other statement made or purported to be made in connection with the Company or its group, for any purpose whatsoever.
No responsibility, obligation or liability is or will be accepted by the Company or its affiliates or their respective directors, officers, employees, agents or advisers in relation to this presentation. To the fullest extent
permissible by law, such persons disclaim all and any responsibility or liability, whether arising in tort, contract or otherwise which they might otherwise have in respect of this presentation.

Third-party industry publications, studies and surveys generally state that the data contained therein have been obtained from sources believed to be reliable, but that there is no guarantee of the accuracy or completeness of
such data. While the Company believes that such publications, studies and surveys have been prepared by a reputable source, the Company has not independently verified such data. In addition, certain of the industry and
market position data referred to in the information in this presentation has come from the Company's own internal research and estimates, and their underlying methodology and assumptions may not have not been verified by
any independent source for accuracy or completeness and are subject to change without notice. Accordingly, undue reliance should not be placed on any of the industry or market position data contained in this presentation.

The information in this presentation has not been verified to the standards normally expected in connection with the preparation of a prospectus and is subject to verification, correction, completion and change without
notice. In giving the information in this presentation, none of the Company, its affiliates or their respective directors, officers, employees, agents or advisers undertake any obligation to provide the recipient with access to any
additional information or to update the information in this presentation, or to correct any inaccuracies in any such information, including any financial data or forward-looking statements. Any decision to purchase securities in
the Company, any of its parent companies or any of its subsidiaries, in any offering (if and when made) should be made solely on the basis of information contained in any prospectus or offering circular that may be published
by the Company, any of its parent companies or any of its subsidiaries, as applicable, in final form in relation to any proposed offering and which would supersede the information in this presentation in its entirety.

                                                                                                                                                                                                                                     2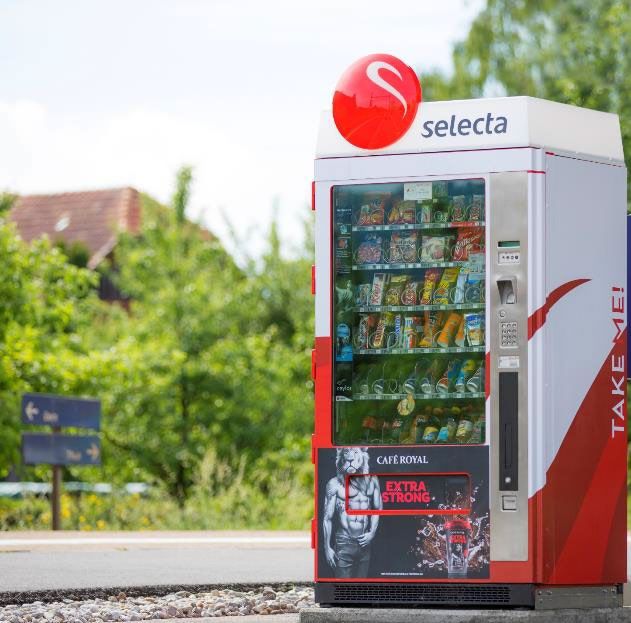
BNPP HIGH YIELD CONFERENCE JANUARY 2019

             Disclaimer (2/2)

This document includes “forward-looking statements” that involve risks, uncertainties and other factors, many of which are outside of the Company’s control and could cause actual results to differ materially from the results
discussed in the forward-looking statements. Forward-looking statements include statements concerning the Company’s plans, objectives, goals, future events, performance or other information that is not historical
information. All statements other than statements of historical fact referred to in this presentation are forward-looking statements. Forward-looking statements give the Company's or its group's current expectations and
projections relating to its financial condition, results of operations, plans, objectives, future performance and business. These statements may include, without limitation, any statements preceded by, followed by or including
words such as "target," "believe," "expect," "aim," "intend," "may," "anticipate," "estimate," "plan," "project," "will," "can have," "likely," "should," "would," "could" and other words and terms of similar meaning or the negative
thereof. Such forward-looking statements, as well as those included in any other material forming part of the Information, are subject to known and unknown risks, uncertainties and assumptions about the Company, its
present and future business strategies, trends in its operating industry and the environment in which it will operate in the future, future capital expenditure and acquisitions. In light of these risks, uncertainties and
assumptions, the events in the forward-looking statements may not occur or the Company's or its group's actual results, performance or achievements might be materially different from the expected results, performance or
achievements expressed or implied by such forward-looking statements. None of the Company, its affiliates or their respective directors, officers, employees, agents or advisers undertake to publicly update or revise forward-
looking statements to reflect subsequent events or circumstances after the date made, except as required by law.

This presentation contains financial information regarding the businesses and assets of the Company and its consolidated subsidiaries (the “Group”). Such financial information may not have been audited, reviewed or verified
by any independent accounting firm. Certain financial data included in this presentation consists of “non-IFRS financial measures” These non-IFRS financial measures, as defined by the Company, may not be comparable to
similarly titled measures as presented by other companies, nor should they be considered as an alternative to the historical financial results or other indicators of the Company’s financial position based on IFRS. Even though
the non-IFRS financial measures are used by management to assess the Company’s financial position, financial results and liquidity and these types of measures are commonly used by investors, they have important limitations
as analytical tools, and you should not consider them in isolation or as substitutes for analysis of the Company’s financial position or results of operations as reported under IFRS. The inclusion of financial information in this
presentation should not be regarded as a representation or warranty by the Company, or any of its affiliates, advisors or representatives or any other person as to the accuracy or completeness of such information’s portrayal
of the financial condition or results of operations of the Group and should not be relied upon when making an investment decision.

By attending this presentation you acknowledge that you will be solely responsible for your own assessment of the market and the market position of the Company and that you will conduct your own analysis and be solely
responsible for forming your own view of the potential future performance of the business of the Company.

The Company does not expect to register any securities that it may offer under the U.S. Securities Act of 1933, as amended (the "Securities Act") and, in such circumstances, any such securities may not be offered or sold in the
United States absent registration under the Securities Act or an available exemption from it. Any public offering of such securities in the United States would require the publication of a prospectus by the Company containing
detailed information about the Company and its management, as well as the Company's financial statements. Neither this document nor any copy of it may be taken or transmitted into Australia, Canada or Japan or to any
securities analyst or other person in any of those jurisdictions, or, directly or indirectly, into the United States, other than to QIBs within the meaning of Rule 144A under the Securities Act. In the European Economic Area (the
"EEA"), this presentation is addressed only to, and directed only at, persons in member states who are "qualified investors" within the meaning of Article 2(1)(e) of the Prospectus Directive (Directive 2003/71/EC as amended,
including by Directive 2010/73/EU, and any relevant implementing measure in each relevant member state of the EEA) ("Qualified Investors"). In addition, in the United Kingdom, this presentation is being addressed only to,
and is directed only at, Qualified Investors who are (i) persons having professional experience in matters relating to investments falling within Article 19(5) of the Financial Services and Markets Act 2000 (Financial Promotion)
Order 2005 (the "Order"), or (ii) high net worth entities falling within Article 49(2)(a) to (d) of the Order, or (iii) persons to whom it would otherwise be lawful to communicate it (all such persons together being referred to as
"Relevant Persons"). This presentation must not be acted on or relied on (i) in the United Kingdom by persons who are not Relevant Persons, and (ii) in any member state of the EEA, other than the United Kingdom, by persons
who are not Qualified Investors. Any investment or investment activity to which this presentation relates is available only to Relevant Persons in the United Kingdom and Qualified Investors in any member state of the EEA,
other than the United Kingdom, and will be engaged in only with such persons.

                                                                                                                                                                                                                                     3
BNPP HIGH YIELD CONFERENCE JANUARY 2019

The Presenters

                David Flochel                           Gabriel Pirona

                      CEO                                     CFO
         Prior professional experience:          Prior professional experience:

         Regional President of Mars Drinks       CFO of Photo-Me International plc
         North America
                                                 Business transformation and turnarounds
         General Manager of Mars Drinks Europe   at Avery Dennison and Recall
         Unilever, AB InBev and L’Oreal          Strong track record of successful M&A

         Joined Selecta in July 2016             Joined Selecta in April 2018

                                                                                                                    4
Agenda

01 – SELECTA TODAY

02 – DRIVERS FOR GROWTH

03 – FINANCIAL HIGHLIGHTS

01
Selecta Today

BNPP HIGH YIELD CONFERENCE JANUARY 2019

              Selecta Today: Leading Route Based Unattended Self-Service
01            Coffee and Convenience Food Provider in Europe
        Market leader in large and attractive market                                              Proven business model                                       Solid financial position
        #1 or #2 position in 10 core European markets – share                                     Route-based business with unique logistics                  €1.5bn of pro forma gross sales for the year.
        typically 10-15% ¹                                                                        infrastructure network and high density on the last mile    High revenue visibility with LT contracts of
                                                                                                                                                              3-10 years with best-in-class retention
        10 million consumers served daily in 16 countries                                         Inherent size and M&A program leading to further
                                                                                                  density and scale savings                                   organic growth in excess of 2% ²

     FY18 Selecta Business Model: Breakdown by Channels                                                                   Selecta’s Leading Positions in a Very Fragmented Market
             Targeted go-to-market strategy to capture demand
                                                                                                              Market share1 (%)                                              Selecta         Competition
                          across multiple channels
                                                                            Pub
                                                                            5%

                      FY18 Gross                                       Total Machine
                       Revenue:                                          Numbers:
                        €1.5bn                                           ca. 460k

                                                                                                               82          76          91        90          91        88              93          98
                                   On-the-Go          Workplace Services

     HOT DRINKS                         COLD DRINKS and SNACKS (IMPULSE)          TRADING                            18           24         9         101         9          12             7             2
                  Premium Coffee                                30%                         15%
                  and Other 55%
                                                                                                               1st         1st         1st       1st         2nd       2nd             1st          4th

                              1   Data as at end 2018, source OC&C Report
                              2   FY 2018
                                                                                                                                                                                                               7
BNPP HIGH YIELD CONFERENCE JANUARY 2019

                  Targeted Go-to-Market Strategy to Capture Market Demand across Multiple
01                Channels

                                        Private Segment                                                 On-the-Go Segment                                            Trading

                  • Improves at-work experience of captive employee base           • Enhances consumer experience at customer locations by
     Highlights

                  • Benefits employers by enhancing employee satisfaction and        providing tailored coffee and snacking offerings              Provides full suite of services to customers
                    productivity                                                   • Allows customers to further monetize high and low footfall
                  • Provides a service in places not accessible by other formats     locations

                            Vending                       Office Coffee Service                Public                          Semi Public                   Food Service and backdrop
     Locations

                          Sale of goods from          Contracts with corporates                                             Sale of goods from       Bean roasting                   Goods
 Revenue

                          machine                                                                                                     machine
  model

                                                            Sale of goods when            Sale of goods from
                                                        delivered to corporates           machine
                                                                                                                    Contracts with Universities,
                          Servicing                                                                                              Hospitals, etc.                                     3rd Party
                                                                                                                                                     Machines
                                                                      Servicing                                                                                                      servicing
     Revenue %

                          c.35%                                c.10%                       c.15%                                c.20%                           c.20%

                                                                                                                                                                                                        8
BNPP HIGH YIELD CONFERENCE JANUARY 2019

           Comprehensive Product and Service Offerings Tailored to Fit Customer and
01         Consumer Needs
                                                                                                                                                                                               Coffee / hot drinks
     Wide Variety                                                                                                                                                                              account for 55%1 of
     of Product                                                                                                                                                                                total revenues
     Offering                          Coffee/Hot drinks                         Cold drinks            Snacks                 Healthy options         Fresh food             Trading          (including coffee
                                                   50%1                                                           30%1                                                           20%1          trading)

                                                       3rd Party Private Label                             Local Specialties                                         Global Brands
     Diversified
     Portfolio of
     Attractive
     Brands

                                                          Supply / Technical                                Partial Service                                           Full Service
     Ability to Offer
                                                                                                • Provide  machine,  ingredients and
     a Range of                           • Provide machine, ingredients, consumables                                                                • Responsible for the procurement and
                                                                                                  consumables (and receives fee/rent)
     Service                                and offer technical service only (no service                                                               placement of machines, stocking/restocking of
                                            element)                                                                                                   items and ongoing maintenance
     Capabilities                                                                               • Customer responsible for cleaning and
                                                                                                  refilling machine

     Ability to Offer
     a Range of
     Service
     Capabilities                                                                                                                            Exclusive premium
                                                 Instant                  Fresh brews          Bean-to-cup / Capsules                     concepts with fresh milk                   Custom concepts

                        1   Share of revenue in FY18

                                                                                                                                                                                                                9
BNPP HIGH YIELD CONFERENCE JANUARY 2019
01 Recent Business Transformation Enabled by Focused Execution
Enhanced leadership capabilities
Culture focused on delivery of transformation milestones FY’18
Q4 2017 Q2 2018 Q4 2018
• Acquisition of Pelican Rouge • Successful Refinancing • Acquisition of Express Vending
• Kick off of integration and • Acquisition of Gruppo Argenta • 16 countries in Europe with 460,000 points of sale
synergies implementation • Integration of Spain • Renewal of Nestle Starbucks contract – On the Go
• Sale of Selecta Finland • Expansion of Micro-markets outside Italy
• Sale of Custom Pack as non core
• Launch of integration plan • Anticipated start of integration in France
• Integration of UK, Benelux, Norway • Wins “Outstanding supplier of the year” by Shell
Q1 2018 Q3 2018
AUG AWARDED VENDING MACHINE
’18 OF THE YEAR WITH THE
WURLITZER UPGRADE
FEB
Acquisition ’18
by SEP ’17 FY’17
FY’16
2015 CONTRACT RENEWED FOR FURTHER 3
YEARS
Two new
premium
partnerships AWARDED OUTSTANDING SUPPLIER OF THE
YEAR FOR FRESH FOOD AND DRINK
1002 Drivers for Growth
BNPP HIGH YIELD CONFERENCE JANUARY 2019

           Clearly Defined Strategy to Strengthen our #1 Market Leader Position in
02         Europe
           Ambition                         Values                                                                            Strategies
                                                                           Greater Customer Experience
                                                                            Drive customer acquisition by selling unique concepts, opening new routes and standardizing sales processes,
                                            Customer                 01     maximize customer base value through high retention, profitability and satisfaction
        Guided by our                        Focus
          Guided by our
            Vision
         Vision    &
                & Mission                                                  Delighted Consumers
             Mission                                                        Offer the widest range of quality coffee brands, convenience food & beverages concepts, flexible payments,
                                                                     02     loyalty programs & leveraging data to improve offering
                                           Teamwork
                                           & Winning                       Powered by Great People
                                            Attitude
       Accelerate our market                                         03    Attract talent and retain capable organization, in line with core values, for the growth and transformation
                                                                           of the company
     leadership in Europe with
         our customers and                                                 Route Based Excellence to the Last Mile
        consumers in mind
                                                                           Deliver high quality service at highest efficiency through continuous improvement, standardization, life cycle
                                            Integrity
                                                                     04    management and technology in order to maximize customer satisfaction

                                                                           Natural Market Consolidator
                                                                            Integrate other players into our group in order to increase the density of our route-based network to further
        Being number 1 or 2
      in top markets in which
                                           Excellence                05     enhance operating efficiencies and synergies
                                               In
            we operate                     Execution
                                                                           Innovation Leadership
                                                                            Set industry standard for innovation, leveraging the latest technologies to enhance our offering in Self-Service
                                                                     06     Retail and beyond

 Vision: Selecta as the European leader in unattended self-serve coffee and convenience food, at the workplace and on-the-go
 Mission: Selecta is dedicated to providing great quality coffee brands, convenience food & beverages concepts and convenient concepts in food and beverages.

                                                                                                                                                                                           12
BNPP HIGH YIELD CONFERENCE JANUARY 2019
02 Leading Market Positions and Scale Drive Superior Returns
Sales1 Long-lasting relationships
Long-lasting relationships with
with strategic
strategic customers
customers
c.3.5x • Partner of choice for travel retailers • Leading solution provider in the
and convenience retailers Workplace environment with large
international companies
#2 player
Installed Machine Park2 Using technology for best-in-class consumer experience
c.2.5x • Scale provides the ability to invest in latest technologies
and roll them out
• Unique, modern tech development (e.g. touchscreen user
interface and introduction of cashless payment systems and
telemetry) VENDING MACHINE OF
THE YEAR FOR THE
• Building a network of connected machines that enable WURLITZER UPGRADE
#2 player quick response and increased efficiencies
Geographical Presence
Scale to drive operation efficiency,
#2 player margin expansion, and superior returns
• Negotiate best procurement arrangements
16 countries 4 countries • Highest density yields superior efficiency and savings
• Largest machine buyer in Europe, resulting in more efficient capex spend and being
the partner of choice for machine manufacturers
• Payback periodBNPP HIGH YIELD CONFERENCE JANUARY 2019
Scale and Technology Driven Business Model Drive Competitive Advantage
02 and Efficiency in Operations
Our Route Based Business Model Distinct Market Position
• Granularity of format allows customization of offering to local needs
(segment, individual customer)
~4 500 Leading Route Density on The Last Mile
DYNAMIC PLANNING Route Merchandisers
• Selecta’s route-based operation represents a distinct competitive
Stock Machines Real-time
to to sales data,
advantage on the last mile and beyond
pick Service alarms
• Leading density creates high entry barriers, and provides attractive unit
~1 500
economics for growth and bolt-on acquisitions
Route Technicians
Telemetry
Operational Capabilities - “Toyota Model”
Restocking, maintenance, • Recognized for its unique abilities to operate in complex environments
>5 000
cleaning services (e.g. petrol, public transport networks)
Vehicles
• Ongoing introduction of telemetry (IoT) enables revolutionary
Customer Sites transformation of “Push” into “Pull” model (a.k.a. Toyota Model)
Centralized planning
and tech support
~150 Planners
Consumer High density
14BNPP HIGH YIELD CONFERENCE JANUARY 2019
02 Focused Drivers of Organic Growth
Improving Retention New Business Pipeline Acceleration (€m)
Under Negotiation Agreed Contract Signed
(% retention rate)
158.9
94.4%1 129.1
119.5 33.3
93.6%1,3 26.3 30.0
45.5 22.6
92.5%1,2 13.5
80.2 95.6
60.5
FY17 H1’18 H2’18 Dec ‘17 Sep ‘18 Dec ‘18
• 100% retention of top 10 customers4
• Steady acceleration of activity in the pipeline: +33%
• H2’18 progression on H1 driven by Dec’18 vs. Dec’17
• Turnaround in the UK (+2pts)
• Investment in sales capability e.g. in Switzerland and
• Continued strong performance in DACH reaching 97.6% in H2 Italy starting to deliver, introduction of sales academy
• Improvements in Italy (+1.5pt), Sweden (+1pt)
• FY18 notable wins include:
• Retention performance in France has been difficult due to legacy
challenges but now improving by +1.5pt Q4 on Q3 after step changes
in the organization
• Consistent tracking embedded in all markets
• Q4 FY18 retained customers:
1 Retention for the Group including Pelican Rouge France
2 Includes estimations for pre-acquisition Pelican Rouge losses
3 H1 losses have been annualised for legacy Pelican Rouge entities
4 in FY18 15BNPP HIGH YIELD CONFERENCE JANUARY 2019
02 Focused Drivers of Organic Growth
Accelerating Net Growth
Growing Net Sales2 / Machine / Day (in €) (SMD)
Gains Losses Net Growth
+1.9%
H2 FY18
FY171 H1 FY18 23 23.2
28.7 25 26.8
6.1%
5.6% 9.8 10.0
5.3%
29 FY17 FY18
-5.6% On the Go
62.3 -6.4%
-7.5%
• SMD growth underpinned by high throughput petrol
rollouts mainly in France, UK
• Net growth from recurring annualised revenues gains and losses
• Machine productivity further boosted by cashless
moving from -2.2% in FY17 to -0.8% in H1 FY18 and +0.5% in H2
installations and targeted improvement in operations
FY18
(e.g. Paris metro and airport)
• Gain rate increasing on the back of large roll-outs across all
channels, namely in public (France, UK), semi-public (Sweden) Workplace
and private (Germany, Norway)
• Decreasing share of low throughput machines in the
machine mix: less low-performing machines in France,
the UK as well as less OCS machines in Italy
1 Includes estimations for pre-acquisition PR and Argenta gains and losses
2 Net sales based on sales net of vending fees
16BNPP HIGH YIELD CONFERENCE JANUARY 2019
Selecta Aims to Set the Industry Standard for Innovation, Leveraging the
02 Latest Technologies to Enhance Offerings
Innovation and Technological Development Bring Operational Efficiency and Margin Improvement
Selecta User Interface Selecta eWallet
Innovative interactive vending experience Unique customer experience and lower-cost
alternative to NFC-based systems
Cashless Payment Systems
Increased convenience to customers and consumers
Telemetry FOODIE’S MicroMarkets
Fully connected machines enabling dynamic refill Unmanned and unattended, 24h self-service stores
planning and remote monitoring designed for the workplace offering wider product offering
1703 Financial Highlights
BNPP HIGH YIELD CONFERENCE JANUARY 2019
03 Positive Developments Supporting Strong Ongoing Outlook
DELIVERED ON OUR COMMITMENTS IN 2018
Achieved
01 Gross Sales1: €1,545m, +2.3% actual sales growth, +4.0% vs. last year2 as reported
02 Adjusted EBITDA1: €248m, +5.7% vs. prior year
03 Synergy program: continues to be cash positive
04 Cash capex1: €95.8m
05 Free Cash Flow generation: covered our fixed cash charges in FY18
Note: Based on management accounts.
1 At constant foreign currency rates. Constant foreign currency rates applied: CHF/EUR 1.15; SEK/EUR 9.65; GBP/EUR 0.88
2 Gross sales growth of +4.0% include the positive effect of the harmonization of the vending fees accounting presentation. Excluding this effect, gross sales were up by +2.3%
19BNPP HIGH YIELD CONFERENCE JANUARY 2019
03 Steady 12 Months FY18 Performance – A Strong Basis for Future Growth
Key Financials Many Positive Developments
Revenue (€m)1, 2
Revenue growth • Revenue: Strong performance despite major
+2.3%3 transformation of the business
• €1,545m at Constant Currency (CC) +2.3% (reported +4.0%, including
the positive effect of vending fees accounting harmonization)
1,485.5 1,545.0
• Growth in Net Sales acceleration in 2018
• +1% in FY18
FY 2017 FY 2018 • Growth acceleration in H2 +2.1% (CC) compared to +0.1% in H1 due
to retention improvements, large new business rollouts, resilient SMD
growth and a dynamic trading channel
Adjusted EBITDA (€m)1, 2
% margin 5.7%
16.0%
• Adjusted EBITDA
15.8%
• +5.7% reported increase, €248.0m (CC): + €13.5m
• + €12m (CC) arising from growth and +0.2pt margin expansion
248.0
234.5 generated by procurement synergies
• Employee costs reduction from synergies, partially reinvested in
capabilities, mainly in sales
FY 2017 FY 2018
1 FY17 and FY18 numbers are constant scope including 12 months of Selecta, Pelican Rouge and Argenta
2 At constant foreign currency rates: CHF/EUR 1.15; GBP/EUR 0.88
2.3% increase excluding the positive effect of vending fees accounting harmonization
20
3BNPP HIGH YIELD CONFERENCE JANUARY 2019
Consistent Over-Delivery of Synergies Lead to Multiple Upgrades in
03 Targets With Further Upside Potential
Cumulative Synergies Delivery by 2020 Regular Review & Upgrades
(€ in million)
• Over-delivery and validation of early stage ideas (ML0 and ML1 potentials)
enabled an early upgrade of the program in February 2018
• Latest review results in the upgrade of program from €60m to €75m
75 • Higher procurement savings following Q1/Q2 over delivery (€5m)
60
52.5
• Delivery of maximum SG&A potential (€5m)
• Confirmation of telemetry and planning savings during pilots (€5m)
Upgrade 1 Upgrade 2 Upgrade 3
Increase in Increase in
Jan 18 Feb 18 May 18
confidence maturity • In addition, new initiatives (ML0 & ML1) have been identified internally, and
are currently being assessed
Maturity Level of Initiatives
Target: ML0 & ML1 = Latest plan: ML2+ = • Review supported by leading international consultancy
Idea / Identified Confirmed / Implemented
Synergy program is cash positive each year
21BNPP HIGH YIELD CONFERENCE JANUARY 2019
03 Cash Generation
Strong recurring cash generation (EBITDA less Capex) Structurally negative WC supporting growth funding
EBITDA less Capex: Total working capital position:
Q4 '17 Q1 '18 Q2 '18 Q3 '18 Q4 '18
€m FY16 FY17 FY18
Adjusted EBITDA 229.0 234.5 248.0
Net Capex1 122.1 126.9 121.7 (164.2)
(196.6) (184.3)
+17%
EBITDA less Net Capex 107.0 107.6 126.3 (263.6) (254.7)
Working capital breakdown:
Recurring cash conversion:
(Adj. EBITDA less net capex) / Adj. EBITDA 50.9% Q4 '17 Q1 '18 Q2 '18 Q3 '18 Q4 '18
Net inventories 93 105 102 106 98
46.7% 45.9% Net Receivables & trapped cash 172 184 202 182 158
Net Payables & accruals -346 -324 -302 -304 -360
Other working capital -183 -162 -186 -148 -151
FY 16 FY 17 FY 18 Total Working Capital -264 -197 -184 -164 -255
1 Net capital expenditures is defined as capital expenditures less net book value of disposals of vending equipment
22BNPP HIGH YIELD CONFERENCE JANUARY 2019
03 Capital Intensity Program to Reduce Total Cash Capex
Commitment to reduce cash capex by 20% by 2020 expected to be reached by end 2019
Structural Levers of the Program Capital Allocation Discipline
(Indexed to 100)
• PaybackBNPP HIGH YIELD CONFERENCE JANUARY 2019
03 Positive Developments Supporting Strong Ongoing Outlook
Delivered on our commitments in 2018, further acceleration from FY18 on top line, bottom line and cash generation
Achieved FY18 FY19 Outlook
01 Revenue1: €1,545m +2.3% +3.5%
02 Adjusted EBITDA1
€248m €265m - €275m
03 Synergy program: continues to be cash positive
04 Cash capex
€49m €80m - €100m
05 Free Cash Flow generation: covered our fixed cash charges in FY18
Note: Based on management accounts
1 At constant foreign currency rates. Constant foreign currency rates applied: CHF/EUR 1.15; SEK/EUR 9.65; GBP/EUR 0.88
24Thank you Contact us at: investor.info@selecta.com
You can also read