BNP PARIBAS PROMISING START TO THE 2020 PLAN - Exane BNP Paribas Conference 13 June 2018

Page created by Erin Hill
 
CONTINUE READING
BNP PARIBAS PROMISING START TO THE 2020 PLAN - Exane BNP Paribas Conference 13 June 2018
BNP PARIBAS
PROMISING START
TO THE 2020 PLAN

 Exane BNP Paribas Conference
 13 June 2018
BNP PARIBAS PROMISING START TO THE 2020 PLAN - Exane BNP Paribas Conference 13 June 2018
Disclaimer

The figures included in this presentation are unaudited. For 2018 they are based on the new accounting standard IFRS 9 Financial
Instruments whereas the Group has opted not to restate the previous years, as envisaged under the new standard.
This presentation includes forward-looking statements based on current beliefs and expectations about future events. Forward-looking
statements include financial projections and estimates and their underlying assumptions, statements regarding plans, objectives and
expectations with respect to future events, operations, products and services, and statements regarding future performance and
synergies. Forward-looking statements are not guarantees of future performance and are subject to inherent risks, uncertainties and
assumptions about BNP Paribas and its subsidiaries and investments, developments of BNP Paribas and its subsidiaries, banking
industry trends, future capital expenditures and acquisitions, changes in economic conditions globally or in BNP Paribas’ principal local
markets, the competitive market and regulatory factors. Those events are uncertain; their outcome may differ from current expectations
which may in turn significantly affect expected results. Actual results may differ materially from those projected or implied in these forward
looking statements. Any forward-looking statement contained in this presentation speaks as of the date of this presentation. BNP Paribas
undertakes no obligation to publicly revise or update any forward-looking statements in light of new information or future events. It should
be recalled in this regard that the Supervisory Review and Evaluation Process is carried out each year by the European Central Bank,
which can modify each year its capital adequacy ratio requirements for BNP Paribas.
The information contained in this presentation as it relates to parties other than BNP Paribas or derived from external sources has not
been independently verified and no representation or warranty expressed or implied is made as to, and no reliance should be placed on
the fairness, accuracy, completeness or correctness of, the information or opinions contained herein. None of BNP Paribas or its
representatives shall have any liability whatsoever in negligence or otherwise for any loss however arising from any use of this
presentation or its contents or otherwise arising in connection with this presentation or any other information or material discussed.
The sum of values contained in the tables and analyses may differ slightly from the total reported due to rounding.

                                                                                                                                  June 2018      2
Introduction

                    Strong and well diversified bank

                    A good macroeconomic context
  Higher GDP growth and interest rates vs 2020 conservative plan’s assumptions

       An ambitious programme of new customer experience,
            digital transformation & operating efficiency
               Generating 2.7 bn€ recurring cost savings by 2020

                                                                       June 2018   3
A Business Model Well Diversified by Country and Business
           2017 Revenues by geography:                                       2017 Allocated equity by business
           >89% in wealthy markets                                           No single business line > 17%
                                                                                  Securities Services: 1%
             Rest of the World: 5%                                                                            FRB: 13%
                                                             CIB: 29%       Corporate
             APAC: 6%                                                       Banking: 17%
                                                                                                                    BNL bc: 8%
                                               France: 32%
North America: 13%                                                      Global Markets:                              BRB: 7%
                                                                                   11%
                                                                                                                     Other DM: 5%
                                                                               WAM: 3%
 Other Europe: 18%
                                                                                                                   Europe-Med: 7%
                                             Italy: 11%                       Insurance: 11%
             Germany: 4%
                              Belgium: 11%                                                                  BancWest: 9%
                                                                                    Personal Finance: 8%
                                                                                                                     Retail Banking &
                                                                                                                      Services: 71%

 A balanced business model: a clear competitive advantage in terms of revenues
  and risk diversification
 An integrated business model fuelled by cooperation between Group businesses
 Strong resilience in changing environments

                     No country, business or industry concentration

                                                                                                                           June 2018    4
Diversification Leading to Recurrent Income Generation

 Net Income Group Share (2008-2017)                                     2017 Net income Group Share

€bn                                                                                                                              8.7                           €bn
                                                                       7.8
                7.8                                             7.8           6.6
                                                         7.7
                             6.6                  6.7                                4.9
       5.8            6.1                  6.1*
                                    5.6*                                                    3.6
                                                                                                    3.5
3.0                                                                                                        2.8
                                                                                                                                                       1.2
                                    4.8     0.2                                                                  -0.8                  -2.2                   -0.8

2008   2009    2010   2011   2012   2013   2014   2015   2016   2017

                                                                       BNPP SAN ING CASABBVA SG                   DB           HSBCBARC               UBS CS

 Recurrent earnings generation through the cycle
             Strong proven capacity to withstand local crisis and external shocks
             Leading Eurozone bank

                                                                        * Adjusted for costs and provisions related to the comprehensive settlement with US authorities

                                                                                                                                              June 2018           5
Strong Macroeconomic Context
      Good Business Drive Across All Operating Divisions

  Domestic Markets                              International Financial Services*                                             Corporate & Institutional Banking*
Outstanding                                   Outstanding                                                                 Outstanding
loans (€bn)
              370       +5.3%          390    loans (€bn)                                                                 loans (€bn)

                                                                       +7.2%            165
                                                            154                                                                                         +1.4%
                                                                                                                                          125                           127

              1Q17                     1Q18                 1Q17                       1Q18                                              1Q17                          1Q18

               French Retail Banking                          Personal Finance*                                                              Transaction Banking**
                      Loans                                    New production                                                                    EMEA region
     €bn                +7.2%                      €bn                                                                           €bn
                                                                                                                                                      +6.7%
                 151            162
                                                                     +9.2%                                                                                    25.1
                                                                                                                                               23.5
                                                               9.0            9.8

                 1Q17           1Q18                          1Q17           1Q18                                                             1Q17            1Q18

               Loan growth driven by the economic recovery in Europe
                                                                             * At constant scope and exchange rates; ** Clients average balances (Global & Specialised Trade and Loan book)

                                                                                                                                                                June 2018             6
Good Business Drive in France
Focus on French Retail Banking
                                                            Loans
                                                          €bn
 Significant loan growth confirmed in 1Q18                     151.4           162.3

     Across all client segments                                        +5.9%    72.8         Corporate
                                                                68.7
     In the context of solid economic growth in France
                                                                        +8.4%                 Individuals
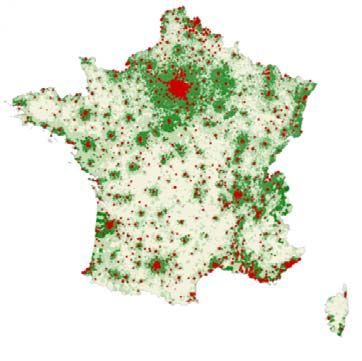
 French Retail Banking network well positioned                 82.7             89.6

     In the country’s higher growth areas
                                                                1Q17            1Q18
     Mostly in wealthier urban centres

                                                                                             Branches
 Confirmation of the sharp decline since June 2017                                     Average household income
                                                                                              < €25,000
  of renegotiations & early repayments                                                        €25,000 - €32,000
                                                                                              > €32,000

 Gradual revenue pick-up expected as of 2H18

                      Continued strong loan growth
               Gradual revenue pick-up expected as of 2H18

                                                                                            June 2018              7
Strong GDP Growth Outlook

 Conservative assumptions used for the 2020 plan

                                        Current GDP growth forecasts higher
                                       than the assumptions used for the plan

                                                                2.3              2.4                                                Assumptions used for the plan
                                                                                             2.0
                                             1.7                                                          1.7                       IMF forecasts (April 2018)
                                                                           1.4         1.4         1.4
                                                          1.0
                                 EuroZone
                                             2016          2017             2018E       2019E       2020E

                                                                                                                4.5 4.8   4.7 4.9   4.8 5.1        4.9 5.1
                                       2.9          2.7                                                  4.1
                           2.3
              1.6    1.6         1.6          1.6                1.7 1.9
     United                                                                             Emerging
     States                                                                             Markets
              2016    2017        2018E        2019E              2020E                              2016        2017      2018E     2019E          2020E

                     Better economic growth forecasts in Europe
                               vs plan’s assumptions
                                                                                                                                                June 2018           8
Interest Rate Sensitivity
Impact on Group Revenues

                Sensitivity of Group revenues to a parallel shift in interest rates
                             +50 basis points in market rates across all currencies

                                                                  ~ +700

                                                  ~ +500
                                                                              ► o/w 80% in Euro
                                                                                mainly on Domestic Markets

                                  ~ +200

                         €m

                                   Year 1          Year 2          Year 3

Additional revenue growth*         +0.4%           +1.2%           +1.6%

                    Significant positive sensitivity of the Group
                              to higher interest rates
                                                                                                * Based on 2017 Group revenues

                                                                                                     June 2018            9
Startup of the Transformation Plan                                5 levers for a new
                                                                   customer experience
                                                                                                  1.
                                                                                                  2.
                                                                                                  3.
                                                                                                        Implement new customer journeys
                                                                                                        Upgrade the operational model
                                                                                                        Adapt information systems

  in Line With the 2020 Objectives
                                                                    & a more effective
                                                                                                  4.    Make better use of data to serve clients
                                                                     and digital bank
                                                                                                  5.    Work differently

 An ambitious programme of new customer experiences,
                                                                                    Cumulated recurring cost savings
  digital transformation & savings
       Build the bank of the future by accelerating the digital                 €bn
                                                                                                                                    2.7
        transformation                                                                                              1.8
                                                                                                       1.1
       ~150 significant programmes identified*
                                                                                         0.5
                                                                                                       0.7
 Cost savings: €709m since the launch of the project                                    2017      2018            2019           2020
       Of which €175m booked in1Q18                                                             Realised           Targets

       Breakdown of cost savings by operating division in 1Q18:
        34% at CIB; 36% at Domestic Markets; 30% at IFS                             One-off transformation costs
       Target of €1.1bn in savings this year                                    €bn

 Transformation costs: €206m in 1Q18                                                      0.9               1.1                 1.0
       €1.1bn in transformation costs expected in 2018
                                                                                                              0.2
       Reminder: €3bn in transformation costs in the 2020 plan                           2017               2018               2019
                                                                                                 Realised           Targets

                           €2.7bn recurring cost savings by 2020
                                    €2.0bn still to come                                                                 *   Savings generated > €5m

                                                                                                                          June 2018             10
2020 Business Development Plan
    An Integrated Bank with Differentiated Strategy by Division
                          Domestic Markets
► Strengthen the sales & marketing drive
   Headwinds (e.g. low interest rates) still present in 2018, but which are expected to
    ease up
   Enhance the attractiveness of offering and offer new services

                       International Financial Services                                      In all the businesses

► Pursue growth
   Consolidate leading positions: leveraging best in class offers                         An ambitious new customer
                                                                                           experience, digital
   Speed up the pace of growth of the businesses (new offerings, new partnerships
                                                                                           transformation and savings
    and new countries)
                                                                                           programme
   Continue selective development of retail banks

                       Corporate & Institutional Banking
► Optimise resources and revenue growth
    Grow the corporate and institutional client franchises
    Implement specific initiatives in selected countries in Europe
    Develop fee generating service businesses

                                                                                                          June 2018   11
Domestic Markets
 Adapt & Reinvent Customer Offerings

                                     Example: 4 distinct offers in France adapted to different banking uses

                                                                                                     Branch network                 Private banking

                                  > 900,000 accounts           365,000 clients                  7m clients                      290,000 clients
                                   opened

                                                   REMOTE                             HYBRID                         ADVISORY
Give customers                               Self-driven customers          Customers combining                Customers looking for
                                              looking for simplicity      face-to-face interactions &       expertise and/or customised
 the choice by                                  and convenience              remote channels use              service & ready to pay a
 adapting our                                                                                                      premium price
  offerings to
                                                                                   Multi-channel                    Multi-channel
   different                                    Full digital offer
                                                                                   service offer                    service offer
 banking uses    ► Diversified service
                   models adapted to                                                                                                             Digital

                   clients’ expectations        Digital or remote                      A team                   Dedicated & proactive
                   & country-specific        distribution & services               at your service              relationship manager
                   characteristics
                                                                                                                                                Human
                                                                                  Pay-per-use                   Explicit invoicing of a
                                                   Freemium                  for high value added                higher service level
                                                                                    services

                                              COMMON PLATFORMS: Products & services – Channels – Remote expertise

                                                                                                                                            June 2018      12
Domestic Markets
 Develop Digital and Mobile Banking

                     ► Development of data use for the benefit of customers & of commercial performance
    Enhance
    data use              Improve the customer contact opportunity conversion rate
                           Objective: 33% of customer contact opportunities converted in 2020

                     ► Implementation of new features for mobile payments
                          Person-to-person mobile payments: Jiffy in Italy,
                           Payconiq in Belgium & Paylib entre Amis in France
 Develop use of           Payment card settings managed directly by customers via mobile device
 mobile banking
                     ► Speeding up digital customer onboardings
    services
                          New customer acquisitions: 1/3 achieved entirely through digital channels
                     ► Sharp rise in the number of active mobile users in the networks: +21% vs. 1Q17
                          17 average monthly connections (+10% vs. 1Q17)

                     ► Lyfpay: aiming to become the European reference for added-value
  Anticipate new       mobile payment solution to serve client relationship
  usage trends &          2,500 daily downloads of the app
diversify revenues
                          Agreement signed in February with Casino Group: rollout in > 500 stores across France
with the launch of
    innovative       ► Kintessia: first B-to-B marketplace enabling Leasing Solutions customers
     products          to optimise the use of their assets by renting them

                                                                                                       June 2018   13
Domestic Markets: Upgrade the Operating Model
      to Enhance Efficiency & Customer Service

           Simplify and optimise                           Create omni-channel customer                   New digital end-to-end
        the local commercial set-up                               service centres                            value proposal

                                                                              Customers
► Continue branch network optimisation                                                                    Offers   Front      Back
                                                                    Visits
     -16% branches since 2012
                                        723
                                                                                Contacts
     138 branches closed               (-215)
                                                  41       Local                                Digital
      in 2017                                     (+3)
                                                           set-up                              banking
                                        1,895
                                         (-305)

                                                                             Service centres
                                                   744
               Number of branches                 (-146)
                 as at 31.03.2018
                 (variation vs. 2012)
                                                            ► New customer relationship                   ► Evolution towards new
                                                              management model and                          customer service models
► New regional organisation                                   Sale/After-sale convergence
                                                                                                          ► Rollout of reinvented
     Removal of one management                             ► Differentiated treatment between              end-to-end digital
      layer in FRB (out of 4)                                 standard services & premium                   customer journeys
     Similar streamlining                                    solutions
      under way at BNL and BRB
     Shorten the decision-making
      process, make the set-up
      more efficient & reduce costs

                                                                                                                           June 2018   14
International Financial Services
New Partnerships and Client Experience

               ► Personal Finance:
                    Kia Motors, Hyundai Motor (Spain & France); Toyota (Portugal)
                    New sectors (tourism: TUI in France; telecoms: Masmovil in Spain)
  Develop           New countries (Austria: XXXLutz in home furnishings)
    new             China: good development of JVs with Bank of Nanjing, Geely and Suning
partnerships   ► Insurance:
                    Promising start of the partnership with Matmut in France: launched
                     the first sales of car and home owner’s insurance at FRB & Hello bank!
                    Partnership with SeLoger.com to simulate & purchase credit protection
                     insurance online in France

               ► Personal Finance: 72% of contracts signed electronically in France, Italy & Spain

 Optimise      ► Insurance: ability to buy creditor insurance fully online in France
  client
experience     ► Wealth Management:
                    Launch of Voice of Wealth: app by Bank of the West Private Banking
                     to help customers manage their investment portfolios

                                                                                                     June 2018   15
International Financial Services
  Develop Digitalisation & Enhance Operating Efficiency
                     ► New technologies:
                          Leveraging the acquisition of Gambit (robo-advisory):
                           launch in France of Birdee (after Belgium and Luxembourg),
                           a digital financial management solution for individuals
                          Partnership with Plug & Play, world’s largest start-up accelerator

                     ► Digital banks: launch by Personal Finance of new
  Develop new          digital banks in Europe (Hello bank! by Cetelem)
                                                                                      Digital banks in Europe
                                                                                      (Number of clients as at 31.03.18)

technologies and
                          Leveraging in particular the strong brand recognition
business models            and the sizeable client base (27 million clients
                                                                                                      Hello bank!
                                                                                                    Domestic Markets
                                                                                                5 countries / 2.9m clients
                           in 28 countries)
                          Successful launch in the Czech Republic at end 2017
                          4 other countries expected in Eastern Europe (Slovakia,
                           Hungary, Romania and Bulgaria)
                          > 50 million inhabitants in these 5 countries
                                                                                           Hello bank! by Cetelem
                                                                                           Target of 5 countries by 2020 :

                     ► Asset Management: ongoing implementation of BlackRock’s IT outsourcing
 Industrialise and     solution, Aladdin
enhance operating
    efficiency       ► Bank of the West: centralising some functions and streamlining hierarchical levels

                                                                                                                             June 2018   16
International Financial Services
       Growth Enhancing Bolt-on Acquisitions

                    ► Personal Finance: acquisition in partnership with PSA Group                                                                                 Contribution of acquisitions made in 2017
                      of 50% of General Motors Europe’s financing activities
                                                                                                                                                                                                Personal Finance         Insurance
                      (outstanding loans of €9.4bn at year-end 2017)                                                                                           €m
                                                                                                                                                                              693 727
                                                                                                                                                                       621
                                                                                                                                                                                                                        Real Estate
                    ► Personal Finance: acquisition of SevenDay Finans AB,
                      a consumer credit specialist in Sweden (70,000 clients,
       2017

                                                                                                                                                                                                                         281
                      outstanding loans of €0.7bn at year-end 2017)                                                                                                                                               217
                                                                                                                                                                                                           146
                                                                                                                                                                105                                 65
                    ► BNP Paribas Cardif: buyout of the remaining 50% stake in
                      Cargeas Italy (property and casualty insurance)                                                                                           2017 2018E 2019E 2020E             2017 2018E 2019E 2020E
                                                                                                                                                                Revenues of acquisitions made      Pre-tax income of acquisitions made

                    ► Real Estate Services: acquisition of Strutt & Parker,
                                                                                                                                                                ~+1 point of 2016-2020 revenues CAGR
                      leading player in the UK property market

                                                                                                                                                                                  Good complementarity with
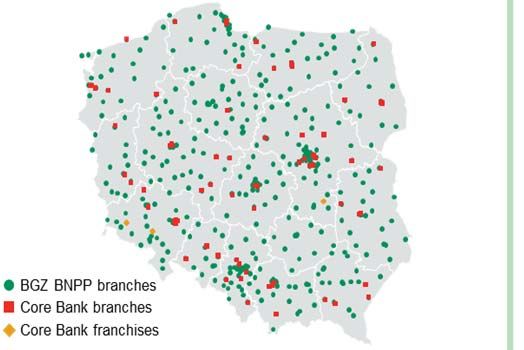
                    ► Europe-Med: announcement of the acquisition of the core banking
                                                                                                                                                                                  BGZ BNP Paribas
                      operations of Raiffeisen Bank Polska*
                                  Strengthening of BGZ BNP Paribas as the 6th largest bank in Poland
                                   with > 6% combined market share in loans and deposits at year-end 2017
       2018

                                  Acquisition price corresponding to 87% of the book value
                                  Positive 1% impact on the Group’s net EPS in 2020

                    ► Wealth Management: announcement of the acquisition of ABN Amro Bank
                      Luxembourg** (€5.6bn of AuM in private banking and €2.7bn in life insurance)

                                                                                                               * Closing of the transaction expected in 4Q18, subject to the execution of the final documentation and regulatory approvals;
activities acquired: business of Raiffeisen Bank Polska excluding the foreign currency retail mortgage loan portfolio and excluding a limited amount of other assets; ** Subject to regulatory approvals, deal expected to be closed in 3Q18

                                                                                                                                                                                                                 June 2018               17
Corporate & Institutional Banking
  Continue Develop Customer Franchises

                    ► Corporates: strengthen the footprint in targeted                                                European market penetration
                      countries in Europe (notably Germany,                                                           on corporates*
                      Netherlands, UK & Scandinavia)                                                            (in %)                                       #1 Corporate Banking
                                                                                                                      #1 Cash Management
                                  Good business development in targeted                                                                                             +11 pts
                                                                                                                                                                           65
                                   countries (revenues vs. 2016: +5.6% in                                                                                         58 60 61
                                   Germany)                                                                                  +11 pts                        54 56

                                  Over 170 new client groups gained
                                                                                                                                 40 41
                                   since 1st January 2017 in EMEA**                                                     36 36 38
                                                                                                                 30
                                  Increased penetration in European
                                   Corporate Banking & Cash Management
 Grow selective                                                                                                 2012 2013 2014 2015 2016 2017            2012 2013 2014 2015 2016 2017
client franchises   ► Institutionals: bolster our presence
                                  Continue to gain new mandates in                                                   Strong growth in assets under
                                   Securities Services & to develop its                                               custody and under administration
                                   multi-local model                                                             End of period
                                                                                                                 in 000 €bn
                                  Strengthen the coordinated offering of                                                                      +14% CAGR
                                                                                                                                                                               Mapfre : €60bn
                                                                                                                                                                               AIIB(4) : ~€18bn
                                                                                                                                                                      UniSuper
                                   the businesses (One Bank Approach)                                                                                                          Actiam : €56bn
                                                                                                                                                             UniSuper AUD50bn Carmignac : €44bn
                                                                                                                                                 Generali    AUD50bn
                                                                                                                                                 €180bn
                                                                                                                                         CDC
                    ► Leverage the global presence of the Group                                                                         €330bn

                                  Reinforce commercial synergies between                                                                                                10.6       11.7
                                                                                                                                                   8.8         9.9
                                   Europe, the Americas and Asia-Pacific                                              5.3        6.5    7.1

                                  Develop the footprint in selected markets
                                                                                                                      2011       2012   2013      2014        2015       2016       2017
                                   (Indonesia, etc.)

                      * Source: Greenwich Share Leader Survey (European Top-Tier Large Corporate Cash Management, European Top-Tier Large Corporate Banking); ** Europe, Middle East & Africa

                                                                                                                                                                      June 2018              18
Corporate & Institutional Banking
  Targeted Growth Initiatives & Digital Transformation
                   ► New partnerships:
                          Finalisation of the strategic partnership with Janus Henderson
                           in the United States (USD138bn in assets under custody)
                          Promising start of the partnership between Global Markets and
                           GTS to enhance and expand the client offering on US Treasuries
                          Symphony communication & workflow automation tool now
   Implement
                           rolled out across front-office teams
targeted growth
    initiatives    ► Strengthen the integrated CIB model
                          Securities Services & Global Markets to launch joint offerings
                           (execution & netting of derivatives, collateral management, forex, etc.)
                          Development of cooperation between Bank of the West and CIB on corporates
                   ► Roll-out new offerings
                           Launch of the tri-party collateral management offering (Securities Services)

                  ► Digitalise customer journeys                                             Centric
                           Good development of all digital platforms                      Number of clients
                            (Centric, Cortex, Smart Derivatives, etc.)                     (end of period)
                                                                                                                          8,475 8,790
  Accelerate               > 300 new clients on-boarded onto Centric
                                                                                                                  6,250
    digital                 in 1Q18
                                                                                 Centric
transformation                                                                                            4,000
                  ► 120 digital projects launched (out of 150 identified)
                                                                                                  2,250

                  ► Digitalisation & industrialisation of the Know Your Client              500

                    (KYC) process                                                          2013   2014    2015    2016    2017   1Q18

                                                                                                                  June 2018             19
Corporate & Institutional Banking
  Improved Efficiency and Profitability
                   ► Effect of the cost saving programmes launched since
                                                                                           Cost income ratio
                     2016: €650m in 2 years i.e. 50% of 2020 target
                           Cost decrease in 1Q18: -7.2%* vs.1Q17                                           -1.7pts
    Improve                                                                                    72.4%
                   ► Development of mutualised platforms (Portugal, etc.)                                                  70.7%
   operating
   efficiency      ► Automation of 200 processes by end 2018 (IT access,
                     compliance controls, liquidity indicators)
                   ► 4 “end-to-end processes” under way (client onboarding,
                     credit process, forex cash and fund administration)                       2016                        2017

                   ► Reduced risk-weighted assets:
                            €7bn reduction since 1st January 2017: right-sizing of sub-profitable portfolios,
    Optimise                 active management of financial resources (loan sales, securitisations, etc.)
    financial
                            75% of the target of -€20bn achieved (-€8bn already achieved in 2016)
   resources
                            Allocated equity: €19.9bn in 1Q18 (-10.1% vs. 1Q17)
                   ► Gradual redeployment of the resources thus freed up into growth

                                                                                          Pre-tax RONE**
                   ► Already significant increase in the Return on Equity                                 +2.8pts        16.1%
  Significantly      thanks to the combined effect of the measures enacted                   13.3%
  improve the
Return on Equity            16.1% pre-tax RONE** in 2017
                             (18.5% in 1Q18)

                                                                                              2016                        2017
                                                                                             * Excluding IFRIC 21 «Taxes»; ** Return on Notional Equity

                                                                                                                         June 2018               20
Implementation of 5 Levers for a New Customer Experience
                                                                Upgrade the operational model
                                                                                                                           Implementation
                                                                   Streamlining and automatisation of end-to-end             example
                                                                    processes
Implement new customer journeys                                    Simplification of the organisations
                                                                   Shared platforms and smart sourcing

    New digitalised, expanded,          Implementation
     seamless and personalised             examples                                                         Make better use of data
     customer journeys (more
                                                                                                            to serve clients
     services, more attractiveness,
     choice of channel)                                                                                        Better reliability of data and enhancement of
    Upgraded service models                                                                                    data use for the benefit of customers
     (better customer segmentation                                                                             Reinforcement of data storage, protection and
     based on user habits, “the right                                                                           analysis capacities
     product at the right time and                                      5 levers for a new
                                                                                                               Use of cutting-edge technologies (artificial
     through the right channel”)                                      customer experience                       intelligence, machine learning)
    Digitalisation of distribution by                                 & a more effective
     developing digital customer                                         and digital bank
     interfaces                                                                                                             Implementation examples

    New services made available

 Work differently
        More digital, collaborative and       Implementation               Adapt information systems
                                                 examples
         agile work practices                                                                                                               Implementation example
                                                                               Evolution of information systems and
        Day-to-day digital environment                                                                                                              Customer Interaction
                                                                                incorporation of new technologies          Digital   Omni channel
         & digital and innovation driven                                                                                              Interfaces        Management
                                                                                in order to accelerate digital            platform
         culture
                                                                               Improvement of IT efficiency and agile                              Data Hub
        Staff training                                                         practices                                 Banking      Products & Services      Corporate
                                                                                                                          platform                              & Support
                                                                               Promotion of innovation                                     Factories            systems

                                                                                                                                                     June 2018          21
2020 Targets

                                                                                                                        2020 Plan

                                                                                                                2016-2020 CAGR*
                      Revenue growth
                                                                                                                    ≥ +2.5%

              Recurring cost savings target
                                                                                                                          ~€2.7bn
                   starting from 2020

         Cost income ratio                                        2016: 66.8%**                                               63%

               ROE                                                 2016: 9.4%**                                             > 10%

   Fully loaded Basel 3 CET1 ratio                                 2016: 11.5%                                              12%***

            Pay-out ratio                                            2016: 45%                                              50%****

                                  ROE > 10% in 2020

                       * Compounded annual growth rate; ** Excluding exceptional items; *** Assuming constant regulatory framework; **** Subject to Annual General Meeting approval

                                                                                                                                                        June 2018            22
Commitment for a Positive Impact on Society

     CSR culture
recognised by leading
                               Selected in the Dow Jones
   indices & labels           Sustainability World & Europe
                                                                 "Top 10 Performers" of the CAC 40®              2nd bank in Thomson Reuters’
                                                              Governance index (Euronext & Vigeo Eiris)        Global Diversity & Inclusion index
                                  Index, #1 French bank

                             Stop the financings to tobacco companies
Sense of responsibility
                             Placed in 2017 sustainable bonds for an equivalent of $6bn (+116% vs. 2016)
rooted in our financial
     activities…             United Nations Sustainable Development Goals (SDGs): €155bn in financings
                              to support energy transition and sectors considered as directly contributing to SDGs*

     …and in our             BNP Paribas Foundation and Bill & Melinda Gates Foundation:
philanthropic actions         support 600 researchers on climate change adaptation in Africa

   A major role in the       Stop funding companies whose principal business activity is gas / oil
transition toward a low       from shale (or from tar sands) & oil / gas projects located in the Artic region
    carbon economy           Carbon neutrality of BNP Paribas’ own operations achieved in 2017

                                                                                                          * Including sustainable bonds’ placement and CSR funds

                                                                                                                                     June 2018           23
Conclusion

                    Strong and well diversified bank

                     A good macroeconomic context
  Positive impact of higher GDP growth and interest rates vs 2020 plan

          Businesses strengthening their commercial position
    New customer experiences & operating efficiency improvement
              by speeding up digital transformation

               Promising start to the 2020 plan

                                                                 June 2018   24
Appendix

           June 2018   25
Diversification Leading to
  Lower Risk and Steady Capital Generation

  Cost of Risk/Gross Operating Income 2008-2017                                         Annual evolution of the CET1 ratio*

                                                                                             After buy-back of the Fortis
                                                                                             shares held by the minority
                                                                             760%              shareholders (~-50 bp)
                                                                                                                                             +60bp +30bp
                                                                                                                            +40bp +0bp +60bp
                                                                                                                   +210bp
                                   74%
                                                                           67%                                 +90bp
                         58% 61%                                     62%
                                                                                                      +120bp
                50%50%                                      52%52%                                                                  +100 bp excluding costs
        44% 46%                                       43%                                        +260bp                                   related to the
  34%
                                                                                              -30bp                                comprehensive settlement
                                         24%24% 28%                                                                                 with the U.S. authorities

                                                                                             12.07 12.08 12.09 12.10 12.11 12.12 12.13 12.14 12.15 12.16 12.17

 One of the lowest CoR/GOI through the cycle                                        Strong track-record in capital generation
            Diversification and strong discipline at origination                              Low risk and limited volatility of earnings

                                         Diversification  lower risk profile

                                                                                                                                                * CRD4 “2019 fully loaded

                                                                                                                                                 June 2018            26
Financial Structure
 Reminder CET1 as at 01.01.18: limited impact of 2 technical effects                                                                              Fully loaded Basel 3 CET1 ratio*
        1st time application of IFRS 9 (fully loaded): ~-10 bp                                                                                            11.6%                              11.6%
        Deduction of irrevocable payment commitments from prudential capital:
         ~-10 bp
      Pro forma CET1 ratio* as at 01.01.18: 11.6%

 Fully loaded Basel 3 CET1 ratio*: 11.6% as at 31.03.18
        1Q18 results after taking into account a 50% pay-out ratio (+10 bp)
        Increase in risk-weighted assets excluding foreign exchange
                                                                                                                                                        01.01.18                           31.03.18
                                                                                                                                                          pro forma
         effect (-10 bp)
        Foreign exchange effect overall negligible on the ratio                                                                                   Liquidity reserve (€bn)***

                                                                                                                                                                                                321
 Fully loaded Basel 3 leverage**: 4.1% as at 31.03.18                                                                                                       285

 Liquidity Coverage Ratio: 120% as at 31.03.18

 Immediately available liquidity reserve: €321bn***
  (€285bn as at 31.12.17)
        Room to manoeuvre > 1 year in terms of wholesale funding                                                                                       31.12.17                           31.03.18

                                                 Very solid financial structure
                  * CRD4 “2019 fully loaded”; ** CRD4 “2019 fully loaded”, calculated according to the delegated act of the EC dated 10.10.2014 on total Tier 1 Capital and using value date for securities transactions;
                              *** Liquid market assets or eligible to central banks (counterbalancing capacity) taking into account prudential standards, notably US standards, minus intra-day payment system needs

                                                                                                                                                                                             June 2018             27
Recurrent Value Creation for Shareholders
      Net book value per share

                                                       CAGR: +5.3%
                                                       75.1                                                    73.6                         Reminder: impact on the equity
                                             70.9 73.9                                                                                      of the first time application of
                                        66.6
                              63.1 65.0      10.7 10.6 10.0                                                    9.9                          IFRS 9 as at 01.01.18: -€2.5bn
                    55.6 57.1           10.9
              51.9            10.7 10.0                                                                                                     or €2 per share
        45.7        11.5 11.7
               11.1
         13.7
                                             60.2 63.3 65.1                                                   63.7
                              52.4 55.0 55.7                                                                                                     Net tangible book value per share
               40.8 44.1 45.4
         32.0

  €
        31.12.08 31.12.09 31.12.10 31.12.11 31.12.12 31.12.13 31.12.14 31.12.15 31.12.16 31.12.17           31.03.18*

       Dividend per share

                                                                                                                             3.02                 Dividend**: €3.02 per share
                                                                                                                2.70                               (+11.9% vs. 2016)
                                  2.10                                                              2.31
                                                                                                                                                              Paid in cash
                     1.50                                  1.50         1.50        1.50
                                              1.20                                                                                                            Dividend yield: 5.7%***
         0.97
                                                                                                                                                  Pay-out ratio of 50%
  €
                                                                                                                                                              As per the 2020 plan
         2008        2009        2010         2011         2012        2013         2014            2015        2016         2017

                                                                                                    * First time application of IFRS 9; ** Paid on 1st June 2018; *** Based on the closing price on 31 May 2018 (€53.06)

                                                                                                                                                                                            June 2018             28
You can also read