SPAIN Information and Communication Technologies sector

 
CONTINUE READING
SPAIN Information and Communication Technologies sector
SPAIN

Information and Communication
Technologies sector
SPAIN Information and Communication Technologies sector
I. ICT Sector in Spain
SPAIN Information and Communication Technologies sector
Overview

   ❖      Spain is one of the most important ICT markets by volume in Europe: €108,862
          Million.
   ❖      There are more than 34,000 ICT companies, including digital content, operating in
          Spain. The sector employs more than 496,000 workers.
   ❖      The gross added value at market prices represented the 4.3% of GDP in 2017.
   ❖      The flow of foreign investment in the ICT sector in Spain was €2,168 Million in 2017.
   ❖      Exports of ICT products grew again for the fifth consecutive year to stand at €14,775
          Million in 2017.

                        The World ICT market by region, 2017                                                Spain ICT Sector Turnover, 2017

                                      Canada South Korea                                                                 Production
                                LATAM***
                                              1.6%
                                                                                                    Commerce               3.4%
                   Asia Pacific**      4.4%
                                           2.3%
                                    7.2%                                                                       18.7%
      Middle East & Africa                                                                                                             25.6%      Telecommunications
                                                                32.6%       USA
                              6.1%

                             6.5%       € 3,434 Billion                                                            €108.86 Billion
                   Japan
                                                                                                           19.5%
                                                                                         Digital Content
                                    17.8%
                                                                                                                                   32.8%
                                                        21.4%
                            BRIC
                                                                    Europe*
                                                                                                                                      Information Technologies
          *except Russia **except China, India, South Korea and Japan ***except Brazil

Source : ONTSI (National Observatory for Telecommunications and the Information Society ), 2018. Data 2017 (Last data available)                                 3
SPAIN Information and Communication Technologies sector
Overview by Segments

   ❖ Digital Content: There are included publication of books, magazines and other
     publication activities. Cinematographic, video and television programs. Sound recording
     and music edition activities. Other information services, programming and broadcasting
     activities, Video Games and Online Advertising.

   ❖ Telecommunication: Telecommunication services operators and companies dedicated
     to the provision of specialized telecommunication services and applications.

   ❖ Commerce: Companies engaged in the wholesale of computers, peripheral equipment,
     software, electronic and telecommunications equipment.

   ❖ Information Technologies: There are included software companies, programming, IT
     resources management, consulting, data processing, hosting and repair and
     maintenance services.

   ❖ Production: Companies that manufacture electronic components, printed circuits, as
     well as computers, telecommunications equipment, consumer electronics and magnetic
     and optical media.

                                              Number of companies   Workers       Turnover (€ Million)    Investment (€ Million)

          Digital Content                                   9,785       105,760                 21,236                      3,072

          Telecommunication                                 3,632        71,521                 27,904                      4,650

          Commerce                                         3,0007        27,502                 20,404                      1,025

          Production                                          932        15,190                   3,648                       498

          Information Technologies                         16,648       276,788                 35,670                      9,022

Source: ONTSI, 2018. Data 2017 (Last data available)                                                                               4
SPAIN Information and Communication Technologies sector
Digital Content

                                                             Data from Digital Content in 2017

                                                                                                                                  Turnover        Investment
                                                                                    Number of companies           Workers
                                                                                                                                  (€ Million)      (€ Million)

  Publication of books, magazines and other publication activities                                       3,182       33,786               5,497           1,795

  Cinematographic, video and television programs                                                         2,817       28,786               4,815             873

  Sound recording and music edition activities                                                             154          747                386              105

  Other information services                                                                             2,440       19,332                669               93

  Programming and broadcasting activities                                                                1,192       23,109               7,448             206
  Video Games                                                                                             450*        5440*                713               ND

  Online Advertising                                                                                        ND           ND               1,708              ND

                                                          Spain Digital Content Turnover , 2017

                                                   Other information services Sound recording and music edition activities
                                                           Video Games        1.8%
                                                                            3.1%
                                               Online Advertising          3.4%
                                                                      8%                 25.9%      Publication of books, magazines and other publication activities

                                                                        €21.24 Billion
            Cinematographic, video and television programs      22.7%

                                                                                    35.1%

                                                                                                Programming and broadcasting activities

Source: ONTSI, 2018. Data 2017 (Last data available)
(*): White Paper of Spanish Videogame Development. DEV, 2017. Data 2016 (Last data available)                                                               5
SPAIN Information and Communication Technologies sector
Digital Content. Video Games

              Videogame companies distribution                                                 Turnover by business model
                                                                                                      (% Turnover)

                                                                                                                           Offline Shopping

                                                                                                                           Online Shopping
                                                                                                                           F2P + Advertisement

                                                                                                                           F2P + in-Game Purchases

                                                                                                                           Development for third parties
                                                                                                                           Sale of services
                                                                                                                           Sale of assets

                                                                                                                           Others

                                                                                                    Turnover by regions
                                                                                                     (% Global Turnover)

      ❖ The Spanish Videogame development                                                                                     Spain
        industry had a turnover of 713 million
                                                                                                                              Rest of Europe
        euros in 2017
                                                                                                                              Middle East & Africa
      ❖ There are 455 Videogame companies
                                                                                                                              Asia Pacific
        in Spain and more than 6,300 workers in
        the industry                                                                                                          North America

                                                                                                                              LATAM

Source: White Paper of Spanish Videogame Development. DEV, 2018. Data 2017 (Last data available)                                               6
SPAIN Information and Communication Technologies sector
Telecommunication. Operators

                   Turnover by Operator (€ Million)                                                Main mobile operators
                   Company                        Turnover                      Movistar                                  www.movistar.es

       Movistar                                   14,884.43                     Vodafone                                  www.vodafone.es

       Vodafone                                    5,591.45                     Orange                                     www.orange.es

       Orange                                      5,427.79                     Masmovil                                  www.masmovil.es

       Masmovil                                    1,303.12                         Mobile Virtual Network Enablers (Complete)
       Atresmedia                                   858,72                                    Brand                     Main Host Operator
       Mediaset España                              814,96                      Aire Networks
                                                                                DIGI Mobil
       Euskaltel                                    557,08                                                                       Movistar
                                                                                Lycamobile
       Rest                                        4,862.67                     TeleCable

       Total                                     34,300.22                      Lowi                                             Vodafone

                                                                                Euskaltel
                                                                                Ibercom
                                                                                IOS
                                                                                                                                 Orange
                                                                                R
                           Rest
                                                                                Simyo
                             14.2%                                              Truphone
               Euskaltel                                                          Mobile Virtual Network Enablers (Redistributors)
      Mediaset España 1.6%
                         2.4%                          Movistar                               Brand                     Main Host Operator
         Atresmedia 2.5%
           Masmovil 3.8%                                                        PepePhone                                        Movistar
                                               43.4%
                                                                                Lebara,     Hits   Mobile,   Eroski
                                                                                                                                 Vodafone
                                                                                Móvil
                        15.8%
               Orange                                                           BT, Carrefouronline, Día Móvil,
                                                                                LCR     Telecom,     Lemonvil,
                                  16.3%                                         Moreminutes,          Ocean’s,
                                                                                OpenCable, Procono, Quattre,                     Orange
                                                                                República Móvil, Sarenet, Voz
                                  Vodafone
                                                                                Telecom,      The      Telecom
                                                                                Boutique, You Mobile

Source: CNMC (Spanish Commission for Market and Competence), 2018.
Data 2017 (Last data available)                                            Source: CNMC, 2018. Data 2017 (Last data available)               7
SPAIN Information and Communication Technologies sector
Commerce

                                                                                 Commerce in 2017

                                                                                              Turnover       Investment
                                                        Number of companies        Workers
                                                                                              (€ Million)     (€ Million)

                                                                        3,0007       27,502         20,404              1,025

                  Number of companies                                                                                             Turnover (€ Million)
   3500                                                                                                      25000
                                                       3,007                                                                                                             20,404
   3000                              2,809 2,884 2,940                                                                                                             19,556
                           2,662                                                                             20000
           2,495 2,502                                                                                                                                    17,694
   2500                                                                                                                 15,705                   15,913
                                                                                                                                 14,125 14,179
   2000                                                                                                      15000

   1500                                                                                                      10000
   1000
                                                                                                              5000
    500
      0                                                                                                             0
           2011    2012     2013     2014     2015     2016     2017                                                     2011     2012   2013     2014     2015     2016   2017

                                                                            Evolution 2011 - 2017
                            Workers                                                                                              Investment (€ Million)
   28000                                                       27,502                                        1600
                                                                                                                                                                   1,354
   27000                                               26,557                                                1400

   26000 25,448                                                                                              1200                                                          1,025
                                              25,193                                                                                                      971
                                     24,986                                                                  1000       892
   25000                                                                                                                                         760
                   24,126                                                                                     800                683     667
   24000                    23,458
                                                                                                              600
   23000
                                                                                                              400
   22000                                                                                                      200
   21000                                                                                                        0
            2011    2012     2013     2014    2015      2016    2017                                                    2011     2012    2013    2014     2015     2016    2017

Source: ONTSI, 2018. Data 2017 (Last data available)                                                                                                                           8
SPAIN Information and Communication Technologies sector
Production

                                                                               Production in 2017

                                                                                              Turnover      Investment
                                                         Number of companies     Workers
                                                                                              (€ Million)    (€ Million)

                                                                         932        15,190          3,648             498

                    Number of companies                                                                                      Turnover (€ Million)
   940                                          934     932     932                                         4500
                                                                                                                   3,966
   920                                                                                                      4000                                                3,648
                                        907                                                                                                       3,367 3,459
                                                                                                            3500
   900                                                                                                                                    2,941
                                                                                                            3000
                               874                                                                                         2,433 2,378
   880       865                                                                                            2500
                      855                                                                                   2000
   860
                                                                                                            1500
   840
                                                                                                            1000
   820                                                                                                       500
   800                                                                                                         0
             2011     2012     2013     2014    2015    2016    2017                                                2011    2012   2013   2014    2015   2016   2017

                                                                           Evolution 2011 - 2017
                                Workers                                                                                     Investment (€ Million)
   20000                                                                                                    600                                          566
              17,722
                                                                                                                   489     483                                  84.6
                       15,410                              15,190                                           500
                                14,462 14,230 14,474 14,478
   15000                                                                                                                           403            397
                                                                                                            400
                                                                                                                                          286
   10000                                                                                                    300

                                                                                                            200
    5000
                                                                                                            100

         0                                                                                                    0
               2011     2012     2013    2014    2015    2016    2017                                              2011    2012    2013   2014    2015   2016   2017

Source: ONTSI, 2018. Data 2017 (Last data available)                                                                                                                   9
SPAIN Information and Communication Technologies sector
Information Technologies

                                                                     Information Technologies in 2017

                                                                                           Turnover        Investment
                                                     Number of companies      Workers
                                                                                           (€ Million)      (€ Million)

                                                                     16,648    276,788            35,670           9,022

                Number of companies                                                                                         Turnover (€ Million)
   18000                                          16,648                                                   40000                                                 35,670
                                            15,899                                                                                                         35,178
   16000                             15,032                                                                35000
                              13,975                                                                                                        32,505
   14000 12,617 12,409 13,035                                                                              30000 27,657               28,383
                                                                                                                        26,825 26,896
   12000
                                                                                                           25000
   10000
                                                                                                           20000
    8000
                                                                                                           15000
    6000
    4000                                                                                                   10000
    2000                                                                                                    5000
       0                                                                                                       0
             2011    2012    2013    2014    2015    2016    2017                                                  2011    2012    2013    2014    2015     2016   2017

                                                                          Evolution 2011 - 2017
                            Workers                                                                                        Investment (€ Million)
   300000                                       276,788                                                    10000                                                   9,022
                                          255,003                                                                                                          8,363
   250000                           237,266                                                                                7,624                   7,782
                              215,393                                                                       8000   7,201
          199,770                                                                                                                  6,810
                 197,926 198,232                                                                                                           6,264
   200000
                                                                                                            6000
   150000
                                                                                                            4000
   100000

    50000                                                                                                   2000

         0                                                                                                     0
              2011    2012    2013    2014    2015    2016    2017                                                 2011    2012    2013    2014    2015     2016   2017

Source: ONTSI, 2018. Data 2017 (Last data available)                                                                                                                   10
Main Players. Overview

▪       Spanish companies are present and recognized in
        major international markets…

▪       Spain is a leader in advanced technologies:

    ❖    Spanish software for air-traffic control is worldwide
         renowned and used

    ❖    High-Tech and Defense Industry

    ❖    Telecommunications, Utilities, Energy, Banking…

                                                                 11
Main Players. Other Spanish Companies

                                        12
ICT Multinationals in Spain

Leading ICT multinationals are already successfully located in Spain, taking advantage of
Spain’s benefits:

 Software Vendors                               Hardware Vendors

Telecom equipment vendors                       Service Providers

ICT Services and Consulting Companies

                                                                                        13
Foreign Investment. Success Stories

The German company has been operating in Spain since 1895. The company currently has
a workforce of over 3,400 in Spain, with three factories (in Cornellá, Getafe and Rubí)
whose products are exported to all corners of the world, its HQ in Tres Cantos, and sales
offices in the major cities.

Siemens is currently making a decisive contribution to the modernization of the high-speed
rail network by installing cutting-edge safety and signaling systems. They have also helped
make sustainable mobility a reality in cities like Madrid, with the first electric car charging
station that uses the braking power of trains, and Barcelona, where modern signaling
systems have increased the efficiency of the metro lines.

Also, there has been a production and R&D center in Getafe since 1957 for portable
radiology equipment and imaging systems that form part of other diagnostic equipment.

HP has a strong commitment with Spain since 1971, with presence in cities such as
Madrid, Sant Cugat (Barcelona), Leon, Sevilla or Bilbao.

HP’s facilities in Sant Cugat (Barcelona), hosts one of the corporation’s most emblematic
R&D Business Centers outside the US. Sant Cugat employs over 1,700 highly qualified
professionals, with around 500 engineers working on R&D and innovation. Recently, these
facilities have also become the worldwide headquarters of HP’s 3D printing business.

HP’s commitment with Spain and the R&D is also shown in other centers as Leon
Competence Center, stablished in 2005 and focused on the creation of advance software
solutions for the printing and the computing organizations.                        14
Foreign Investment. Success Stories

Huawei launched its operations in Spain in 2001. Since then, they have been developing its
lines of business and establishing itself as a key organization in the Spanish ICT sector.

The company also has various joint innovation centers in Spain with Telefónica and
Vodafone. Huawei Spain is focused on providing customers with cutting-edge ICT solutions
and services. Their product portfolio includes wireless, fixed-line network and network core
solutions, data network technology, apps, software and terminals.

Huawei have created a workforce of over 1,000 employees, of which 85% are local. They
have a head office in Madrid, along with five further offices in Barcelona, Valencia, Seville, A
Coruña and Bilbao.

IBM was set up in Spain in 1926. Today the company coordinates the activities in Portugal,
Greece and Israel. The Spanish subsidiaries have over 7,200 employees.

The IBM environment includes very relevant projects developed in Spain:

Centre of excellence in Barcelona to develop solutions for financial entities and the health
sector; INSA, an IBM branch, has set up two centres (Caceres and Salamanca) for
software developments to be applied worldwide; MareNostrum, supercomputer installed
in the Barcelona Supercomputing Centre in collaboration with the University of Catalonia;
Technology Expert Council (TEC), which integrates IBM’s best talents in Spain to enhance
the leadership of the company and develop its technical knowledge.
                                                                                              15
Main Players. Associations

AMETIC
AMETIC, the Association of Electronics, Information and Communications Technologies, Telecommunications and Digital
Content Companies, is a point of reference in a sector which is one of the most dynamic in the Spanish economy and of
unique importance for the development of the country. AMETIC is one of the largest and most representative business
organizations in Spain, with over 3,000 members, comprising individual members and business groups, whose activities
are related to the electronics, information technologies and telecommunications sector.

                         C/ Príncipe de Vergara 74, 4ª planta - 28006 MADRID
                         Tel: +34 91 590 23 00
                         http://www.ametic.es

aDigital

The Spanish Association of Digital Economy, Adigital, integrates businesses and organizations interested in the
development of the digital economy for promoting and defending their interests.

                         C/ Entença 218, Entlo - 08029 BARCELONA
                         Tel: +34 93 240 40 70
                         http://www.adigital.org

CONETIC

The Spanish Confederation of Information Technology, Communications and Electronics Companies is a collaborative
project consisting of 14 Associations united in that same interest and actively working for the competitive improvement of
the more than 1,200 companies represented, promoting the development of the individual competences of the more than
55,000 professionals active in those companies, disseminate and facilitate the knowledge and application of technologies
in all sectors of the economy and society and thereby contribute to generate interest in ICT vocations and new talent for
the sector.

                         C/ Orense, 85 Edificio Lexington – 28020 MADRID
                         Tel: +34 91 567 84 54
                         http://www.conetic.info

                                                                                                                             16
Main Players. Government

Red.es
Red.es is the public corporate entity attached to the State Secretariat for the Digital Advancement (SEAD) from the
Ministry of Economy and Business. Their mission is developing programs to boost the digital economy, innovation,
entrepreneurship, training for young people and professionals and support to SMEs by promoting the efficient and
intensive use of Information and Communication Technologies (ICT). They also deploy technology implementation
programs in the public services of the Administration and work for the development of Intelligent Cities and Islands.

             Plaza Manuel Gómez Moreno s/n - 28020 Madrid
             Tel: +34 91 212 76 20
             e-mail: sugerencias@red.es
             http://www.red.es

ONTSI
The National Observatory for Telecommunications and the Information Society is a body attached to the public corporate
entity Red.es, the main objective of which is the monitoring and analysis of the Telecommunications and Information
Society sector.
ONTSI prepares, gathers, synthesizes and systematizes indicators, prepares studies and offers informative and updated
services relating to the Information Society and is currently the leading public Observatory of the Information Society in
Spain. ONTSI is also a meeting and dialogue point between the Information and Communications Technology sector and
the different public administration bodies, for the definition of policies and the subsequent evaluation thereof.

             Plaza Manuel Gómez Moreno s/n - 28020 Madrid
             Tel: +34 91 212 76 25
             e-mail: observatorio@red.es
             http://www.ontsi.red.es

Reports
▪   CNMC: Annual Report 2018
▪   ONTSI: Annual Report 2018
▪   Telefónica: Digital Society in Spain 2018

                                                                                                                             17
Important Operations (2017)

US video game developer Take-Two buys Spanish company Social Point for €235 million.

Take-Two Interactive Software, owner of Rockstar Games or 2K, has announced the
acquisition of Spanish social Point, dedicated to the development of video games for mobile
devices, for an aggregate amount of $250 million (€232.5 million), it said in a statement.

                                                                   El Economista, February 2017

Telefónica sells up to 40% of Telxius to KKR for €1,275 million.

                                                                      Expansión, February 2017

The technology firm Epson has inaugurated the new headquarters of the subsidiary in Sant
Cugat del Vallès. The Japanese multinational has ended 30 years of history in Cerdanyola to
move to a facility that welcomes a vision of the future that the firm has to transfer its
technological know how to everyday life. It is a space of 3,000 sqm which has meant an
investment of two million euros and where the hundred employees who up to date worked
in Cerdanyola have been moved.
                                                                     El periódico, February 2017

                                                                                              18
Important Operations (2017)

Hewlett Packard Enterprise has inaugurated in Las Rozas (Madrid) a new installation of
1,200 sqm. This center will accommodate all HPE technology solutions for the educational
community, its network of partners and startups.

                                                                 El Economista, May 2017

The Japanese company Ricoh, specialized in printing and digital services to companies, has
acquired Techno Trends, a Spanish company specialized in solutions of telepresence and
visual communication by distance. The operation will serve the Japanese to expand digital
transformation services to companies.

                                                                 La Vanguardia, July 2017

Chinese telecommunications giant Huawei has opened its new Center for Experiences and
Technological Demonstrations (CSIC) in Madrid, in which it aims to teach its customers the
added value of the technology it develops for telecom operators.

                                                                     Cinco Días, May 2017

                                                                                        19
Other Operations

                                                      Main Venture Capital Operations Published in 2016

                      Company                                     Private Capital Entity             Sector          Type of Operation

      Maxi Mobility Spain (Cabify)                  Rakuten                                      Internet        Late Stage Venture Capital
      Job&Talent                                    Atomico, Kibo Ventures                       Internet        Late Stage Venture
      Xperience Consulting (Userzoom)               Stepstone Group, TC Growth, Trident
                                                                                                 IT Services     Late Stage Venture
                                                    Capital
                                                    Seaya Ventures, Bankinter Capital Riesgo,
      Hundredrooms                                                                               Internet        Other early stage
                                                    Inveready Technology
                                                    Trident Cibersecurity, Adara Ventures,
      4IQ (former Survela)                                                                       Internet        Start up
                                                    Telefónica Ventures
      Salupro                                       Bonsai VC, Vitamina K                        Internet        Start up
      ABA English                                   Kennet Partners, Nauta Capital VC Partners   Internet        Other early stage
      iContainers Solutions                         Serena Capital, Kibo Ventures, Vitamina K    Internet        Other early stage
      Sherpa Europe                                 Alma Mundi                                   Software        Start up
                                                    Felix Capital, Unilever Ventures, Fung
      Olapic                                                                                     IT / Internet   Other early stage
                                                    Capital, Longworth Venture Partners

Source: Spanish Association of Capital, Growth and Investment. Report 2017.                                                              20
II. Competitive Advantages in ICT sector
Spain in Numbers

❖ In 2017, mobile lines reached the 52.5 million mark (112.9% penetration rate)

❖ There are over 145,000 stations all over the country for mobile telecommunications

❖ There are over 34 million internet users in Spain

❖ 86.7% of households are equipped with computers (desktop, laptop, netbook or tablet)
  and 83.4% of households are connected to Internet

❖ 93.4% of people over 15 years old have a mobile phone (76.3% if smartphone)

❖ Spain has 14.7M gamers that play 5.8 hours/week in average

❖ 98.7% of the companies in Spain are connected to internet and 87.4% of companies use
  some Open Source Software

❖ Spanish is the third most used language in the Web with over 515 million users, only
  after English and Chinese Mandarin

❖ In May 2019 the registered .es domains reached 1,923,199

❖ E-commerce turnover in Spain in 2017 was €31,347 million

❖ Spain is the European country with the largest FTTH network and 3rd country in the
  OECD

                                                                                       22
Infrastructure for Business Development

▪82 Science and Technology Parks throughout Spain        Airports: Business Infrastructure &
                                                         Tourist Main Entrance

                                                         ICT and Telecommunication Networks

                                                         Urban Transport: Smart Cities

                                   Source: FECYT, 2019

 Highways: Logistics Hubs     Railway: High Speed
 and Road Infrastructures     Networks                   Ports: World Logistics Platforms
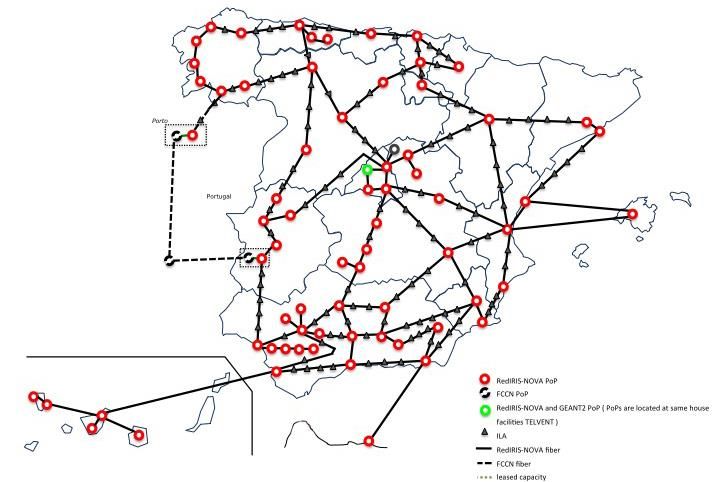
                                                                                            23
Infrastructures

                 Network Infrastructure Plan – RedIRIS Network (Network for the Scientific Community)

Source: RedIris, 2019                                                                                   24
Technology. Household & Business Penetration

       86.7% of households are equipped with computers (desktop, laptop, netbook or tablet):

                        ICT Household equipment in Spain                                          ICT in Spanish SMEs & Big Companies

                                      Computer                                                                            Computer
                                    100                                                                                  100

                                     80                                                               RFID
                                                                                                                          80                 Internet Connection
                                                                                                                          60
                                     60                        Smart TV / Flat
         Home Cinema                                                                                                      40
                                                                Screen TV
                                     40
                                                                                                                          20
                                     20                                                                                                             Internet Connection &
                                                                                 E-Commerces Sales                         0                              Web Page
                                       0

                                                                                                                                             Broadband (fixed or
           Video game                                                                     Big Data Analysis
                                                               Tablet                                                                             mobile)
             console

                                                                                                                     Social Networks

                                    DVD or Blu-Ray
                                        Player
                                   2016            2017
                                                                                      Total          10 - 49 employees         50 - 249 employees        250+ employees

Source: INE and ONTSI, 2018. Data 2017 (Last data available)                                                                                                        25
Broadband. Use of Internet

                Internet use in Spain by age range                                                   Internet use in Spain by level of education
                    Percentage of Internet users                                                             Percentage of Internet users

  120                                                                                       120

           98                                                                                                                               98         99.1
  100                97.4       96.7                                                        100                              95.6
                                           91.5
                                                                              86                                86.5                                              86

   80                                                 76.1                                   80

   60                                                                                        60     55.4

                                                                 46.5
                                                                                             40
   40

                                                                                             20
   20

                                                                                             0
    0                                                                                              Primary    Secondary Secondary Vocational          Tertiary   Total
         16 to 24   25 to 34   35 to 44   45 to 54   55 to 64   65 to 74     Total                Education   Education,   Education     Training,    Studies
                                                                           population                         First Level Second Level Higher Level

Source: INE and ONTSI, 2018. Data 2017 (Last data available)                                                                                                             26
E-commerce

        ❖ The spending in e-commerce in Spain in 2017 was €31,347 million. It means an
          increase of 23.6% with respect to 2016.

        ❖ The number of new online shoppers have increased 4.7% in 2017, totaling 22.9 million
          people.

                  Spain e-Commerce Turnover, (€ Million)                                            Online shoppers, 2011 - 2017

          40000                                                                                      Internet users / population 15 years old +
                                                                                                     Online shoppers / Internet users
                                                                       31,347                                                                             86,4
          30000                                                                                                                                   81.7
                                                                                                                                  80.8
                                                              25,354                                     73.1         76.1
                                                                                80           69.9
                                                    20,745                            66.7                                                                67,4
          20000                            16,259                               60
                           12,383 14,610                                                                                           64.3           65.9
                                                                                                            60.6        62.0
                  10,917                                                                      55.7
                                                                                40    50.7
          10000

                                                                                20
              0
                   2011     2012    2013    2014       2015     2016    2017    0
                                                                                      2011   2012        2013        2014        2015         2016       2017

        ❖ Clothing, accessories and sporting goods are the goods and services most demanded
          with 50.5%.

Source: INE and ONTSI, 2018 (Last data available)                                                                                                         27
Broadband. “.es” Domains

   In May 2019 the registered .es domains reached 1,923,199

   2.500.000

                                                                                                                                                                1,923,199
                                                                                                                                                              1,923,787
   2.000.000                                                                                                                                          1,890,026
                                                                                                                                                1,838,066
                                                                                                                                       1,795,037
                                                                                                                         1,696,5381,755,224
                                                                                                                    1,614,149

   1.500.000                                                                                                 1,458,371

                                                                                                        1,247,978
                                                                                                120,7832

                                                                                          108,2757

   1.000.000
                                                                                    805,327

                                                                              507,874
     500.000
                                                                        298,600

                                                                   85,309
                                                   43,476 71,158
               7,219 12,887 18,859 29,590 35,570
           0
               1997 1998 1999 2000 2001 2002 2003 2004 2005 2006 2007 2008 2009 2010 2011 2012 2013 2014 2015 2016 2017 2018 2019

Source: Red.es, 2019                                                                                                                                                      28
Government Support. Digital Agenda for Spain

  More than 2.4 Billion Euros allocated by the government to fulfil the
  Digital Agenda, assuming the Digital Agenda for Europe in 2020.
  It contains 106 lines of action structured around 6 main objectives:

Encourage the deployment of                   Develop the digital economy                     Improve e-government and
ultra-fast networks                                                                           digital public services
                                              ▪ 33% of SMEs make online purchases or
▪ At least 50% households 100 Mbps in 2020      sales                                         ▪ Increasing effectiveness and efficiency in
                                                                                                public Administrations
✓ Promote an improved user experience         ✓ Promoting the developmet of e-commerce
  and    promote     appropriate  service     ✓ Promoting an innovative industry of           ✓ Bringing the Administration to citizens
  conditions                                    digital content                                 and businesses
✓ Encourage the deployment of ultra-fast      ✓ Increasing     public-private  partnerships   ✓ Increasing the levels of use of
  broadband networks, optimizing the use        and      identify   and     maximize    the     eGovernment
  of radio spectrum and improve the             opportunities that are presented in this      ✓ Rationalize and optimize the use of ICT in
  experience for broadband users                new scenario                                    public administration

Building confidence in the                    Encourage R & D + i in the                      Supporting digital inclusion and
digital                                       industries of the future                        ICT training new professionals

▪ Establishment   of    capabilities    for   ▪ Double the total annual public spending on    ▪ Reduce to below 15% the percentage of
  monitoring and diagnosis of digital trust     research and ICT development, in 2020           population that has never used internet
  permanent                                   ▪ Leverage an equivalent increase in private
                                                spending                                      ✓ Promote inclusion and digital literacy
✓ Boost market confidence services                                                            ✓ Adapt training systems for digital training
✓ Strengthen existing capacities to           ✓ Increase     the   efficiency   of  public      and ICT training new professionals
  promote digital trust                         investment in R & D in ICT
✓ Promote excellence in the organizations     ✓ Encouraging private investment in R & D
  on digital trust                              in ICT
                                              ✓ Promote R & D in ICT in SMEs
                                              ✓ Expand the Spanish participation in R &
                                                D in ICT in the international arena

                                                                                                                                         29
Government Support. R & D

Spain has got many Institutions that promote incentives in different calls along the year

                 R&D:

                 The Centre for Industrial Technological Development (CDTI) has got a wide
                 range of grants and loans at competitive low interest rate for technological
                 projects.

                 The State Secretariat for Innovation in the Ministry of Science, Innovation
                 and Universities also offers support with grants and loans for technological
                 projects developed by companies and public bodies.

                 ICEX - INVEST IN SPAIN has developed a program for supporting foreign
                 companies up to €200,000 for investments with a high degree of R&D in
                 competitive tenders.

                 The National Innovation Company (ENISA) finances SMEs up to €1.5 million
                 with participative loans at a very competitive interest rate and where no-
                 guarantee is required.

                 The Public organization RED.ES promotes the IT activities of technological
                 companies and start-ups financing investments in infrastructures,
                 equipments and so on.

                                                                                            30
Talent at Competitive Cost

❖      Labour costs in Spain are below the EU-28 average
       (Spain is 21.3€/hour and EU-28 is 26.3€/hour)
❖      Favourable fiscal system for foreign investors and R&D
       activities
❖      40.9% of the population aged 25-34 have a tertiary
       education                                                                                                                                                                           Global MBA ranking 2018
                                                                                                                                                                            2018                School name                  Country
                                                                                                                                                                                    Stanford Graduate School of
                                                                                                                                                                              1                                             US
                                                                                                                                                                                    Business
                                                                                                                                                                              2     Insead                                  France
                                     Cost per hour Private Sector, 4Q 2017                                                                                                    3     University of Pennsylvania: Wharton     US
                                                    €/hour                                                                                                                    4     London Business School                  UK
50
                                                                                                                                                                              5     Harvard Business School                 US
45 43,6 41,7 41,7                                                                                                                                                             6     University of Chicago: Booth            US
40                  37,3 36,8                                                                                                                                                 7     Columbia Business School                US
                                34,5 34,1 33,7
35                                               33,4                                                                                                                         8     Ceibs                                   China
                                                        29,8                                                                                                                  9     MIT: Sloan                              US
30                                                             27,3 26,8 26,3
                                                                                                                                                                                    University of California at Berkeley:
                                                                                                                                                                              10                                            US
25                                                                              21,3
                                                                                                                                                                                    Haas
                                                                                                                                                                              11    Iese Business School                    Spain
20                                                                                     16,9 15,9
                                                                                                   14,3 13,4                                                                  12    Northwestern University: Kellogg        US
15                                                                                                             12,8 12,2
                                                                                                                           11,4 11,3
                                                                                                                                       9,2 9,2   9
                                                                                                                                                                              13    University of Cambridge: Judge          UK
                                                                                                                                                     8,5 8,2
10                                                                                                                                                                            14    HKUST Business School                   China
                                                                                                                                                               6,1
                                                                                                                                                                     4,9
 5                                                                                                                                                                            15    Yale School of Management               US
 0                                                                                                                                                                            16    Dartmouth College: Tuck                 US
                                                                                                                                                                              17    Cornell University: Johnson             US
                                                                                                                                                                                    National University of Singapore
                                                                                                                                                                             18
                                                                                                                                                                                    Business School                         Singapore
                                                                                                                                                                             19     Duke University: Fuqua                  US
                                                                                                                                                                             20     Esade Business School                   Spain
Source: Destatis 2018 (Federal Statistical Office Germany)
                                                                                                                                                                           Source: Financial Times 2018

                                                                                                                                                                                                                                    31
IT Labor Costs in Spain

    IT Labor costs in Spain

                                                 Experience                Experience              Experience               Experience
 Job Category
                                               (0-2 years)               (2-5 years)              (5-10 years)              (>10 years)
 Country Manager                          82 (20%) – 110 (40%)      105 (20%) – 146 (40%)    130 (20%) – 180 (40%)     142 (20%) – 200 (40%)
 Chief Information Officer                82 (10% ) – 105 (20% )    92 (10% ) – 115 (20% )   130 (10% ) – 160 (20% )             -
 IT Director                               53 (10%) – 67 (20%)       58 (10%) – 78 (20%)      68 (10%) – 88 (20%)       78 (10%) – 98 (20%)
 Chief Technology Officer                      42 – 53 (10%)              54 – 68 (20%)          72 – 90 (20%)            92 – 130 (20%)
 Chief Security Officer                        52 – 55 (10%)              68 – 72 (10%)          88 – 90 (20%)                   -
 Development Manager                           40 – 55 (10%)              46 – 65 (10%)          57 – 73 (10%)             65 – 80 (10%)
 SW Architect (Java, .NET, etc.)                37 – 47 (5%)              43 – 50 (5%)           55 – 60 (10%)             60 – 80 (10%)
 Team Lead (SW Development)                    33 – 45 (10%)              42 – 48 (10%)          47 – 53 (10%)             52 – 58 (10%)
 IT Business Analyst                        28 (5%) – 38 (10%)        32 (5%) – 43 (10%)       37 (5%) – 52 (10%)       43 (5%) – 60 (10%)
 Business Intelligence Consultant              26 – 35 (10%)              31 – 42 (10%)          36 – 55 (10%)             42 – 60 (10%)
 IT Security Consultant                            25 – 34                   30 – 40                 35 – 48                  43 – 57
 Java/J2EE Developer                            22– 27 (5%)               29 – 38 (5%)           36 – 46 (10%)             42 – 50 (10%)
 .NET Developer                                 23 – 28 (5%)              30 – 36 (5%)           34 – 42 (10%)             39 – 45 (10%)
 PHP Developer                                  23 – 27 (5%)              27 – 35 (5%)           33 – 40 (10%)             40 – 44 (10%)
 ERP Consultant (SAP mainly)                   25 – 35 (10%)              33 – 43 (10%)          38 – 50 (10%)             43 – 60 (10%)
 Mobile Apps Developer                          26 – 33 (5%)              31 – 40 (5%)           42 – 48 (10%)                   -
 CRM Consultant                             28 (5%) – 35 (10%)        32 (5%) – 42 (10%)       36 (5%) – 45 (10%)       42 (5%) – 54 (10%)
 Network Engineer                                  25 – 30                   26 – 32                 28 – 37                  31 – 42
 System Administrator                              21 – 31                   25 – 36                 31 – 42                  35 – 48

Data: Thousand € (In brackets, variable salary)
Study for the cities of Barcelona, Bilbao, Madrid, Seville and Valencia

Source: Guide of the labor market in Spain. Hays, 2018                                                                                   32
Spanish Language in Internet

      Spanish is the third most used language in the Web with over 515 million speakers
      around the world, only after English and Chinese

                                                                     Internet Users by language

                                           Percentage of Users                                                       Number or Users (millions)
              25,40%                                                                         English                                                             1055,3

                                19,30%                                                       Chinese                                             804,6

                                                         8,10%                               Spanish                       337,9

                                                                 5,30%                        Arabic                 219

                                                                    4,10%               Portuguese                169,1

                                                                    4,10%
                                                                                        Indonesian/
                                                                                                                  168,7
                                                                                         Malaysian

                                                                         3,20%                French         134,1

                                                                         2,90%           Japanese           118,6

                                                                          2,60%              Russian        109,5

                                                                            2,20%            German        92,1

                       22,80%                                                                  Other                                                     950,3

     30,00%        25,00%         20,00%      15,00%    10,00%       5,00%           0,00%             0      200          400     600     800           1000         1200

Source: Internet World Stats, 2019. Data December 2017 (Last data available)                                                                                                 33
Quality of Life

    Worldwide Cost of Living Ranking                                                   ❖   Spain is the 1st country in Europe in terms
                                                                                           of quality of life for ex-pats and 2nd-ranked
  Rank                Rank                 Rank                 Rank                       worldwide
   1     Singapore     11    Tokyo          21    Shanghai       30    London

   2     Paris         11    Osaka          22    Milan          30    Muncih          ❖   With large communities of many different
                                                                                           nationalities, Spain is known for its highly
   2     Zurich        13    New York       23    Shenzhen       30    Rome
                                                                                           cosmopolitan character. On average, 12.2%
   4     Hong Kong     14    Los Angeles    24    Auckland       34    Dusseldorf
                                                                                           of the Spanish residents are foreign-born,
   5     Oslo          14    Melbourne      24    Wellington     34    Barcelona           a figure that rises to 16-17% in regions
                                                                                           like Catalonia or Madrid
   6     Seoul         14    Reykjavik      26    Brisbane       34    Madrid

   6     Geneva        17    Vienna         26    Minneapolis    37    Washington DC
                                                                                       ❖   One of the largest number of International
   8     Copenhagen    18    Helsinki       28    Amman          37    San Francisco       Schools in Europe
   9     Tel Aviv      19    Frankfurt      28    Hamburg        37    Brussels

   10    Sydney        19    Dublin         30    Adelaide       37    Stockholm       ❖   Outstanding & modern health system with
Source: The Economist Intelligence Unit, 2018
                                                                                           very high standards

                                                                                       ❖   Favourable fiscal regime for expatriates

                                                                                       ❖   Law enforcement: Assurance & stability in
                                                                                           business and social life

                                                                                       ❖   Excellent climate, first-class gastronomy,
                                                                                           wide range of cultural and leisure activities

                                                                                                                                     34
Business opportunities

Spain offers interesting opportunities in
✓ 3D Printing
✓ Big Data
✓ Cyber Security
✓ Digital Entertainment – Video Games
✓ e-Government
✓ e-Health
✓ e-Justice
✓ FinTech
✓ Internet of Things
✓ Nearshore Platforms
✓ Open Source Activities
✓ Smart Cities
✓ Smart Grids
✓ Social Media – Social Business

                                            35
investinspain@icex.es
                              www.investinspain.org

Paseo de la Castellana, 278
28046. Madrid
: +34 900 349 000
You can also read