INTERIM RESULTS FY21 Investor Presentation - Sylvania Platinum
←
→
Page content transcription
If your browser does not render page correctly, please read the page content below
INTERIM RESULTS FY21
Investor Presentation

                        PAGE
DISCLAIMER
 • This document, which is personal to the recipient and has been issued by Sylvania Platinum Limited (the “Company”), comprises written materials/slides for presentations to be held in
   February 2021. This document does not constitute or form part of any offer or invitation to sell or issue, or any solicitation of any offer to purchase or subscribe for, any shares in the
   Company, nor shall any part of it nor the fact of its distribution form part of or be relied on in connection with any contract or investment decision relating thereto, nor does it constitute a
   recommendation regarding the securities of the Company.
 • This document has not been verified, does not purport to contain all information that a prospective investor may require and is subject to updating, revision and amending. The
   information and opinions contained in this document are provided as at the date of this presentation and are subject to change without notice. In furnishing this document, the Company
   does not undertake or agree to any obligation to provide the attendees with access to any additional information or to update this document or to correct any inaccuracies in, or
   omissions from, this document that may become apparent. Recipients of this presentation should each make their own independent evaluation of the Company and should make such
   other investigations as they deem necessary.
 • No reliance may be placed for any purposes whatsoever on the information or opinions contained in this document or on its completeness. No representation or warranty, express or
   implied, is given by or on behalf of the Company, its directors, officers or employees or any other person as to the accuracy or completeness of the information or opinions contained in
   this document and no liability whatsoever is accepted by the Company or any of its members, directors, officers or employees nor any other person for any loss howsoever arising,
   directly or indirectly, from any use of such information or opinions or otherwise arising in connection therewith.
 • This document and its contents are confidential and may not be reproduced, redistributed or passed on, directly or indirectly, to any other person or published, in whole or in part, for
   any purpose. This document is being made available only to and is directed at (i) persons having professional experience in matters relating to investments i.e. investment professionals
   within the meaning of Article 19(5) of the Financial Services and Markets Act 2000 (Financial Promotion) Order 2005, as amended (the "FPO"), (ii) persons in the business of
   disseminating information within the meaning of Article 47 of the FPO and (iii) high net-worth companies, unincorporated associations and other bodies within the meaning of Article 49
   of the FPO and (iv) persons to whom it is otherwise lawful to make this presentation available. The investment or investment activity to which this document relates is available only to
   such persons and will be engaged in only with such persons. Persons who fall outside categories (i)-(iii) above must check that they fall within category (iv). If they do not, they must
   return this presentation. Any person who does not fall within categories (i)-(iv) above may not rely on or act upon the matters communicated in this presentation.
 • The distribution of this document and the proposed transactions contemplated herein in certain jurisdictions may be restricted by law. No action has been taken by the Company that
   would permit an offering of shares or possession or distribution of this document or any other offering or publicity material relating to such shares in any jurisdiction where action for that
   purpose is required. Persons into whose possession this document comes are required by the Company to inform themselves about and to observe such restrictions.
 • The securities discussed in this presentation have not been, and will not be, registered under the United States Securities Act of 1933, as amended (the "Securities Act"), or qualified for
   sale under the law of any state or jurisdiction of the United States of America and may not be offered or sold in the United States of America except pursuant to an exemption from, or in
   a transaction not subject to, the registration requirements of the Securities Act. Neither the United States Securities and Exchange Commission nor any securities regulatory body of
   any state or other jurisdiction of the Unites States of America, nor any securities regulatory body of any other country or political subdivision thereof, has approved or disapproved of this
   presentation or the securities discussed herein or passed on the accuracy or adequacy of the contents of this presentation. Any representation to the contrary is unlawful.
 • Certain statements, beliefs and opinions in this document, are forward-looking, which reflect the Company’s or, as appropriate, the Company’s directors’ current expectations and
   projections about future events. By their nature, forward-looking statements involve a number of risks, uncertainties and assumptions that could cause actual results or events to differ
   materially from those expressed or implied by the forward-looking statements. These risks, uncertainties and assumptions could adversely affect the outcome and financial effects of
   the plans and events described herein. Forward-looking statements contained in this document regarding past trends or activities should not be taken as a representation that such
   trends or activities will continue in the future. The Company does not undertake any obligation to update or revise any forward-looking statements, whether as a result of new
   information, future events or otherwise. You should not place undue reliance on forward-looking statements, which speak only as of the date of this document.
 • By attending the presentation to which this document relates or by accepting this document in any other way you agree to be bound by the foregoing provisions.

                                                                                                                                                                                     PAGE       2
H1 FY21 AT A GLANCE

                PAGE
H1 FY21 GROUP SNAPSHOT
STRONG PERIOD OF RECOVERY

   PGM Feed Tons           PGM Recovery          PGM Production

     632,079                  55.66%               36,335oz
           3%                      3%                    9%

  (H1 FY2020: 615,980)     (H1 FY2020: 57.14%)   (H1 FY2020: 40,003oz)

  PGM Basket Price         Group Revenue         Group Cash Cost          Group EBITDA

   $3,184/oz                 $85.2m                 $739/oz                 $58.0m
          74%                    44%                    33%                     58%
  (H1 FY2020: $1,830/oz)   (H1 FY2020: $59.0m)   (H1 FY2020: $554/oz)    (H1 FY2020: $36.7m)

                               Net Profit            Basic EPS           Windfall Dividend

                             $40.5m                  14.90c
                                 70%                    77%              3.75 pence
                                                                          per ordinary share
                           (H1 FY2020: $23.9m)    (H1 FY2020: 8.42c)

                                                                                           PAGE   4
STRATEGY & FOCUS AREAS

     Strive to be a leading mid-tier, low unit cost, Platinum Group Metal (PGM) mining
                                         company by:

         Maintaining Safe & Profitable                               Progressing R&D and
                 Production                                           Exploration Projects
•   Navigate through the COVID-19 crisis                  • Progress R&D efforts in terms of fine-chrome
•   Maintain production profile at ~70,000oz PGM            beneficiation and PGM recovery to enable re-
                                                            treatment of treated historic dumps that would
•   Ensuring operational excellence
                                                            otherwise be sterilised
•   Optimisation of recently commissioned projects
                                                          • Determine how best to extract value from
•   Disciplined operating cost control and capital          Volspruit and Northern Limb exploration
    spend                                                   projects – focus on low risk and capital

     Strengthening License to Operate                           External Growth Opportunities
•   Maintain excellent relationship with host mines
    and continue to explore synergistic value-        •     Continue to exploring potential new PGM
    adding opportunities                                    tailings treatment opportunities – increased
•   Manage increasing community expectations in             activity in this space
    terms of commercial opportunities                 •     Investigating potential alternative open-cast and
•   Studies and permitting in terms of new tailings         underground ROM feed sources
    dam facilities and future mining projects

                                                                                                      PAGE      5
SAFEGUARDING OUR PEOPLE & ENVIRONMENT

           SAFETY & HEALTH                             ENVIRONMENT                        COVID-19 RESPONSE

•   Fatality–free at all operations      •   No significant environmental        •   No disruption to Operations in
    since inception                          incidents in past 5 years               H1

•   One LTI at Millsell during Sep ‘20   •   Minimal hazardous waste             •   39 infections within the
                                             generated due to nature of              organisation since COVID-19
                                             processing                              arrived in the country

•   Lost-Time Injury Frequency Rate      •   Innovative water scavenging
    per 200,000 man hours worked:                                                •   Proactive plan and strict guidelines
                                             initiatives implemented at Lesedi       in place to protect employees and
                                             and Tweefontein to reduce water         ensure compliance with national
                  0.27                       losses to seepage at tailings           regulation:
                                             facilities.                             • Work from home where possible
                                                                                     • Screening and monitoring
                                         •   Combined process water
     Achievements:                           consumption:
•   Tweefontein & Doornbosch LTI free                                            •   Support mechanisms and plans in
    for 8.5 years                                  ~2.3m3   per ton feed             place to support affected
                                                                                     employees and family members
•   Lesedi achieved 1-year LTI-free      •   PGM products utilised in green
    during Nov ‘20                           technologies

                                                                                                              PAGE    6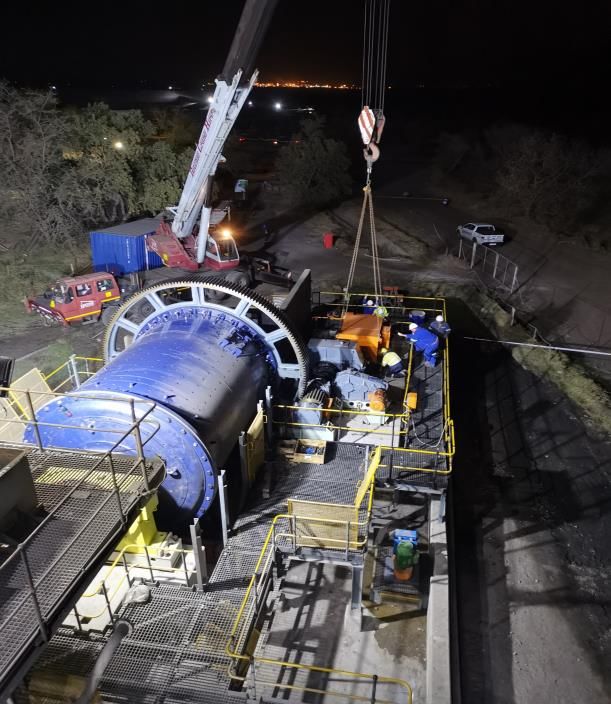
CARING FOR OUR PEOPLE & COMMUNITIES

                       EMPLOYEES                                            COMMUNITIES

•   Approximately 580 full time employees, 20%         •   Preferential employment from local communities
    female                                             •   Various intern and learnership programmes aimed
                                                           at metallurgical and artisan development from
•   Employee remuneration maintained irrespective of       communities
    COVID implications since start of pandemic
                                                       •   Focussed CSI community projects such as feeding
                                                           schemes and infrastructure support
•   Roll out of an Employee Dividend Entitlement
    Scheme during the period to facilitate employees   •   Local economic development through procurement
    sharing in the benefit of dividend awards              and business opportunities

                                                                                                   PAGE      7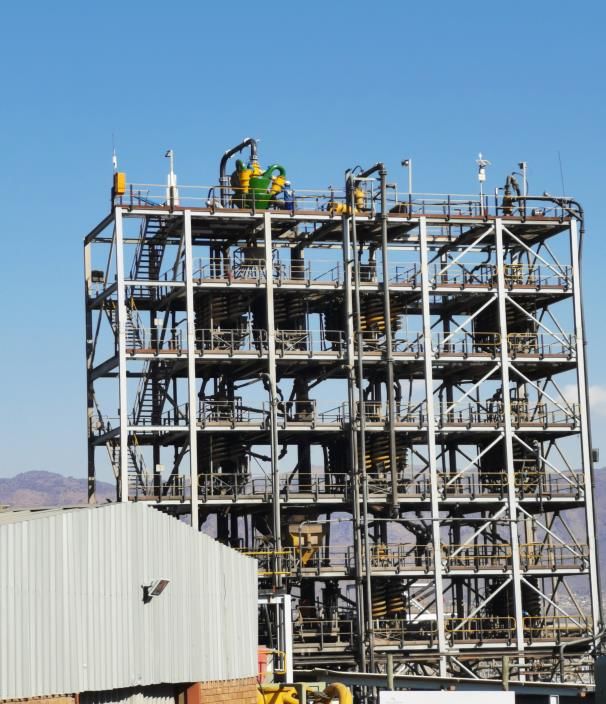
OPERATIONS AND
PROJECTS

                 PAGE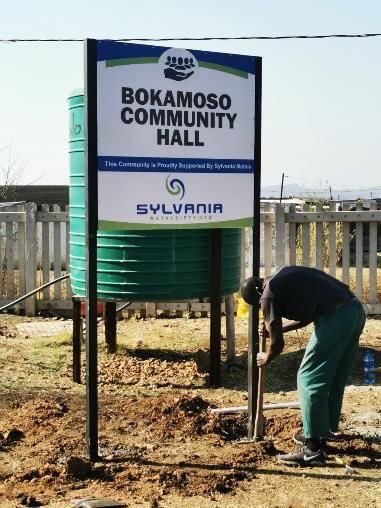
LOCATION OF OPERATIONS AND PROJECTS

▪   Six chrome beneficiation and platinum group metal (PGM) processing plants
▪   Mining rights for a number of PGM projects and a chrome prospect on the Northern Limb of the Bushveld
    Igneous Complex in South Africa.                                                              PAGE  9
PRODUCTION PROFILE
Production on track to achieve estimated target of 70,000oz 4E PGMs for FY2021
     ➢ H1 FY2021: 36,335 4E PGM ounces (H1 FY2020: 40,003);
     ➢ Profitable operational life of approximately eight to ten years1.
4E PGM
Ounce production
 80 000

 70 000                                                                                                                                                            Lesedi

 60 000                                                                                                                                                            Tweefontein

                                                                                                                                                                   Doornbosch
 50 000
                                                                                                                                                                   Mooinooi ROM *1
 40 000
                                                                                                                                                                   Mooinooi *1
 30 000
                                                                                                                                                                   Lannex
 20 000
                                                                                                                                                                   Steelpoort
 10 000
                                                                                                                                                                   Millsell
        -
               2008 2009 2010 2011 2012 2013 2014 2015 2016 2017 2018 2019 2020 2021E 2022E 2023E

 1 Remaining operational life can vary based on slow-down or increase of mining rates and production levels at host mines – current estimate based on combination of host mine
 historic production levels and includes impact of reduction in production rates following the announcement of retrenchments by the host mine during Jan ’20.
 2 Mooinooi Dump & Mooinooi ROM Plant production combined from FY2019 onwards as Mooinooi.
 3 Profile is subject to ore supply from host mines and may vary based on slow-down or increase of mining rates and production levels at host – current profile accounting for ~12month

 downturn impact during FY2021 and FY2022 related to subdued chrome market and associated retrenchments at host mine .                                                            PAGE    10
OPERATIONAL FOCUS AREAS
CHALLENGES HOW WE FARED
• Depressed chrome market necessitated host mines to scale back primary mining
operations at certain sites.
Lower fresh ROM • SDO operations increased plant feed tons to mitigate impact of resultant lower feed
and Current grades and PGM recovery at affected sites.
Arisings at host • Open cast mine material being used as supplementary feed.
mines • Continuous PGM flotation and reagent optimisation drive to optimise recoveries.
• Scale down of operations at host mines expected to last for at least another six to
twelve months.
• No power disruptions or production losses due to load-shedding during H1, but
Power utility increased vandalism and theft of copper cables from power utility substations impacted
infrastructure and supply.
supply issues • Identifying and evaluating alternative energy solutions in terms of either back-up or
primary supply remain a focus area.
• Despite a resurgence of COVID-19 in the country, there was no impact on production
during H1.
• Company continues to follow Government Regulations and implement measures to
ensure the health and safety of employees, as well as limit any future impact on
COVID-19
production.
pandemic
• Access to sites is restricted to employees and essential services for sustainable
production.
• Employees are able to continue to work from home where possible. PAGE 11
• Support structures in place for affected employees and family members.PROJECT FOCUS / GROWTH PIPELINE
2008 2013 2017 2020 2023
Creating Treatment Capacity Improving Process Efficiencies Unlocking Potential
Sylvania Dump Operations
Process Technology & R&D
Ultra-Fine Grinding » High Intensity Fine Chrome Technology & R&D
PGM Flotation » Ultra-Fine Project ECHO Fine Screening » Fine Cr Recovery
Constructing new plants (MF1)
Millsell » Steelpoort » Lannex » Mooinooi Screening (MF2) [Upgrading PGM feed » enable re-treatment of otherwise
Dump » Doornbosch » Mooinooi ROM » » Millsell (2017) sterilised resources]
Operational Excellence » Doornbosch (2018)
Tweefontein Re-Mining Optimization » Plant MF2 Milling & Flotation
» Mooinooi (2019)
Utilization » Flotation Stability » Met Lesedi (H1 FY2022) » Tweefontein (~H1 FY2023)
Staff Development
PGM Production Ramp-up: PGM Production Improvement: PGM Production:
~6,000oz to 45,000oz 4E PGM From ~45,000oz to 70,000oz 4E PGM ~68,000oz to 73,000oz 4E PGM
PGM Plant Feed: Ramp up to ~90,000tpm PGM Plant Feed: Increase to ~110,000tpm PGM Plant Feed: ~110,000tpm
PGM Recovery: ~40% 4E PGM Recovery: Increase from ~40% to ~55% PGM Recovery: Increase up to ~56%
Exploration & Test Work Permitting & Authorisations Resource & Process Optimization
Exploration Volspruit: Review and optimization of Mine and
Environmental & Social
Exploration Assets
» Volspruit (~3.1m oz PGM & 123kt Ni) Process Designs
» Northern Limb (~12m oz PGM & 115kt Ni) » Specialist Studies
» DRA engaged as Specialist Consultants since early-2020
» Community Engagement
Test Work » Study report expected during H2 FY2021
» Statutory Authorisations
» PGM Concentrator » DC Smelting Northern Limb Resource Optimization and
» CVMR Refining Approved Mining Rights
» Volspruit Conceptual Mining Design
Pre-Feasability » Northern Limb (Hacra & PPD) » EarthLab engaged as Specialist Consultants since mid-2020
Open Pit Mining » PGM Concentrator » In- » Grasvally (Cr Project – Held for Sale) » Interim findings reviewed during Nov ’20
house DC Smelter & CVMR Refinery » Additional 12-18month in-fill drilling program initiated
Revised Focus: Lower Risk & Low Capital Model
Original Scope: Large Mine & Treatment Facility
» Modular Concentrators at Higher Feed Grades
» Low Grade PGM Concentrate & In-house Smelting & Refining
» Saleable PGM Concentrate
PAGE 12CURRENT CAPITAL PROJECTS
Lesedi MF2 – estimated
commissioning during H1 FY2022.
Lannex ROM Milling and Spirals circuit
upgrade - commissioned during Q1.
Mooinooi Fine Screening – to be
commissioned during Q4.
PAGE 13FINANCIAL PERFORMANCE
PAGEREVENUE
FOR THE SIX MONTHS TO 31 DECEMBER 2020
Revenue increased Impact of increase Impact of decrease
44% to in basket price on in ounce production
revenue
$85.2m $5.4m
$31.6m
$’000
100 000
Total revenue split (6E)
0.0%, Au 2.4%, Ir
80 000
1.4%, Ru 19.5%, Pt
60 000
40 000
17.2%, Pd
20 000
59.5%, Rh
0
H1 F2020 Metal Price Volume H1 F2021 Pt Pd Rh Au Ru Ir
Variance variance
59,032 31,585 (5,413) 85,204
PAGE 15OPERATING COST
➢ SDO H1 FY2021 cash cost increased 48% against H1 FY2020
➢ Lower ounce production, higher re-mining cost due to less fresh current arisings and RoM, consulting costs, higher salaries and
wages and electricity cost;
➢ Higher royalty tax.
➢ Forecast to continue through H2 FY2021 and FY2022
Base Case $/oz cost -10% R/$ Exchange Rate +10% R/$ Exchange Rate
Cash Cost $/oz Nedbank CIB Outlook - Jan '21 SBG Securities Outlook - Jan '21
900
800
700
600
500
400
300
200
100
0
2018 2019 2020 2021E 2022E 2023E
ZAR Cash Cost (ZAR/oz)
R 6 951 R 7 549 R 9 569 R 11 403 R 11 885 R 11 175
Note:
- 2021 to 2023 Company Estimates based on 1 – 16 Feb ‘21 Spot exchange rate: 1 USD = 14.79 ZAR. Price assumptions for sensitivities, Nedbank CIB Outlook and SBG Securities
Outlook are tabled in Appendix 1.
Sour ce: Internal company data and forecasts Sylvania financial year -end is 30 June |
Disclaimer: The cash positions stated above are targets only and not a forecast of profits. There can be no PAGE 16
guarantee tha t the Company’s operations will generate the returns referred to above, and should not be
relied upon by prospective investors in forecasting the Company’s actual trading results .OPERATING COST
RELATIVE INDUSTRY POSITION
Sylvania remains a low cash cost PGM producer: SDO H1 FY2021 All-in Cost, including Capital is $801/oz (H1 FY2020:
$629/oz), in line with Nedbank CIB’s estimate of ~$797/oz based on 2020CY estimate and before Interim Results release
Western Limb Global PGM cash cost+capex curve (CY20E - at spot)
Northern Limb Cumulative annual production (4E Koz)
Eastern Limb and Zim
North America
0 500 1 000 1 500 2 000 2 500 3 000 3 500 4 000 4 500 5 000 5 500 6 000 6 500 7 000 7 500
50 000 50 000
Spot PGM basket price received
Cash cost and basket Price (R/oz)
45 000 45 000
40 000
Jaco to get Update from 40 000
35 000 Nedbank 35 000
30 000 30 000
25 000 25 000
20 000 20 000
15 000 15 000
10 000 10 000
5 000 5 000
Sylvania Dumps (SLP)
- -
Kroondal (SSW/AMS)
Mimosa (IMP/SSW)
Styldrift (RBP)
Mogalakwena (AMS)
Zondereinde (NHM)
Two Rivers (ARM/IMP)
Marikana (SSW)
Stillwater (SSW)
BRPM (RBP)
Mototolo (AMS)
Union (SIY)
LDI (IMP)
Booysendal (NHM)
Marula (IMP)
Modikwa (ARM/AMS)
Amandelbult (AMS)
Impala Mine (IMP)
Zimplats (IMP)
Rustenburg (SSW)
Unki (AMS)
Tharisa (THA)
Source: Nedbank Corporate & Investment Banking Cost Curve (costs after capex) Feb ‘21 – CY20E at Spot (R/$14.60, Pt = $1,220, Pd = $2,350, Rh = $21,600)
Sylvania updated FY2021 H1 Actual Cash Cost = $739/oz (R11,984/oz) & All-in Sustaining Cost = $801/oz (R12,988/oz) PAGE 17GROUP EBITDA FORECAST
➢ Stable PGM ounce production profile and significant increase in metal prices forecast;
➢ 2022 estimated EBITDA in line with ounce forecast and impact of host mine scale down.
Group EBITDA - US$
Base Case - SPOT
$160 000 000
$140 000 000 -10% Basket Price
$120 000 000
+10% Basket Price
$100 000 000
$80 000 000 -10% R/$ Exchange
$60 000 000
+10% R/$ Exchange
$40 000 000
Nedbank CIB Outlook
$20 000 000 - 14 Jan '21
$0 SBG Securities
2018 2019 2020 2021E 2022E 2023E Outlook - Jan '21
Note:
- 2021 to 2023 Company Estimates based on 1 – 16 Feb ’21 Spot metal prices and exchange rate: Pt = $1,169/oz; Pd = $2,321/oz; Rh = $20,000; Au = $1,828/oz; (4E
PGM Basket = $3,807/oz & 1 USD = 14.79 ZAR). Price assumptions for sensitivities, Nedbank CIB Outlook and SBG Securities Outlook are tabled in Appendix 1.
Sour ce: Internal company data and forecasts Sylvania financial year -end is 30 June |
Disclaimer: The cash positions stated above are targets only and not a forecast of profits. There can be no
guarantee tha t the Company’s operations will generate the returns referred to above, and should not be PAGE 18
relied upon by prospective investors in forecasting the Company’s actual trading results .CAPITAL EXPENDITURE
➢ FY2017 to FY2020 project capital primarily for Project ECHO and strategic projects contributing towards PGM ounce profile.
➢ FY2020 and FY2021 project capital includes Mooinooi proprietary chrome processing and classification optimisation project
and Lesedi MF2 secondary PGM flotation module, similar to other Project Echo modules.
➢ SDO stay-in-business (“SIB”) capital increase during next three years due to three new tailings dams to be constructed.
Capex $m
14 Other Capital -
Exploration, Etc.
12
SDO Project Capital
10
8
SDO SIB Capital
6
4 Total Capital: -10%
R/$ Exchange Rate
2
Total Capital: +10%
-
R/$ Exchange Rate
2018 2019 2020 2021E 2022E 2023E
Note: Lesedi acquisition cost not included in capex graph. FY2021 to FY2023 Base Case Estimates are based on ZAR/US$ exchange rate of R14,79/$.
SDO Capital spend is primarily in ZAR, hence US$ forecasts are impacted by exchange rate fluctuations
Source: Internal company data and forecasts Sylvania financial year -end is 30 June |
Disclaimer: The capital forecasts stated above are targets only should not be relied upon by prospective PAGE 19
investors in forecasting the Company’s actual trading results .CASH FLOW
Inflow from Outflow from Outflow from Windfall Dividend
operating activities investing activities financing activities
3.75 pence
$12.3m $2.6m $7.3m per ordinary
Share buy backs $1.4m
Operating profit before working
capital $58.4m Capital outflow $2.5m Dividend paid $5.9m
share
Increase in working capital
$32.4m
Forecast cash outflow
Interest income $0.8m $14.6m
Taxation paid $14.5m
USD
74 000
64 000
54 000
44 000
34 000
24 000
14 000
4 000
FY2020 Inflow from operating Outflow from investing Outflow from Foreign exchange H1 F2021
activities activities financing activities fluctuations
55,877 12,328 (2,593) (7,333) 8,817 67,095
PAGE 20RETURNING VALUE TO SHAREHOLDERS
Shareholder-friendly corporate strategy
➢ Operations generate positive free cash flow
➢ Disciplined capital spend
➢ No equity issuance since 2009
➢ Paying regular dividends
Special Windfall Dividend
➢ 3.75 pence “Windfall Dividend” per ordinary share
➢ Based on higher than anticipated Pd & Rh price performance for the 2020 calendar year
Cash Dividends Share Buybacks
➢ Cash returned to shareholders through dividends ➢ Opportunistic buy back of shares
➢ Commenced dividend payments in FY2018 ➢ Satisfy bonus share awards from shares bought
➢ Paid a dividend of 1.60 pence per ordinary share back preventing dilution to shareholders
for FY2020 (FY2019: 0.78 pence) ➢ Bought back ~47 million shares and cancelled ~12
million shares since FY2015
PAGE 21PGM BASKET
PAGEGROSS PGM METAL PRICE TREND
Actual FY2021 H1
PGM Prill Split
Au
Rh 0,2%
12,7%
Pd
23,7%
Pt
63,3%
Sylvania Revenue Distribution ➢ PGM Basket price increase primarily driven
70%
60% by Rhodium (167% up) and Palladium
50%
40%
(27% up);
30% ➢ ZAR 4E PGM Basket price was 83% higher
20%
10% - combination of higher dollar basket price
0%
Ru, Ir &
Pt Pd Rh Base Au and ZAR/$ exchange rate.
Metals
FY2020 H1
30,51% 25,23% 38,04% 6,21% 0,01%
Revenue
FY2021 H1 PAGE 23
19,42% 17,18% 59,25% 4,13% 0,02%
RevenuePGM PRICE FORECASTS
2 500 2 500
$/oz
$/oz
Pt 2 000 Pd 2 000
1 500 1 500
1 000 1 000
500 500
- -
2021 2022 2023 2021 2022 2023
Nedbank CIB - 14 Jan '21 $1 050 $1 000 $ 950 Nedbank CIB - 14 Jan '21 $2 000 $1 500 $1 200
SBG Securities - 28 Jan '21 $1 000 $1 000 $1 100 SBG Securities - 28 Jan '21 $2 400 $2 500 $2 000
Liberum - 29 Jan '21 $1 100 $1 100 $1 100 Liberum - 29 Jan '21 $2 400 $2 400 $1 750
25 000 5 000
$/oz
$/oz
Rh 20 000 4E 4 000
15 000 3 000
10 000 2 000
5 000 1 000
- -
2021 2022 2023 2021 2022 2023
Nedbank CIB - 14 Jan '21 $15 000 $8 000 $5 000 Nedbank CIB - 14 Jan '21 $3 069 $2 020 $1 531
SBG Securities - 28 Jan '21 $18 500 $20 000 $18 000 SBG Securities - 28 Jan '21 $3 586 $3 802 $3 483
Liberum - 29 Jan '21 $20 000 $20 000 $20 000 Liberum - 29 Jan '21 $3 838 $3 838 $3 674
Sources:
- Nedbank CIB Outlook – 14 January 2021 price assumptions are based on “PGM Sector Industry Insight: 2021 Outlook – Higher for Longer, 14 January 2021”, published by analyst
Arnold van Graan (ArnoldVa@Nedbank.co.za);
- SBG Securities Outlook – 28 January 2021 price assumptions are based on “Diversified Mining – Commodities” continued resilience, 28 January 2021, www.standardbank.com/research.
- Liberum Forecast – “Sylvania Platinum: Dissecting the rhodium bear case – 27 January 2021”, published by Ben Davis (ben.davis@liberum.com) PAGE
24SUMMARY
PAGEWHY SYLVANIA?
Low Risk Attractive
Proven Track
Sustainable Shareholder
Record
Business Returns
Attractive PGM
Strong Free
Basket - unique Healthy Cash
Cash Flow
exposure to Resources
Generation
Rhodium
Experienced Disciplined
Solid Growth
Management Capital
Opportunity
Team Allocation
PAGE 26CONTACT US
Sylvania Platinum Limited
• Jaco Prinsloo +27 11 673 1171
• Lewanne Carminati +27 11 673 1171
Liberum Capital Limited (NOMAD)
• Richard Crawley / Scott Mathieson / +44 20 3100 2000
Edward Phillips SylvaniaPlatinum@liberum.com
Alma PR Limited (Communications)
• Justine James / Helena Bogle / +44 20 3405 0208
Josh Royston / Faye Calow Sylvania@almapr.co.uk
Sylvania financial year-end is 30 June | Source: Internal company data and forecasts PAGE 27APPENDICES
PAGEAPPENDIX 1 – METAL PRICE ASSUMPTIONS
Sylvania FY2021 to FY2023 Estimates -10% Basket Price +10% Basket Price
1 2 3
- Current Spot Prices - 1 - 16 Feb '21 Sensitivity Sensitivity
2021 2022 2023 2021 2022 2023 2021 2022 2023
Pt $/oz 1 169 1 169 1 169 Pt $/oz 1 052 1 052 1 052 Pt $/oz 1 286 1 286 1 286
Pd $/oz 2 321 2 321 2 321 Pd $/oz 2 089 2 089 2 089 Pd $/oz 2 553 2 553 2 553
Rh $/oz 20 000 20 000 20 000 Rh $/oz 18 000 18 000 18 000 Rh $/oz 22 000 22 000 22 000
Au $/oz 1 828 1 828 1 828 Au $/oz 1 645 1 645 1 645 Au $/oz 2 011 2 011 2 011
US$/ZAR 14.79 14.79 14.79 US$/ZAR 14.79 14.79 14.79 US$/ZAR 14.79 14.79 14.79
4E Basket - US$/oz 3 817 3 817 3 817 4E Basket - US$/oz 3 435 3 435 3 435 4E Basket - US$/oz 4 198 4 198 4 198
4E Basket - ZAR/oz 56 450 56 450 56 450 4E Basket - ZAR/oz 50 805 50 805 50 805 4E Basket - ZAR/oz 62 095 62 095 62 095
Sylvania FY2021 to FY2023 Estimates -10% ZAR/$ Exchange Rate +10% ZAR/$ Exchange Rate
6 4 5
- Nedbank CIB Outlook - 14 Jan '21 Sensitivity Sensitivity
2021 2022 2023 2021 2022 2023 2021 2022 2023
Pt $/oz 1 050 1 000 950 Pt $/oz 1 169 1 169 1 169 Pt $/oz 1 169 1 169 1 169
Pd $/oz 2 000 1 500 1 200 Pd $/oz 2 321 2 321 2 321 Pd $/oz 2 321 2 321 2 321
Rh $/oz 15 000 8 000 5 000 Rh $/oz 20 000 20 000 20 000 Rh $/oz 20 000 20 000 20 000
Au $/oz 1 800 1 800 1 800 Au $/oz 1 828 1 828 1 828 Au $/oz 1 828 1 828 1 828
US$/ZAR 16.50 16.50 16.50 US$/ZAR 13.31 13.31 13.31 US$/ZAR 16.27 16.27 16.27
4E Basket - US$/oz 3 036 2 003 1 521 4E Basket - US$/oz 3 817 3 817 3 817 4E Basket - US$/oz 3 817 3 817 3 817
4E Basket - ZAR/oz 50 101 33 051 25 092 4E Basket - ZAR/oz 50 805 50 805 50 805 4E Basket - ZAR/oz 62 095 62 095 62 095
Sylvania FY2021 to FY2023 Estimates
7 1Current Spot Prices are based on the average of actual PGM metal prices (Pt, Pd and Au from Kitco.com and Rh from
- SBG Securities - 28 Jan '21
2021 2022 2023 S&P Global Platts Metals Week) ZAR/$ exchange rate (SARB www.reserve.co.za) for 1 to 16 February 2021;
Pt $/oz 1 000 1 000 1 100 2-5Positive and negative 10% sensitivities are applied to Current Spot Prices for individual metals and exchange rate
Pd $/oz 2 400 2 500 2 000
respectively;
Rh $/oz 18 500 20 000 18 000
Au $/oz 2 000 2 000 1 843 6Nedbank CIB Outlook – 14 January 2021 price assumptions are based on “PGM Sector Industry Insight: 2021 Outlook –
Higher for Longer, 14 January 2021”, published by analyst Arnold van Graan (ArnoldVa@Nedbank.co.za);
US$/ZAR 14.97 15.15 15.04
7 SBG Securities Outlook – 28 January 2021 price assumptions are based on “Diversified Mining – Commodities’ continued
4E Basket - US$/oz 3 546 3 759 3 442 resilience, 28 January 2021, www.standardbank.com/research.
4E Basket - ZAR/oz 53 076 56 941 51 773 PAGE 29SHARE STRUCTURE AND OWNERSHIP
CAPITALISATION SUMMARY – 31 DEC 2020 TOP SHAREHOLDERS
21,06%
Africa Asia Capital
19,06%
• Listed: AIM Hargreaves Lansdown Asset 11,43%
Management 13,08%
• Domiciled: Bermuda 6,90%
Interactive Investor
7,73%
• Ticker symbol: SLP LN 6,19%
Miton Asset Management
7,13%
• Basic shares outstanding 1: 272,608,615 8,08%
FIL Investment International
6,21%
• Share price 2: 87.4 p AJ Bell Group
4,39%
5,12%
• Market capitalisation 2: $ 323 m Barclays Wealth
3,83%
3,96%
• Cash position: $ 67.1 m Banque Cantonale Vaudoise
3,27%
3,41%
• Undrawn overdraft facility: ZAR 28 m Halifax Share Dealing Clients 3,00%
(HSDL) 2,87%
Sylvania Platinum Ltd Directors 1,78%
& Company Related Parties 2,32%
Note:
¹ Excludes 14,237,042 shares held in Treasury 0% 5% 10% 15% 20% 25%
2 Share Price at 31 Dec 2020 87.4 pence and Exchange rate at 31 Dec 2020,
1 GBP = 1.35777 USD % Shareholding % Shareholding % Shareholding
30 Jun '20 30 Sep '20 31 Dec '20
Source: Sylvania Platinum
Sylvania financial year-end is 30 June | Source: Internal company data and forecasts PAGE 30FY2021 H1 VS FY2020 H1 PRODUCTION SUMMARY
USD ZAR
Unit Unaudited Unit
HY1 2020 HY1 2021 % Change % Change HY1 2021 HY1 2020
Production
1,348,769 1,421,445 5% T Plant Feed T 5% 1,421,445 1,348,769
2.28 1.93 -15% g/t Feed Head Grade g/t -15% 1.93 2.28
615,980 632,079 3% T PGM Plant Feed Tons T 3% 632,079 615,980
3.54 3.20 -10% g/t PGM Plant Feed Grade g/t -10% 3.20 3.54
57.14% 55.66% -3% % PGM Plant Recovery % -3% 55.66% 57.14%
40,003 36,335 -9% Oz Total 4E PGMs Oz -9% 36,335 40,003
53,062 49,244 -7% Oz Total 6E PGMs Oz -7% 49,244 53,062
1,830 3,184 74% $/oz Average gross basket price R/oz 83% 48,296 26,336
Sylvania financial year-end is 30 June | Source: Internal company data and forecasts PAGE 31FY2021 H1 VS FY2020 H1 FINANCE SUMMARY
APPENDIX 2 – FY2020 VS FY2019 FINANCIAL SUMMARY
USD ZAR
Unit Unaudited Unit
HY1 2020 HY1 2021 % Change % Change HY1 2021 HY1 2020
Financials
50,960 77,545 52% $’000 Revenue (4E) R’000 68% 1,257,824 748,964
Revenue (by-products and base
3,375 3,341 -1% $’000 R’000 9% 54,194 49,618
metals)
4,697 4,318 -8% $’000 Sales adjustments R’000 1% 70,050 69,027
59,032 85,204 44% $’000 Revenue R’000 59% 1,382,068 867,609
21,340 26,156 23% $’000 Operating costs R'000 35% 424,261 313,639
1,155 1,119 -3% $’000 General and administrative costs R'000 7% 18,154 16,976
36,650 58,026 58% $’000 Group EBITDA R'000 75% 941,223 538,656
444 574 29% $’000 Net Interest R'000 43% 9,316 6,530
9,752 16,864 73% $’000 Taxation R'000 91% 273,540 143,322
3,434 1,203 -65% $’000 Depreciation and amortisation R'000 -61% 19,514 50,475
23,909 40,534 70% $’000 Net profit R'000 87% 657,485 351,388
3,110 2,488 -20% $’000 Capital Expenditure R’000 -12% 40,350 45,710
33,817 67,095 98% $’000 Cash Balance R'000 108% 986,406 474,791
S y l v a n i a- f i n a n c i a l y- e a r - e n -d is 30 J uR/$
ne | Source: I n t e Ave
r n a l R/$
comrate
pany data and f o R/$
recasts 10% 16.22 PAGE 3214.70
- - - R/$ Spot R/$ rate R/$ 5% 14.70 14.04FY2021 H1 VS FY2020 H1 UNIT COST/EFFICIENCIES
APPENDIX 2 – FY2020 VS FY2019 FINANCIAL SUMMARY
USD ZAR
Unit Unaudited Unit
HY1 2020 HY1 2021 % Change % Change HY1 2021 HY1 2020
Unit Cost/Efficiencies
530 710 34% $/oz SDO Cash Cost per 4E PGM oz R/oz 48% 11,511 7,795
400 524 31% $/oz SDO Cash Cost per 6E PGM oz R/oz 45% 8,494 5,876
554 739 33% $/oz Group Cash Cost Per 4E PGM oz R/oz 47% 11,984 8,140
418 545 30% $/oz Group Cash Cost Per 6E PGM oz R/oz 44% 8,843 6,137
569 751 32% $/oz All-in sustaining cost (4E) R/oz 46% 12,188 8,356
629 801 27% $/oz All-in cost (4E) R/oz 41% 12,988 9,242
Sylvania financial year-end is 30 June | Source: Internal company data and
forecasts PAGE 33TYPICAL SDO PROCESS FLOW SHEET
Chrome
Current Arisings from Beneficiation
Current Arisings from
Host Mine Plant
Lanxess Plants (Spirals & WHIMS)
Saleable Chrome
Product
Dump Feed from
Dormant Tailings Dam
Coarse
Tails
Fines to
ROM Feed * PGM Plant
Final Tailings Dam
MG2
ROM
MF2 PGM
ROM Fines
Milling & Flotation
Crushing / Fine Tails
Screening / HMS Classification
& Milling
Waste
PGM Concentrate
to Smelter
*Mooinooi Only
➢ Generic process flow sheet for Sylvania’s Dump Operations
➢ Treating combination of ROM chrome ore (Mooinooi ROM Plant only), and current and historical chrome tailings material
➢ Recover and return chrome product to host-mine & Generate cash from recovery and sale of PGMs
➢ Millsell, Doornbosch, and Mooinooi operations operating MF2 (2-stage) Milling and Flotation Circuits;
➢ Lannex, Tweefontein, and Lesedi operations operating single-stage MF1 Milling and Flotation Circuits (Tweefontein expected to be converted to
MF2 during FY2022 as last module of initial Project Echo & Lesedi MF2 project initiated during FY2021).
Sylvania financial year-end is 30 June | Source: Internal company data and forecasts PAGE 34TYPICAL PGM CONCENTRATE METAL PRILL SPLITS
➢ Sylvania Rhodium percentage typically higher than average UG2 and Merensky ores, and
Palladium portion lower
Typical PGM Prill Splits
100%
90%
80%
70%
60%
50%
40%
30%
20%
10%
0%
Sylvania Typical Typical
Sylvania LG6 Sylvania MG2
Combined UG2 Merensky
Au 0.2% 0.2% 0.2% 0.4% 3.6%
Rh 12.7% 16.5% 11.0% 10.0% 3.4%
Pd 23.7% 23.9% 23.7% 40.6% 27.7%
Pt 63.3% 59.4% 65.1% 49.0% 65.3%
Sylvania financial year-end is 30 June | Source: Internal company data and forecasts PAGE 35SDO CASH OPERATING COST BREAKDOWN
Other
Work in Progress 2% Sylvania Shared Sylvania Dump Operations
Inventory Cost Services Charge FY2021 H1 Actual
COVID-19 0% 3%
1% Cash Cost Breakdown
Royalties Tax
8%
Salary & Wages
Equipment Hire
34%
2%
Safety , PPE & Insurance
2%
Electrical
Consumption
12%
Tailings Deposition
3%
Contractors/Consultants
Laboratory & R&D Cost 2%
3%
Production Maintenance & Re-Mining Cost
Consumables 9%
10%
Maintenance (Incl. Majors Travel & Transport Cost
& Abnormals) 3%
8%
PAGE 36BOARD OF DIRECTORS
Stuart Angus Murray Jaco Prinsloo Lewanne Carminati
Independent Non-executive Managing Director & Chief Financial Director & Chief
Chairman Executive Officer Financial Officer
Mr Murray has over 30 years of executive Mr Prinsloo has been appointed as CEO Ms Carminati joined Sylvania in 2009 and
experience in the Southern African platinum and admitted to the SLP Board since March in 2011 was appointed as Executive
sector, commencing his career at Impala 2020. Since January 2012 he has served in Officer: Finance for the South African
Platinum’s Refineries in 1984 and holding a senior positions at Sylvania, initially as operations, before being appointed Finance
number of positions at Impala Platinum, Executive Officer operations and as Director & Chief Financial Officer of
Rhodium Reefs, Barplats, and Middelburg Managing Director of the South African Sylvania Platinum, effective 29 February
Steel and Alloys, before joining Aquarius operations from March 2014 until his 2020. She has gained substantial and
Platinum Limited in 2001 as Chief appointment to his current position. diverse experience in the various aspects
Executive Officer, until 2012. He was a Prior to joining Sylvania Jaco was principal of financial management at a senior level,
non-executive director of Talvivaara Mining metallurgist at Anglo American for Anglo with a particular focus on compliance,
Company Plc, and is the Chairman of Operations Limited, which followed eight governance and financial reporting,
Imritec Limited, an aluminium by-products years at Anglo American Platinum Limited including investor relations. She has also
recycler. since 2002 in various senior metallurgical taken a leadership role in corporate finance
positions across the group. transactions.
Eileen Carr Roger Williams
Independent Non-Executive Independent Non-Executive
Director Director
Ms Carr, who joined the SLP Board in May Mr Williams is a Chartered Accountant with
2015, is a Chartered Certified Accountant over 20 years’ international experience in
with an MSc in Management from London mining finance and holds an honours
University and is a SLOAN Fellow of degree in French and Spanish. After
London Business School. She has over 30 joining Randgold Resources in 1997, he
years of experience within the resources was appointed Group Finance Director in
sector. She held various executive 2002. Mr Williams went on to become
directorships since her first appointment as Chief Financial Officer of JSE-listed AECI
Finance Director of Cluff Resources in Limited. He has served on a number of
1993, including CFO for Monterrico Metals boards in the mining and mining services
plc. Her first non-executive role was for sectors and is currently a non-executive
Banro Corp in 1998 and, more recently, director of Digby Wells Environmental and
non-executive director for Talvivaara Mining part-time CFO of a privately-owned mining
Co. Currently, Ms Carr is a non-executive company.
director of Bacanora Lithium plc.
PAGE
37You can also read