EM Debt and the US Dollar Cycle - The Rohatyn Group
←
→
Page content transcription
If your browser does not render page correctly, please read the page content below
August 2020

                                     EM Debt and the US Dollar Cycle
 Executive Summary                                              benefit from important mitigating factors.

 A great number of EM countries have been                       Within other large and liquid EM countries, Turkey and
 implementing an unprecedented fiscal and monetary              Romania present moderate vulnerabilities associated
 policy response to the COVID-19 shock. The capability          with high external debt (mostly corporate) for the
 to put in place counter-cyclical policies reflects vast        former and significant twin deficits for the latter.
 improvements in their economic fundamentals.
                                                                Smaller EM countries with less flexible and more
 However, despite these efforts being more than
 justified by the severity of the health crisis, their cost     overvalued exchange rates including Zambia, Sri Lanka,
 could be long lasting. Higher levels of public debt are        Pakistan, Angola, Oman, Nigeria, Kenya, and Egypt
 likely to reduce fiscal space and increase risks to            present the greatest degree of vulnerability.
 financial stability in the future if overall fiscal deficits   A debt sustainability analysis suggests that the largest
 are not brought back to levels consistent with debt            fiscal adjustments are required in South Africa, Saudi
 stability once the crisis passes.                              Arabia, Kenya, Nigeria, Brazil, Turkey, and Ghana.
 In our previous report, we argued that current                 2. Will these changes present an impediment to EM
 macroeconomic conditions are consistent with a high               currencies benefitting from a multi-year US Dollar
 probability that a USD depreciation cycle will begin              weakening cycle?
 once the US exits recession. This thesis has gained
 increasing conviction among market participants as the         We do not think so. Although fiscal deficits and
 dollar index (DXY) has depreciated 4% since July. We           government debt stand higher compared to the
 also noted that EM currencies are significantly                beginning of the last three cycles of USD depreciation,
 undervalued and have historically performed well in            external debt to GDP is comparable to the last major
 environments of dollar weakness, prompting investors           USD depreciation cycle of 2002 and inflation is
 to ask whether this will once again hold true given the        substantially lower.
 rapidly increasing debt burdens across emerging
 economies.                                                     Moreover, historically during periods of USD
                                                                depreciation, high fiscal risk currencies, as measured
 In this report, we seek an answer to this query by             by a combination of low GDP growth, high government
 deconstructing the topic into three component                  debt, low fiscal balance and low current account have
 questions:                                                     generated higher returns than currencies with low
                                                                fiscal risk (13.7% per annum vs 10.2% per annum).
 1. How is the EM debt landscape going to look after            However, the return/volatility ratio is better for low-
    COVID-19 and how does it compare to previous                risk currencies (2.4 vs 1.9).
    EM debt cycles?
                                                                3. How do we expect currencies with above average
 According to IMF forecasts and TRG calculations, the              debt metrics perform relative to currencies with
 median EM fiscal deficit in 2020 is expected to reach             below average debt metrics?
 7% of GDP, the largest on record, and drive the average
 EM debt level to increase by around 10% of GDP                 For this analysis, we created two portfolios; the first
 between the end of 2019 and the end of 2021.                   with EM currencies presenting the highest level of
 Most of the increase in fiscal deficits is expected to be      fiscal risk and the second those with the lowest. We
 financed by local savings however, a major difference          project that a 10% decrease in the US REER will
 from historical debt crises. Current account deficits          translate into a return of 15.4% for high-risk countries
 remain relatively narrow, with the median expected to          and 10.2% for low-risk countries. In the alternative
 be 1.8% of GDP for this year.                                  scenario of an increase in the US REER by 10%, the
                                                                forecasted return is -11.9% for the high-risk portfolio,
 Large and systemically important EM countries (BRIC)           and -8.9% for the low-risk portfolio.
 present either internal or external imbalances, but also
    PLEASE SEE THE END OF THIS DOCUMENT FOR IMPORTANT INFORMATION AND DISCLAIMERS.
The Rohatyn Group                                                                                                          1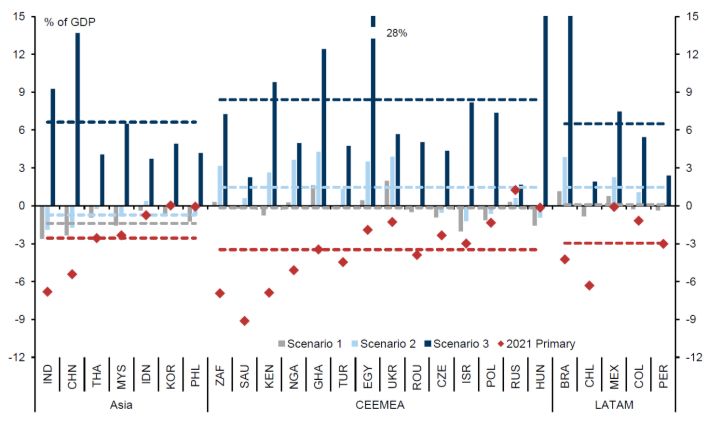
EM DEBT AND THE US DOLLAR CYCLE - CONFIDENTIAL
                                                                                                           AUGUST- 2020

1. How is the EM debt landscape going to look               Domestic vulnerabilities often amplified external
   after COVID-19 and how does it compare to                shocks.
   previous EM debt cycles?                                 How large is the current level of fiscal easing in EM?
We start with some historical context. The global           For a set of 36 EM economies, the median fiscal deficit
economy has experienced four waves of rapid debt            in 2020 is expected to reach 7% of GDP, according to
accumulation in emerging markets over the past 50           IMF forecasts and TRG calculations. This is the largest
years (see Kose et al 2020, Fig 1):                         median fiscal deficit on record. The increase in fiscal
                                                            deficit from 2019 is 4.7% of GDP. This is also the largest
a. The first wave happened in the 1970s and 1980s           fiscal expansion on record since 1980 and 1.5
   due to borrowing by governments in Latin America         percentage points greater than during the Global
   and low-income countries in sub-Saharan Africa.          Financial Crisis. Although the current consensus expects
                                                            mild fiscal consolidation in 2021, mainly due to an
b. The second wave ran from 1990 until the early
                                                            increase in revenues, the estimates are for the
   2000s, as banks and corporations in East Asia and        consolidation to be equal to less than half of the total
   the Pacific, and governments in Europe and Central       deterioration in the fiscal balance. See Fig 2.
   Asia borrowed heavily.
                                                            Figure 2: Internal and External Balances (Median EM)
c. The third wave was a run-up in private sector
   borrowing in Europe and Central Asia that started
   around 2002 and ended in 2007.
d. The current wave of debt accumulation started in
   2010 and stands out for its exceptional size and
   speed, and the increase in private debt.
These waves lasted about eight years on average, during
which time government debt typically increased by 30
percent of GDP, and private debt by 15 percent of GDP.
                                                            Source: IMF WEO
Figure 1: Public Debt as % of GDP
                                                            The median projected current account deficit, on the
                                                            other hand, is relatively narrow at 1.8% of GDP this year.
                                                            This gap implies that most of the increase in the fiscal
                                                            deficit (5% out of 7%) is expected to be financed by local
                                                            savings, a major difference from previous crises. See Fig
                                                            3.
                                                            Figure 3: Fiscal Impulse of Median EM country

Source: IMF Fiscal Monitor

Of the 520 episodes of debt accumulation in various
countries which comprise these waves, about half were
followed by financial crises. Each of the four waves
began during periods of low real interest rates and
ended with crises typically triggered by external shocks,   Source: IMF WEO.
such as a sudden increase in global interest rates.

     PLEASE SEE THE END OF THIS DOCUMENT FOR IMPORTANT INFORMATION AND DISCLAIMERS.
The Rohatyn Group                                                                                              2
EM DEBT AND THE US DOLLAR CYCLE - CONFIDENTIAL
AUGUST- 2020
Where is EM default risk highest in this environment? Macro-exchange rate risk: arises from a combination of
low growth and relatively fixed exchange rates. Table 3
We follow the methodology developed by Manasse and
presents a list of EM countries’ Real Effective Exchange
Roubini (2005) and classify countries by three major
Rates (REER) against their 15-year moving averages.
types of sovereign risk:
Countries with large deviations above their long term
Insolvency (or inability to sustain debt): characterized by REER values are Ecuador, China, Nigeria, Vietnam,
monetary or fiscal imbalances accompanied by large Kenya, and Egypt.
external financing needs (external debt in excess of 49.7
Table 2: Liquidity Indicators
percent of GDP). Table 1 presents the group of countries
Buffer - External gap (USBn) 2020 Fiscal needs (USBn)
that fit this description. Bahrain, Georgia, Qatar, Oman,
Fiscal needs
Through Through
Kazakhstan, Jordan, and Romania have all external debt Country
2020 2021
Externally Fiscal needs
Funded
levels above 50% of GDP, fiscal deficits above 5% and Suriname 0.3 0.4 0.2 0.3
current account deficits above 3%. Zambia 1.2 2.2 0.9 1.6
Sri Lanka 4.4 9.8 3.3 7.8
Table 1: Solvency Indicators Pakistan 17.9 20.3 21 26.9
Belize -0.1 -0.2 0 0.1
Budget Current Angola 13.4 15.4 2 3.7
Total External
Country Surplus/Defi Account (% Kenya 8.7 9.6 3 8
Debt (% GDP)
cit (% GDP) of GDP)
Gabon 1.6 1.7 1.3 0.5
Bahrain 177% (11.10) (7.10)
Egypt 8.1 12 23.8 30.7
Goergia 128% (8.55) (8.80) Ethiopia 0.1 -0.6 2.7 4.1
Qatar 121% (6.70) (3.85) El Salvador 4.6 6.3 1.9 2.8
Oman 116% (16.25) (16.20) Tunisia 5.3 6.5 2.4 2.7
Oman 12.2 15.2 0.7 13.3
Kazakhastan 108% (3.25) (3.95)
Bahrain 3.8 4.7 4.6 3.6
Ukraine 97% (7.20) (1.80)
Cameroon 2.3 3.6 1.5 2
Hungary 96% (4.55) (0.60) Mongolia 1.3 0.3 0.8 0.7
Malaysia 77% (5.75) 1.25 Mozambique 0.9 -1.7 1.8 0.6
UEA 70% (8.00) 0.60 Iraq 46.9 22.2 10.6 33.7
Armenia 1.6 1.4 0.3 0.7
Chile 66% (10.20) (0.65)
Tajikistan 0.7 0.9 0.2 0.6
Poland 65% (8.50) 0.80
Bolivia 5.9 5.5 1.6 3.7
Jordan 64% (5.10) (6.65) Nigeria 29.7 37.1 10.9 28.4
Turkey 63% (6.50) (1.80) Ghana 6.2 8 4.6 4.5
Zambia 56% (7.10) (0.40) Costa Rica 8.8 14 0.5 3.9
Senegal 2.4 3.3 0.4 1.5
Romania 53% (8.20) (3.50)
Jordan 10.2 11.2 2 2
South Africa 51% (14.90) (0.60)
Namibia 2.3 2.7 0.3 1
Argentina 50% (7.50) (0.05) Ukraine 24 30 11.2 9.7
Brazil 47% (15.70) (0.82) Ivory Coast 5.8 9.4 1.5 2.6
Indonesia 45% (6.00) (2.10) Trinidad 8 9.5 0.6 2.5
Vietnam 77.2 81.5 2.6 19.7
Source: IMF Fiscal Monitor, Bloomberg Consensus. Total external debts for
Azerbaijan 43.5 44 0.5 4.5
year 2020 where estimated regressing WB 2018 EXD with IMF Fiscal and
Belarus 6.3 6.6 1.4 1.7
Current account balances.
Jamaica 2.8 4 0.5 0.4
Illiquidity: identified with short-term debt of more than Georgia 3.2 3.9 0.3 1.1
Dominican Rep 13 18.2 3.8 2.6
130 percent of a country’s reserves, along with political
Honduras 4.6 5.1 0.4 0
uncertainty and tight international capital markets. Paraguay 9.7 10.1 1.7 1.5
Table 2 presents a number of liquidity indicators for Papua N G 7 13.3 0.4 1.2
small EM countries. Here the countries with the largest Uzbekistan 28.1 26.3 0.8 2.3
vulnerabilities are Zambia, Sri Lanka, Pakistan, Angola Guatemala 18.5 21.7 1.8 3.8
and Egypt. Source: Nguyen (2020).
PLEASE SEE THE END OF THIS DOCUMENT FOR IMPORTANT INFORMATION AND DISCLAIMERS.
The Rohatyn Group 3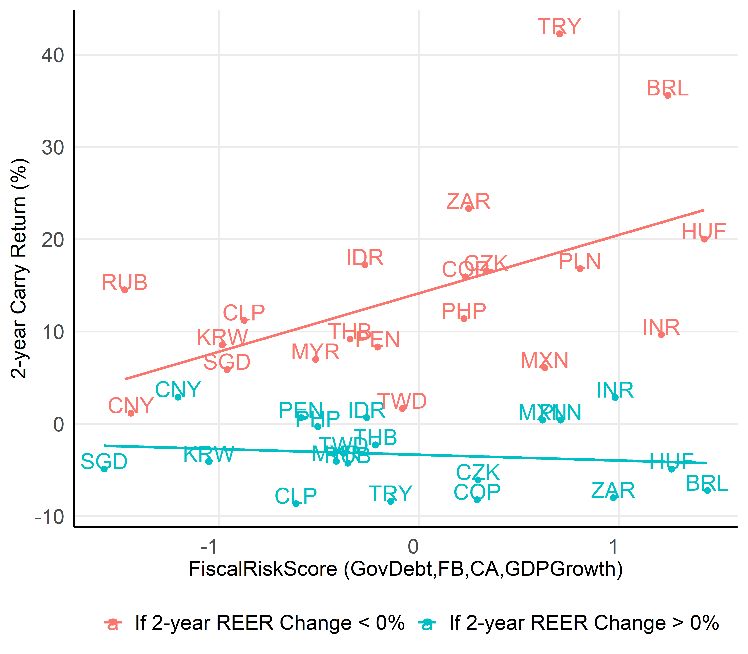
EM DEBT AND THE US DOLLAR CYCLE - CONFIDENTIAL
AUGUST- 2020
Table 3: Macro-exchange Risks - Russia has implemented a moderate fiscal
response resulting in a 4.4% fiscal deficit that
EMFX spot REER15y Dif
US 111.11 96.92 -13%
was entirely financed domestically (the current
ARS 108.02 107.52 0% account balance is still at +1%). Its REER is
BRL 55.38 85.18 54% substantially undervalued relative to its 15-year
MXN 70.39 95.24 35% average (20%) and total debt is low (17%).
CLP 83.64 96.55 15%
COP 65.14 87.91 35% India has a fiscal deficit of 7.4% of GDP, and
ECU 119.40 107.50 -10% gross debt-to-GDP of 74.3%, but external debt
PEN 80.10 85.51 7% is very low at 19%.
CZN 98.21 95.50 -3%
PLN 91.19 96.38 6% According to IMF forecasts, China’s fiscal deficit
HUF 85.42 94.63 11% and government debt are projected to be
RON 98.93 100.39 1%
11.2% and 64.9% of GDP, respectively, for 2020.
ILS 113.23 100.12 -12%
TRY 54.42 84.44 55%
But China is one of the economies expected to
RUB 76.22 91.57 20% be least affected by the crisis, with 2%
ZAR 64.20 84.83 32% projected growth for the year.
KRW 105.84 109.18 3%
THB 107.80 101.26 -6% b. Of the large and liquid EM countries, Turkey and
SGD 105.54 103.82 -2% Romania present moderate vulnerabilities
IDR 89.92 97.72 9% associated with high external debt (mostly
INR 106.17 92.07 -13% corporate) in the case of the former and significant
MYR 84.45 94.60 12%
twin deficits in the case of the latter. The main risk
PHP 114.70 102.46 -11%
for Romania is the need for fiscal consolidation,
TWR 108.77 103.66 -5%
CNY 123.50 109.50 -11%
while in Turkey political risk remains a key factor.
NGN 110.56 105.74 -4% c. Smaller EM countries with less flexible and
VND 130.79 110.92 -15%
overvalued exchange rates are likely to carry higher
JOR 120.19 105.90 -12%
BAH 109.30 104.15 -5%
sovereign risk. Of the smaller and less liquid EM
KES 143.50 118.85 -17% countries, the countries with the largest
EGP 104.01 91.44 -12% vulnerabilities appear to be Zambia, Sri Lanka,
Source: BIS, JPM, and authors’ calculations.
Pakistan, Angola, Oman, Nigeria, Kenya, and Egypt.
Taking all of the sovereign risks together we draw the What adjustments are needed to achieve a sustainable
following conclusions: debt level?
a. Large and systemically important EM countries Daly et al (2020) estimate the fiscal adjustments
present either internal or external imbalances but required by EM economies to achieve debt
also important risk-mitigating factors. For example: sustainability. In their base case scenario, the average
EM debt level is expected to increase by around 10% of
- Brazil has a large fiscal deficit (15.8%) and fiscal
GDP between the end of 2019 and the end of 2021 due
debt (90%) but mainly denominated in local
to the recently announced discretionary fiscal easing
currency and domestically financed with a
measures and the impact of weaker growth on budget
current account deficit of just 0.7% and non-
balances.
resident holdings of sovereign debt in 2019 was
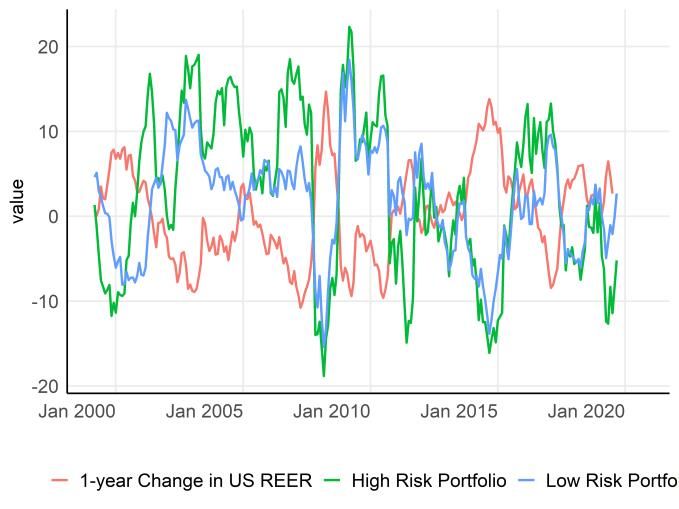
only 10.9% of the total according to the IMF. They estimate the primary balances required by EMs to
Additionally, its REER is substantially stabilize debt post-2021 under three different
undervalued relative to its 15-year average scenarios: (i) assuming interest rates and trend growth
(54%) and inflation is running below target return to pre-crisis levels; (ii) assuming increased
(2.6%). borrowing costs persist and trend growth is 1% lower
PLEASE SEE THE END OF THIS DOCUMENT FOR IMPORTANT INFORMATION AND DISCLAIMERS.
The Rohatyn Group 4EM DEBT AND THE US DOLLAR CYCLE - CONFIDENTIAL
AUGUST- 2020
than pre-crisis levels; and (iii) the minimum primary to remain higher compared to past cycles, at 56% of
balance required to cover existing interest payments GDP on average compared to 44%.
and debt repayments.
Table 4: Today Versus Previous USD Depreciation Cycles1
Under scenario (ii), primary balances in Asia would need
to adjust from -2.6% to -0.7% (a fiscal tightening of 1.9 Fiscal Balance (% of GDP) Gov. Gross Debt (% of GDP)
IMF IMF IMF IMF
percentage points), in CEEMEA from -3.5% to +1.5% (a Previous Previous
Forecast Forecast Forecast Forecast
fiscal tightening of 5.0 percentage points), and in Latin Cycles Cycles
2020 2021 2020 2021
America from -3.0% to +1.5% (a fiscal tightening of 4.5 BRL -3.7 -9.3 -6.1 71 98 98
COP -2.1 -2.5 -1.3 40 58 55
Latam
percentage points). MXN -2.6 -4.2 -2.2 41 61 59
CLP -0.3 -6.3 -3.5 9 32 35
The largest fiscal adjustments are required in South PEN -1.1 -7.1 -2.6 38 37 37
Africa, Saudi Arabia, Kenya, Nigeria, Brazil, Turkey, and CZK -4.9 -4.7 -1.7 29 38 37
TRY -6.0 -7.5 -6.7 56 39 41
Ghana. RUB 0.8 -4.8 -3.0 21 18 17
CEEMA
RON -3.4 -8.9 -7.0 23 44 47
Figure 4: Primary balances (% of GDP) PLN -5.3 -6.7 -3.5 46 54 54
HUF -7.1 -3.0 -1.6 64 69 66
ZAR -2.1 -13.3 -12.7 33 77 86
CNY -2.0 -11.2 -9.6 29 65 70
INR -9.3 -7.4 -7.3 78 74 74
IDR -0.6 -5.0 -4.0 44 37 38
MYR -4.2 -4.2 -3.6 44 63 60
Asia
PHP -2.7 -3.4 -2.7 62 43 43
SGD 1.6 -3.5 1.8 97 113 114
KRW 1.4 -1.8 -1.6 24 46 49
TWD -4.6 -1.3 -1.2
THB -2.3 -3.4 -1.7 48 48 49
Average -2.9 -5.7 -3.9 45 56 56
Source: IMF Fiscal Monitor and unaudited author’s calculations.
However, external financial needs remain contained
(Fig 5a). The projected level of external debt for large
EM countries (Brazil, China, Indonesia, India, Mexico,
Source: IMF, Goldman Sachs Global Investment Research Malaysia, Russia, Thailand, Turkey, and South Africa) is
at levels comparable to 2001, when the previous multi-
2. Will these changes present an impediment to EM year US dollar weakening cycle began.
currencies benefitting from a multi-year US Dollar Figure 5a: External Debt (% of GDP)
weakening cycle?
60%
Focusing on the most liquid set of EM economies, in
Table 4 we compare the fiscal balance-to-GDP and 40%
government gross debt-to-GDP between this year’s IMF 20%
forecast with the same data from the beginning of the
0%
past three cycles of USD depreciation (February 2002, 20002002200420062008201020122014201620182020
October 2005, February 2009). The fiscal deficit has
increased on average from 2.9% to 5.7%, following Median Average
massive COVID-related stimulus programs across EM Source: IMF WEO database 2020 and World Bank. The last 2 years are
countries. It is projected to fall back to 3.9% by 2021, extrapolated from the Fiscal Deficit and Current Account.
just 1% above the level reached in previous USD
Additionally, inflation levels in this set of countries have
depreciation cycles. Government debt is also projected
decreased significantly since the early 2000s (Fig 5b).
1 “Previous Cycles” refer to three mini-cycles of USD Depreciation
that started in February 2002, October 2005 and February 2009
(see past report link).
PLEASE SEE THE END OF THIS DOCUMENT FOR IMPORTANT INFORMATION AND DISCLAIMERS.
The Rohatyn Group 5EM DEBT AND THE US DOLLAR CYCLE - CONFIDENTIAL
AUGUST- 2020
The median inflation in 2002 was 8%, while it is now during periods of USD depreciation (13.7-15.5% per
projected to be only 3%. This translates into lower annum depending on weighting scheme3) and poorly,
nominal rates, which further facilitates domestic but to a lesser degree, when the USD is appreciating (-
financing of fiscal deficits. 8.2-10.4% per annum). During USD depreciation, both
high-risk and low-risk countries performed well but low-
Figure 5b: EM Inflation risk countries offered a better risk/reward trade-off (2-
2.4 versus 1.7-1.9).
Figure 6: EM FX Carry Return and Fiscal Risk Score
(During USD Appreciation and Depreciation)
Source: IMF WEO database 2020
What is the interaction between debt level and EM
currency return during weakening cycles?
To shed light on these interactions, we constructed our
own score of fiscal risk based on four indicators:
Government gross debt-to-GDP (GovDebt), fiscal
balance-to-GDP (FB), current account-to-GDP (CA) and
real GDP growth (GDPGrowth). We chose this limited
set of indicators because they provide up-to-date
forecasts made by global institutions. This fiscal risk
Source: Bloomberg, BIS, and unaudited author’s calculations. Period covers
score allows us to rank each currency at each point in February 1999 to July 2020.
time cross-sectionally, with the highest scores
representing the highest level of fiscal risk. How do we expect currencies with above average debt
metrics to perform relative to currencies with below
Using currency carry returns2 from February 1999 to average debt metrics?
July 2020, we tested the hypothesis that currencies with
higher fragility scores have higher beta to USD cycles. For this analysis, we created portfolios with currencies
Figure 6 shows how high-risk currencies (on the right sorted into the highest half and lowest half in terms of
side of the graph, e.g. TRY, BRL, ZAR, HUF, INR, PLN, risk (i.e. fragility score). The rolling 12-month return for
MXN) have much higher returns during periods of USD both portfolios are shown in Figure 8 together with the
weakening than low-risk currencies (on the left side of US REER 1-year percentage change. High-risk currencies
the graph, e.g. SGD, CNY, RUB, KRW, CLP). Risky are usually more volatile with the 1-year rolling return
currencies also exhibit lower returns during USD oscillating between -20 and 20%. Most noticeably, both
appreciation cycles. portfolios posted similar returns during the financial
Portfolios of high-risk countries performed very well crisis, but very different ones so far following the Covid
2 The return from borrowing the short currency to fund buying the 3
(1) the riskiest half of currencies, (2) the top 3 riskiest currencies
long currency and earning interest. The return is calculated by and (3) the riskiest currency in each region, each rebalanced
adding the spot return to the interest earned from the long monthly.
currency position and subtracting the interest owed from the short
currency position.
PLEASE SEE THE END OF THIS DOCUMENT FOR IMPORTANT INFORMATION AND DISCLAIMERS.
The Rohatyn Group 6EM DEBT AND THE US DOLLAR CYCLE - CONFIDENTIAL
AUGUST- 2020
crisis; the rolling 1-year return as of July 2020 is -5% for Table 5: Portfolio Betas to Changes in Macro Variables
the high-risk currencies, and +3% for the low-risk
currencies.
Figure 7: Rolling 12-month Return of High Risk and Low
Risk portfolios versus US REER
Source: Bloomberg, BIS, and unaudited author’s calculations. Period covers
February 1999 to July 2020. High (Low) Risk portfolio refers to portfolio that
goes long in the highest (lowest) half of countries according to their Fragility
Score.
Next, we regress the 12-month returns of each portfolio
on the 12-month changes in the portfolio fundamentals
(government gross debt-to-GDP, GDP growth, fiscal
balance-to-GDP, and current account-to-GDP) and the
Source:
12-month change in US REER, which is our variable of Bloomberg, BIS, and unaudited author’s calculations. Period covers February
interest. To control for confounding factors, we also 1999 to July 2020. High (Low) Risk portfolio refers to portfolio that goes long
in the highest (lowest) half of countries according to their Fragility Score.
include other macro variables such as the yearly change
in price-to-earnings of the S&P 500, US Treasury 10 year Using the coefficients in Table 5 and the IMF/WEO
yield, copper price over its 5-year moving average, and forecasts for each country’s fundamentals, we forecast
oil price over its 5-year moving average. We see the the return of both portfolios under different US REER
results in Table 5. The US REER is the most robust driver percentage change scenarios (keeping all other
variables constant). As of August 2020, the portfolios
of portfolio returns, as a 1% appreciation in the REER
appear as follows:
generates a 1.37% decrease in the portfolio return for
the high-risk portfolio and a 0.80% decrease for the low- High-risk portfolio (BRL, CLP, CNY, COP, HUF, INR, MXN,
risk portfolio, keeping all other variables constant. RON, TRY, ZAR)
Copper price positively correlates with the low-risk
With the following IMF forecasts:
portfolio returns, while government gross debt-to-GDP
correlates negatively with high-risk currencies. High Risk Portfolio
2020 2021 Change
Taken together, these macro-variables explain a large Real GDP Growth (%) -3.5 4.9 8.3
portion of the variation in returns as shown by the high Fiscal Balance to GDP (%) -7.4 -5.8 1.6
R-square of 65%. Gov. Gross Debt to GDP (%) 61.9 63.1 1.2
Current Account to GDP (%) -1.3 -1.6 -0.3
PLEASE SEE THE END OF THIS DOCUMENT FOR IMPORTANT INFORMATION AND DISCLAIMERS.
The Rohatyn Group 7EM DEBT AND THE US DOLLAR CYCLE - CONFIDENTIAL
AUGUST- 2020
Low-risk portfolio (CZK, IDR, KRW, MYR, PEN, PHP, PLN, Source: Bloomberg, BIS, and unaudited author’s calculations. As of August
2020, High Fragility Score portfolio contains BRL, CLP, CNY, COP, HUF, INR,
RUB, SGD, THB, TWD) MXN, RON, TRY, ZAR, and Low Fragility Score contains CZK, IDR, KRW, MYR,
PEN, PHP, PLN, RUB, SGD, THB, TWD.
With the following IMF forecasts:
Low Risk Portfolio
2020 2021 Change Authors
Real GDP Growth (%) -3.4 5.6 8.9 Dalibor Eterovic, PhD,
Fiscal Balance to GDP (%) -4.2 -2.2 2.0 dalibor.eterovic@rohatyngroup.com
Gov. Gross Debt to GDP (%) 49.6 49.7 0.1
Current Account to GDP (%) 2.3 2.7 0.4 Adrien Alvero, PhD ©,
Adrien.alvero@rohatyngroup.com
The portfolio return forecasts are shown in Figure 8. In
the absence of changes in the S&P 500 price-to-earnings
ratio, UST 10 year yield, copper and oil prices, and References
provided country fundamentals follow the IMF/WEO
Daly K., Gedminas T. and C. Grafe (2020), “Post-COVID
forecasts and assuming that past correlations stay
– Dealing with the EM Debt Overhang”, EM Macro
constant, a 10% decrease in the US REER is associated Themes, Goldman Sachs
with a return of 15.4% for high-risk countries and 10.2%
for low-risk countries. A long-short portfolio would then
yield 5.2%. In the opposite scenario of an increase in the Fiscal Monitor, 2020 April. International Monetary
US REER by 10%, the forecasted return is -11.9% for the Fund.
high-risk portfolio and -8.9% for the low-risk portfolio,
corresponding to a long-short return of -3%. Kose, M A, P Nagle, F Ohnsorge, and N Sugawara
Figure 8: Forecasted Portfolio Returns under Different (2020), Global Waves of Debt: Causes and
Scenarios using Changes in Fundamentals from 2020 to Consequences, World Bank.
2021
Nguyen, T., 2020. EM sovereign repayment risks 2.0.
JPM Global Emerging Markets Research, 16 June 2020
PLEASE SEE THE END OF THIS DOCUMENT FOR IMPORTANT INFORMATION AND DISCLAIMERS.
The Rohatyn Group 8EM DEBT AND THE US DOLLAR CYCLE - CONFIDENTIAL
AUGUST- 2020
Glossary
5-year swap A vanilla interest rate swap is an agreement between two counterparties to exchange
cashflows (fixed vs floating) in the same currency. This agreement is often used by
counterparties to change their fixed cashflows to floating or vice versa. The payments are
made during the life of the swap in the frequency that is pre-established by the
counterparties. The life of this swap is 5 years.
Breakeven 5-year Inflation FED5YEAR Index: Fed' Five-year Forward Breakeven Inflation Rate. Measure of expected
inflation, more info can be found here:
https://www.federalreserve.gov/pubs/feds/2008/200805/200805abs.html
DXY The U.S. Dollar Index (USDX) indicates the general international value of the USD. The
USDX does this by averaging the exchange rates between the USD and major world
currencies.
EUR12M Curncy EURUSD 12 Month Forward Points: Forward foreign exchange transactions involve the
purchase of a specified amount of one currency and selling of another on an agreed date in
the future. Forward exchange rates are determined by using the arbitrage free price
relationship between the interest rates of the two currencies and the
current spot rate.
EURUSD EURUSD Spot Exchange Rate - Price of 1 EUR in USD
Federal Fund rate A target interest rate set by the central bank in its efforts to influence short-term interest
rates as part of its monetary policy strategy
Funding currency A currency that is exchanged in a currency carry trade transaction. A funding
currency typically has a low interest rate in relation to the high-yielding (asset) currency.
Investors borrow the funding currency and take short positions in the asset currency,
which has a higher interest rate
JPY Curncy USDJPY Spot Exchange Rate - Price of 1 USD in JPY
JPY12M Curncy USDJPY 12 Month Forward Points: Forward foreign exchange transactions involve the
purchase of a specified amount of one currency and selling of another on an agreed date in
the future. Forward exchange rates are determined by using the arbitrage free price
relationship between the interest rates of the two currencies and the
current spot rate.
Logit regression Analysis that helps predicting the likelihood of an event (e.g. the start of a USD
depreciation cycle). It is a statistical model that uses a logistic function to model a binary
dependent variable.
Markov switching Type of model that is used to analyze time series that transition over different states, and
regression where the time of transition and duration in a particular state are both random. (e.g. a
state with high average USD REER versus a state with low average).
Real Effective Exchange An effective exchange rate (also known as a trade-weighted exchange rate) is a weighted
Rate (REER) average of the individual exchange rates of a particular country with its main trading
partners. The bilateral exchange rates are weighted according to the importance of each
partner country's share of trade with the reporting country. The real effective exchange
rate (REER) is adjusted for inflation. Federal reserve and BIS (Bank of International
settlement).
PLEASE SEE THE END OF THIS DOCUMENT FOR IMPORTANT INFORMATION AND DISCLAIMERS.
The Rohatyn Group 9EM DEBT AND THE US DOLLAR CYCLE - CONFIDENTIAL
AUGUST- 2020
Real M1 M1 includes funds that are readily accessible for spending. M1 consists of: (1) currency
outside the U.S. Treasury, Federal Reserve Banks, and the vaults of depository institutions;
(2) traveler's checks of nonbank issuers; (3) demand deposits; and (4) other checkable
deposits (OCDs), which consist primarily of negotiable order of withdrawal (NOW) accounts
at depository institutions and credit union share draft accounts. Seasonally adjusted M1 is
calculated by summing currency, traveler's checks, demand deposits, and OCDs, each
seasonally adjusted separately. Real variables are obtained by dividing nominal variable
with the respective Inflation rate.
US Budget Balance (% GDP) This index and forecasts for this index are available under {ECFC }. Both the quarter
and yearly values are reported on an annualized basis to avoid seasonal issues, using either
a 4-quarter or 12-month moving sum of national sourced indices. In the report, we take
the 4-quarter difference and multiply it by -1.
US Neutral Rates: Source: https://www.newyorkfed.org/research/policy/rstar. Measuring the Natural Rate of
Interest The Laubach-Williams (“LW”) and Holston-Laubach-Williams (“HLW”) models
provide estimates of the natural rate of interest, or r-star, and related variables. Their
approach defines r-star as the real short-term interest rate expected to prevail when an
economy is at full strength and inflation is stable.
USD/EUR 1Y Fwd Discount(- 1% means that the EURUSD spot rate is 1% higher than the 12 month forward rate.
)/Premium(+) Formula: EURUSD/(EURUSD + EUR12M Curncy/10000) -1
USD/JPY 1Y Fwd Discount(- 1% means that the USDJPY spot rate is 1% lower than the 12 month forward rate. Formula:
)/Premium(+) (JPY Curncy + JPY12M Curncy/100)/JPY Curncy -1
Vehicle currency A currency which is extensively used by traders and bankers in international trade
transactions, i.e. used as an international medium of exchange (such as the dollar)
Copper Price LOCADS03: Copper 3-month US FI HY LF98TRUU Index
future: 25 metric tons price quote:
$/metric tons (1 metric ton =
2,204.62 pounds)
Oil WTI Price CL1 COMB Comdty: Crude Oil US FI LUACTRUU Index
Futures
S&P 500 SPX Index MSCI Local Curncy "MXEFOCXO Index:
EURO STOXX 50 EURO STOXX 50 Price EUR MSCI EM MXEF Index
UST 10y H15T10Y Index: US Treasury Yield MSCI LATAM MXLA Index
Curve Rate T Note Constant
Maturity 10 year
UST 2y H15T2Y Index: US Treasury Yield MSCI Asia MXAP Index
Curve Rate T Note Constant
Maturity 2 year
EM FI (USD) EMUSTRUU Index Gold BCOMGCTR Index
EM FI HY (USD) BEBGTRUU Index Energy BCOMENTR Index
PLEASE SEE THE END OF THIS DOCUMENT FOR IMPORTANT INFORMATION AND DISCLAIMERS.
The Rohatyn Group 10EM DEBT AND THE US DOLLAR CYCLE - CONFIDENTIAL
AUGUST- 2020
IMPORTANT INFORMATION
THE INFORMATION CONTAINED IN THIS COMMENTARY REPRESENTS THE VIEWS OF TRG MANAGEMENT LP (TOGETHER WITH
ITS AFFILIATES, “TRG”). THIS COMMENTARY IS PROVIDED TO YOU FOR INFORMATIONAL PURPOSES ONLY. THE VIEWS
EXPRESSED REFLECT CURRENT VIEWS AS OF THE DATE HEREOF, AND TRG DOES NOT UNDERTAKE TO ADVISE YOU OF ANY
CHANGES IN THE VIEWS EXPRESSED HEREIN. OPINIONS OR STATEMENTS REGARDING CURRENT EVENTS OR TRENDS ARE BASED
ON CURRENT CONDITIONS AND ARE SUBJECT TO CHANGE WITHOUT NOTICE. THIRD PARTIES, INCLUDING OTHER ASSET
MANAGERS, MAY HAVE DIFFERENT PERSPECTIVES THAN THOSE SET FORTH HEREIN. BECAUSE TRG MUST RESPOND TO
CHANGING MARKET CONDITIONS, THE VIEWS HEREIN SHOULD NOT BE INTERPRETED TO BE A COMMITMENT ON THE PART
OF TRG, AND TRG CANNOT GUARANTEE THE ACCURACY OF ANY INFORMATION PRESENTED AFTER THE DATE OF PUBLICATION.
THE VIEWS EXPRESSED HEREIN MAY NOT BE REFLECTED IN THE STRATEGIES AND PRODUCTS THAT TRG OFFERS OR INVESTS.
IT SHOULD NOT BE ASSUMED THAT TRG HAS OR WILL USE ANY OR ALL OF THE ANALYSES DESCRIBED HEREIN.
THIS COMMENTARY IS NOT AN OFFER OR SOLICITATION TO BUY, RETAIN OR SELL ANY SECURITY. IN PARTICULAR, ANY DECISION
TO BUY, RETAIN OR SELL SHARES OF ANY SECURITIES MUST BE MADE BASED ONLY ON THE INFORMATION CONTAINED IN THE
DEFINITIVE DOCUMENTS PROVIDED TO PROSPECTIVE INVESTORS, WHICH QUALIFY IN THEIR ENTIRETY THE INFORMATION SET
FORTH HEREIN. THIS DOCUMENT DOES NOT CONSTITUTE PART OF ANY SUCH DEFINITIVE DOCUMENTS. THIS DOCUMENT IS
STRICTLY CONFIDENTIAL AND MAY NOT BE REPRODUCED OR REDISTRIBUTED IN WHOLE OR IN PART NOR MAY ITS CONTENTS
BE DISCLOSED TO ANY OTHER PERSON WITHOUT THE PRIOR WRITTEN CONSENT OF THE ROHATYN GROUP. NOTHING HEREIN
IS INTENDED TO CONSTITUTE LEGAL, TAX OR ACCOUNTING ADVICE, OR AN INVESTMENT RECOMMENDATION.
ANY PROJECTIONS, MARKET OUTLOOKS OR ESTIMATES IN THIS COMMENTARY ARE FORWARD LOOKING STATEMENTS AND
ARE BASED UPON CERTAIN ASSUMPTIONS. OTHER EVENTS WHICH WERE NOT TAKEN INTO ACCOUNT MAY OCCUR AND MAY
SIGNIFICANTLY AFFECT THE BASES UPON WHICH SUCH ASSUMPTIONS WERE MADE. ANY PROJECTIONS, OUTLOOKS OR
ASSUMPTIONS SHOULD NOT BE CONSTRUED TO BE INDICATIVE OF THE ACTUAL EVENTS WHICH WILL OCCUR. THE
INFORMATION IN THIS DOCUMENT HAS BEEN DEVELOPED INTERNALLY AND/OR OBTAINED FROM SOURCES BELIEVED TO BE
RELIABLE; HOWEVER, TRG DOES NOT GUARANTEE THE ACCURACY, ADEQUACY OR COMPLETENESS OF SUCH INFORMATION.
NO SECURITIES COMMISSION OR REGULATORY AUTHORITY IN THE UNITED STATES OR IN ANY OTHER COUNTRY HAS IN ANY
WAY PASSED UPON THE MERITS OR THE ACCURACY OR ADEQUACY OF THIS DOCUMENT OR THE MATERIAL CONTAINED HEREIN
COMPLYING WITH ALL APPLICABLE COPYRIGHT LAWS IS THE RESPONSIBILITY OF THE USER. WITHOUT LIMITING THE RIGHTS
UNDER COPYRIGHT, NO PART OF THIS COMMENENTARY MAY BE REPRODUCED, STORED IN OR INTRODUCED INTO A RETRIEVAL
SYSTEM, OR TRANSMITTED IN ANY FORM OR BY ANY MEANS (ELECTRONIC, MECHANICAL, PHOTOCOPYING, RECORDING, OR
OTHERWISE), OR FOR ANY PURPOSE, WITHOUT THE EXPRESS WRITTEN PERMISSION OF TRG.
THIS COMMENTARY IS FOR INFORMATIONAL PURPOSES ONLY. TRG MAKES NO WARRANTIES, EXPRESS, IMPLIED OR
STATUTORY, AS TO THE INFORMATION HEREIN.
TRG UTILIZES DATA SOURCES THAT IT BELIEVES TO BE ACCURATE AND RELIABLE, BUT THERE CAN BE NO ASSURANCE AS TO
THE ACCURACY OR COMPLETENESS OF THE INCLUDED INFORMATION. DATA SOURCES VARY DEPENDING UPON TIME PERIOD,
INSTRUMENT, AND OTHER CONSIDERATIONS.
INVESTMENT CONCEPTS MENTIONED IN THIS COMMENTARY MAY BE UNSUITABLE FOR INVESTORS DEPENDING ON THEIR
SPECIFIC INVESTMENT OBJECTIVES AND FINANCIAL POSITION. WHERE A REFERENCED INVESTMENT IS DENOMINATED IN A
CURRENCY OTHER THAN THE INVESTOR’S CURRENCY, CHANGES IN RATES OF EXCHANGE MAY HAVE AN ADVERSE EFFECT ON
THE VALUE, PRICE OF OR INCOME DERIVED FROM THE INVESTMENT.
THE PORTFOLIOS DISCUSSED HEREIN ARE NOT ACTUAL PORTFOLIOS REFLECTING ACTUAL TRADING RESULTS. THEY ARE
INCLUDED FOR INFORMATIONAL PURPOSES ONLY, AND SHOULD NOT BE CONSTRUED TO BE INDICATIVE OF PERFORMANCE
RESULTS FOR ANY FUND OR ACCOUNT MANAGED BY TRG. HYPOTHETICAL PERFORMANCE RESULTS HAVE MANY INHERENT
LIMITATIONS. THERE ARE FREQUENTLY SHARP DIFFERENCES BETWEEN HYPOTHETICAL PERFORMANCE RESULTS AND THE
PLEASE SEE THE END OF THIS DOCUMENT FOR IMPORTANT INFORMATION AND DISCLAIMERS.
The Rohatyn Group 11EM DEBT AND THE US DOLLAR CYCLE - CONFIDENTIAL
AUGUST- 2020
ACTUAL RESULTS SUBSEQUENTLY ACHIEVED BY ANY PARTICULAR TRADING PROGRAM. THERE ARE NUMEROUS FACTORS
RELATED TO THE MARKETS IN GENERAL OR TO THE IMPLEMENTATION OF ANY SPECIFIC TRADING PROGRAM WHICH CANNOT
BE FULLY ACCOUNTED FOR IN THE PREPARATION OF HYPOTHETICAL PERFORMANCE RESULTS AND ALL OF WHICH CAN AFFECT
ACTUAL TRADING RESULTS. THE HYPOTHETICAL PRO FORMA PERFORMANCE FIGURES PROVIDED HEREIN ARE UNAUDITED
AND DO NOT REFLECT ANY FEES AND EXPENSES THAT MAY BE CHARGED TO INVESTORS OF A FUND OR ACCOUNT MANAGED
BY TRG; SUCH FEES AND EXPENSES ARE LIKELY TO BE MATERIAL AND ADVERSELY AFFECT RETURNS.
THE RESULTS OF THE PORTFOLIOS ARE BASED ON SIMULATED OR HYPOTHETICAL PERFORMANCE RESULTS THAT HAVE
CERTAIN INHERENT LIMITATIONS. UNLIKE THE RESULTS SHOWN IN AN ACTUAL PERFORMANCE RECORD, THESE RESULTS DO
NOT REPRESENT ACTUAL TRADING. ALSO, BECAUSE THESE TRADES HAVE NOT ACTUALLY BEEN EXECUTED, THESE RESULTS
MAY HAVE NOT ACTUALLY BEEN EXECUTED, THESE RESULTS MAY HAVE UNDER- OR OVER-COMPENSATED FOR THE IMPACT,
IF ANY, OF CERTAIN MARKET FACTORS, SUCH AS LACK OF LIQUIDITY. SIMULATED OR HYPOTHETICAL TRADING PROGRAMS IN
GENERAL ARE ALSO SUBJECT TO THE FACT THAT THEY ARE DESIGNED WITH THE BENEFIT OF HINDSIGHT. NO REPRESENTATION
IS BEING MADE THAT ANY ACCOUNT WILL OR IS LIKELY TO ACHIEVE PROFITS OR LOSSES SIMILAR TO THESE BEING SHOWN
THE HYPOTHETICAL PERFORMANCE FIGURES HEREIN SHOULD NOT BE CONSTRUED AS INDICATIVE OF THE FUTURE
PERFORMANCE OF ANY FUND OR ACCOUNT MANAGED BY TRG OR OF ANY PROPOSED TRADING PROGRAM. HYPOTHETICAL
PERFORMANCE RESULTS HAVE MANY INHERENT LIMITATIONS, SOME OF WHICH ARE DESCRIBED BELOW. NO
REPRESENTATION IS BEING MADE THAT ANY FUND OR ACCOUNT OR OF ANY PROPOSED TRADING PROGRAM WILL OR IS LIKELY
TO ACHIEVE PROFITS OR LOSSES TO THOSE SHOWN. IN FACT, THERE ARE FREQUENTLY SHARP DIFFERENCES BETWEEN
HYPOTHETICAL PERFORMANCE RESULTS AND THE ACTUAL RESULTS SUBSEQUENTLY ACHIEVED BY ANY PARTICULAR TRADING
PROGRAM. ONE OF THE LIMITATIONS OF HYPOTHETICAL PERFORMANCE RESULTS IS THAT THEY ARE GENERALLY PREPARED
WITH THE BENEFIT OF HINDSIGHT. IN ADDITION, HYPOTHETICAL TRADING DOES NOT INVOLVE FINANCIAL RISK, AND NO
HYPOTHETICAL TRADING RECORD CAN COMPLETELY ACCOUNT FOR THE IMPACT OF FINANCIAL RISK IN ACTUAL TRADING. FOR
EXAMPLE, THE ABILITY TO WITHSTAND LOSSES OR ADHERE TO A PARTICULAR TRADING PROGRAM IN SPITE OF TRADING
LOSSES ARE MATERIAL POINTS WHICH CAN ALSO ADVERSELY AFFECT ACTUAL TRADING RESULTS. THERE ARE NUMEROUS
OTHER FACTORS RELATED TO THE MARKETS IN GENERAL OR TO THE IMPLEMENTATION OF ANY SPECIFIC TRADING PROGRAM
WHICH CANNOT BE FULLY ACCOUNTED FOR IN THE PREPARATION OF HYPOTHETICAL PERFORMANCE RESULTS AND ALL OF
WHICH CAN ADVERSELY AFFECT ACTUAL TRADING RESULTS. THE HYPOTHETICAL PERFORMANCE FIGURES PROVIDED HEREIN
ARE CALCULATED BY THE ROHATYN GROUP AND ARE UNAUDITED.
PLEASE SEE THE END OF THIS DOCUMENT FOR IMPORTANT INFORMATION AND DISCLAIMERS.
The Rohatyn Group 12You can also read