Port Terminals 2019 - Transnet
←
→
Page content transcription
If your browser does not render page correctly, please read the page content below
Port Terminals 2019
Transnet Port Terminals 2019
                                                                      2

Highlights
• Revenue grew by 5,6% to R13,1 billion
• Automotive and break-bulk volumes performed well in 2019,
  growing by 5,6% and 3,7% respectively
• EBITDA increased by 8,8% to R4,54 billion
• R1,5 billion was spent on capacity creation and maintenance
  projects during the 2019 financial year

Business overview
Transnet Port Terminals (Port Terminals) plays a strategic role in
the South African economy by enabling the efficient flow of
imports, exports and transshipments through its cargo terminal
operations. Through its strategic role in the management of these
key trading hubs, Port Terminals ensures year-round connectivity
of the South African economy with other key trading partners in
the region and the rest of the world. As a vital enabler of trade
between South Africa and the global market, Port Terminals
continuously strives to improve the reliability and efficiency of
its operations through holistic business innovation to reduce
business costs.

Port Terminals provides cargo handling services to a wide
spectrum of customers including shipping lines, freight forwarders
and cargo owners. Operations are divided into four major business
segments, namely: containers, dry bulk, break-bulk and
automotive. The division operates 16 terminals with 68 berths in
seven ports spread along the South African coastline.

Containers
Port Terminals operates container terminals in the ports of
Durban, Ngqura, Port Elizabeth and Cape Town. The division
currently has a cumulative annual capacity of more than 6 million
20-foot equivalent units (TEUs). The Durban and Cape Town
container terminals are operating close to capacity, however, plans
are in place to increase the capacity in these ports.

Dry bulk
Operations within the bulk sector are characterised by handling
dry bulk commodities through a network of conveyor belts,
tipplers, stackers, reclaimers and ship loading and unloading
equipment. Port Terminals handles mineral bulk commodities at
the ports of Richards Bay, Port Elizabeth and Saldanha, and
handles agricultural bulk commodities at the ports of Durban and
East London.

Break-bulk
Port Terminals handles steel, timber, granite, abnormal and project
cargo, and other commodities through its break-bulk operations in
multi-purpose terminals in all seven ports. In some instances,
traditional bulk cargo can be handled at break-bulk facilities
utilising a skip operation.
Transnet Port Terminals 2019
                                                                                                                                                                     3

Automotive                                                                                     offerings beyond its core business as a port terminal operator. The
                                                                                               requisite high-performance culture we are instilling will enable us
Port Terminals operates automotive terminals at the ports of                                   to achieve:
Durban, East London and Port Elizabeth. These facilities handle a
variety of vehicles driven onto and off the vessel.                                            • Financial sustainability and growth;
                                                                                               • Operational excellence supported by predictable, reliable and
Port Terminals has embarked on a ‘Top Five in Five’ strategy aimed                               efficient terminal-handling services;
at ensuring the division becomes one of the top five global port                               • A cohesive port ecosystem that is integrated, efficient,
terminal operators by 2022. This will be achieved through                                        sustainable and customer focused; and
nurturing a high-performance culture and will be facilitated                                   • Proactive planning across the ecosystem to achieve operational
through a strong, unifying vision of expanding the division’s service                            excellence and financial growth.

Where we operate
Port Terminals’ geographic locations

                                                                                                  Beit Bridge

                                                                                           LIMPOPO

                                                                                 PENDORING

                                                                                           ■
                                                                                                                        Maputo
                                                                           GAUTENG                 MPUMALANGA
                                                      NORTH
                                                      WEST

                                                     Sishen                                     NEWCON ■
                                                                           FREE STATE
                                                                                                       KWAZULU- ■
                                                                                                                ■
                                                                                                                 Richards Bay
                                               Lohathla ■                                              NATAL

                                                                                                            ■■
                                                                                                     Durban ■■

                                NORTHERN CAPE
                                                                                EASTERN CAPE

                                                                                                                 ■   Containers
        Saldanha   ■                                                           East   ■■
                   ■
                                                                             London
                                                                                      ■■                         ■   Bulk
                                  WESTERN                       Ngqura■                                          ■   Break-bulk
                                   CAPE                               ■
                                                                                                                     Automotive
                                                                     ■■
         Cape Town ■
                   ▲■                            Mossel Bay        Port
                                                                      ■■                                         ■
                                                              Elizabeth
                                                                                                                     Transnet Corporate Centre Johannesburg

Regulatory environment
The National Ports Act, No 12 of 2005 (Ports Act) is the enabling legislation for Transnet Port Terminals and promulgates the parameters within
which terminals operate in South Africa. With 21 Terminal Operator licences across South Africa, Port Terminals has developed a Compliance
Risk Management Plan, as well as a Critical Control Framework and Control Self Assessments (CSAs) for the Ports Act. The CSAs are rolled out
across the business biannually and ensure compliance with the Ports Act and Terminal Operator licences. Port Terminals submits annual reports
on operations, performance, finance, SHEQ1 and competition to Transnet National Ports Authority, which then conducts mandatory annual
audits on all the terminals.

1
    Safety, Health, Environment and Quality.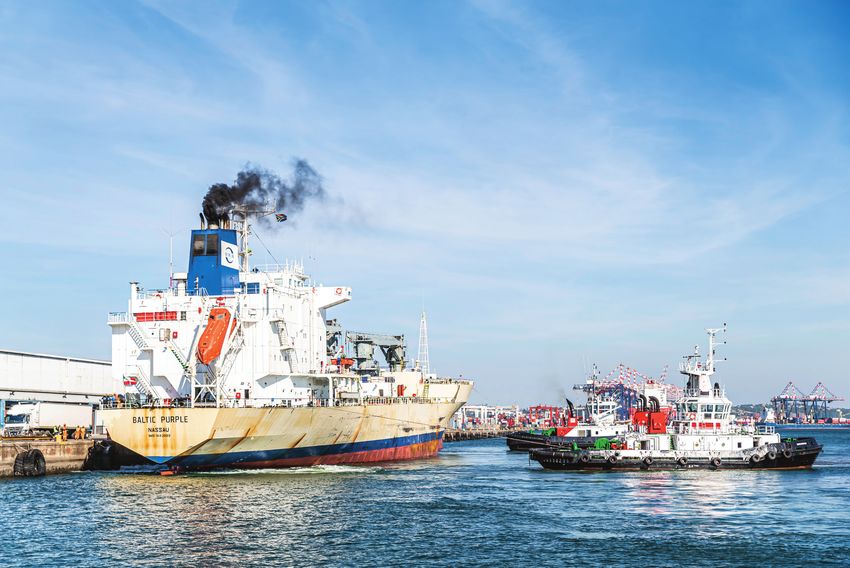
Transnet Port Terminals 2019
                                                                                                                                                    4

Performance context
 Strategic objective                               Contribution to strategic objective

 Reduce the total cost of logistics as a           • Developing innovative digital platform supply chain solutions to increase customer
 percentage of transportable GDP                     connectivity and transparency.
                                                   • Improving cargo handling efficiency rates to improve vessel turnaround times.
                                                   • Leveraging planning and operational partnerships between major shipping lines to improve
                                                     the moves per ship working hour (SWH).

 Effect and accelerate modal shift by              • Developing inland rail hub consolidation terminals in the hinterland to improve connectivity
 maximising the role of rail in the national         of bulk commodities by leveraging rail.
 transport task

 Leverage the private sector in the provision      • Implementing private sector partnership (PSP) agreement for the two agricultural
 of both infrastructure and operations where         terminals in Durban and East London.
 required                                          • Exploring partnerships to handle liquid bulk edible oils in Durban and Richards Bay.
                                                   • Outsourcing selected operational and support functions to the private sector to ensure
                                                     further development of the maritime industry.

 Integrate South Africa with the region and        • Grow transshipment volumes by focusing on free trade zones.
 the rest of the world                             • Encouraging the use of Short Sea Shipping by OEMs through the establishment of an
                                                     attractive tariff model.
                                                   • Establishing port operating partnerships with other African countries.

 Optimise the social and economic impact of        • Utilising local community resources in the establishment of hinterland terminals.
 all interventions undertaken by the SOC in        • Actively contributing towards the development of young professionals through our young
 the achievement of these objectives                 professionals-in-training programmes.
                                                   • Providing apprenticeship opportunities through the young engineer- and technician-in-
                                                     training programmes.

Operational performance
Core initiatives for 2019
• Increase revenue by 8,4% during the financial year.
• Focus on operations and supply chain efficiency enhancements in order to unlock capacity in the bulk sectors, promote additional export
  channels for manganese and optimise service delivery within the Durban Container precinct.
• Volume targets for the 2019 financial year:
  –– Containers: 4,6 million TEUs
  –– Bulk cargo: 86,5 million tonnes
  –– Break-bulk cargo: 19,5 million tonnes
  –– Automotive units: 725 401 units
• Increase the volume (moves/tons/units) per SWH to turn vessels around faster and attract shipping lines to South African ports.
• Facilitate operational efficiencies across all sectors by improving the reliability and availability of equipment through the implementation of
  a preventative maintenance strategy as well as leveraging technology, such as the Internet of Things for asset management.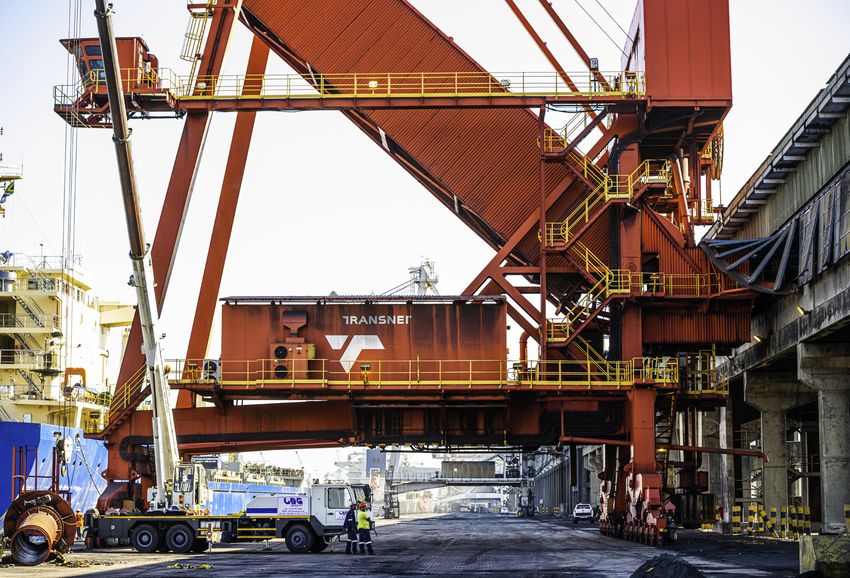
Transnet Port Terminals 2019
                                                                                                                             5

Overview of key performance indicators
                                                               2017       2018       2019           2019            2020
Key performance area and indicator         Unit of measure    Actual     Actual     Target         Actual          Target
 Financial sustainability
Revenue                                    R million          11 150     12 393     13 439         13 086          14 797
EBITDA                                     R million           3 794      4 172      4 637          4 541           5 237
Operating profit margin                    %                    20,7       19,9       20,7           23,1            22,7
Return on average total assets             %                    13,3       15,5       16,5           20,4            17,6
Revenue per employee (permanent)           R million              1,6        1,7        1,7            1,8             1,8

 Average tariff increase
– Containers                               %                     7,6        5,4         6,0            5,3            6,0
– Automotive                               %                     n/a        7,1         6,0            5,5            6,0

 Capacity creation and maintenance
Capital expenditure1                       R million           1 208      1 365      2 722           1 515          2 877

 Operational performance
Volume growth
Containers                                 ‘000 TEUs           4 396      4 664      4 625          4 534           4 863
Break-bulk                                 mt                   10,0       11,2       19,5           19,8            21,7
Bulk                                       mt                   88,1       91,0       86,5           82,4            85,6
Vehicles                                   units             679 792    704 052    725 401        743 350         724 141

 Operational efficiency and productivity
 Container dwell time
Durban Container Terminal (DCT) – Pier 1
Imports                                    days                  2,7        3,1        ≤3              2,9            ≤3
Exports                                    days                  4,7        5,3        ≤5              5,0            ≤5
Transshipment                              days                  5,4        6,6       ≤ 10             5,6           ≤ 10

DCT – Pier 2
Imports                                    days                  2,2        2,5        ≤3              2,3            ≤3
Exports                                    days                  5,5        6,1        ≤5              5,9            ≤5
Transshipment                              days                  5,9        7,8       ≤ 10             6,7           ≤ 10

Cape Town Container Terminal (CTCT)
Imports                                    days                  2,2        2,7        ≤3              2,3            ≤3
Exports                                    days                  4,3        5,8        ≤5              5,1            ≤5
Transshipment                              days                  7,2        7,2       ≤ 15             7,0           ≤ 15

 Moves per gross crane hour
DCT – Pier 1                               moves per hour         26         25         26              24             26
DCT – Pier 2 (prime berths2)               moves per hour         24         23         32              21             28
CTCT                                       moves per hour         32         30         33              22             28
Port Elizabeth                             moves per hour         25         23         25              21             25
Ngqura Container Terminal (NCT)            moves per hour         31         25         32              21             28

 Container moves per ship working hour
DCT – Pier 1                               moves per hour         45         46         50              47             50
DCT – Pier 2 (prime berths2)               moves per hour         55         53         65              54             65
CTCT                                       moves per hour         53         45         56              45             56
Port Elizabeth                             moves per hour         45         37         36              33             36
NCT                                        moves per hour         63         50         66              47             56

 Train turnaround time3
DCT – Pier 1                               hours                  2,9        2,4       4,0             2,3            4,0
DCT – Pier 2                               hours                  3,5        2,2       4,0             2,0            4,0
CTCT                                       hours                  1,0        1,1       4,0             1,3            4,0
NCT                                        hours                  3,8        3,9       4,0             3,8            4,0
Saldanha4                                  minutes               112        105       109             109            109
Richards Bay                               hours                  8,4        8,4      11,0             9,1           11,0
Port Elizabeth                             hours                  9,8        7,9      12,0             7,5           12,0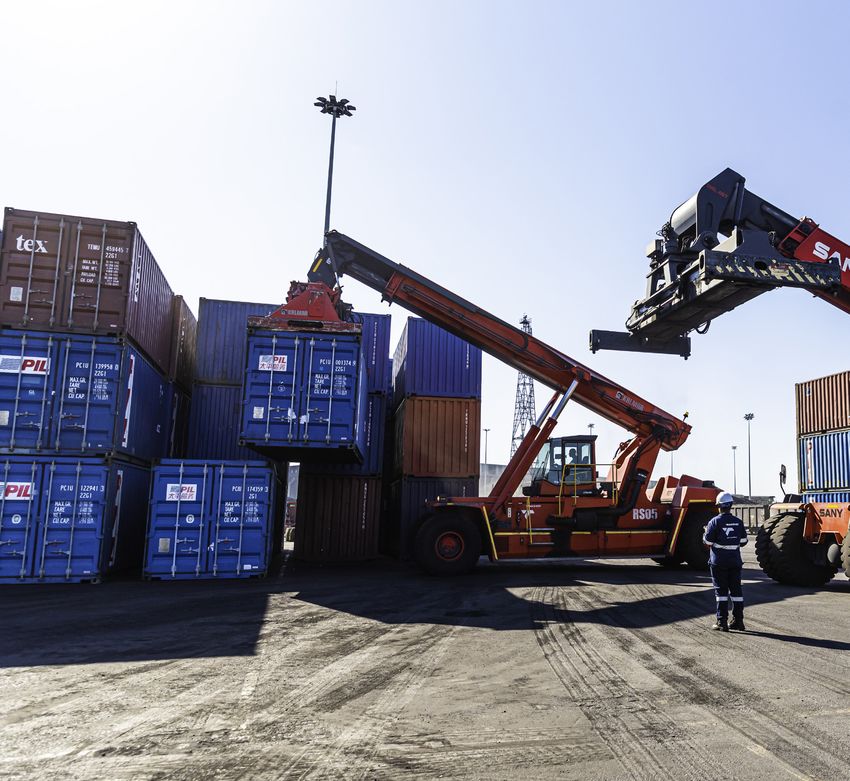
Transnet Port Terminals 2019
                                                                                                                                                        6

                                                                                    2017             2018        2019            2019           2020
Key performance area and indicator                  Unit of measure                Actual           Actual      Target          Actual         Target
    Truck turnaround time
DCT – Pier 1                                        minutes                              37               35         35              41           35
DCT – Pier 25                                       minutes                              79               72         35              69           65
CTCT                                                minutes                              21               36         35              35           35
NCT                                                 minutes                              32               36         35              36           35
Richards Bay Multi-Purpose Terminal (MPT)           minutes                              25               22         35              31           35

    Loading rate
Saldanha Iron Ore Terminal                          tons per hour                    8 564              8 576     8 100           8 657         8 100
Richards Bay Dry Bulk Terminal (RB DBT) –
Loading – Magnetite                                 tons per hour                       n/a               n/a     1 050           1 236         1 100
RB DBT – Loading – Chrome                           tons per hour                       n/a               n/a       950             893           950
RB DBT – Loading – Coal                             tons per hour                       n/a               n/a       800             691           800
RB DBT – Offloading – Coking Coal                   tons per hour                       n/a               n/a       600             532           650

    Sustainable developmental outcomes
    Employment
Employee headcount (permanent)                      number                           8 891              8 816     8 132           7 392         8 355

    Health and safety
Disabling injury frequency rate (DIFR)              rate                               0,71              0,67      0,70            0,52          0,70
1
  Capital expenditure excludes capitalised borrowing costs.
2
  Prime berths for 2018/19 are berths 108, 203 and 204.
3
  Based on 50 wagon trains for all container terminals except CTCT which is based on 40 wagon trains.
4
  Rake process time inside tippler – subject to service design review.
5
  Targets based on historical operational methodology.
n/a – not available.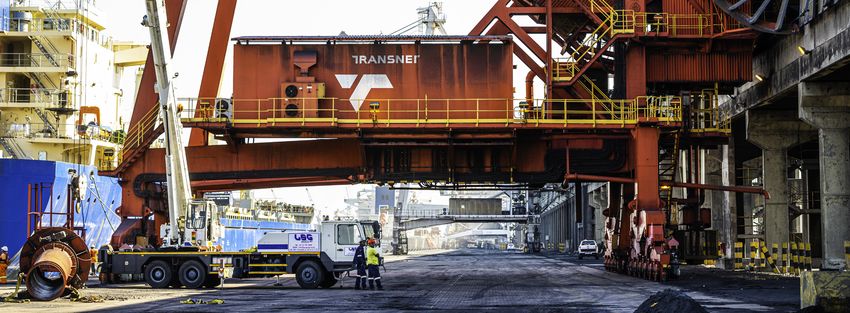
Transnet Port Terminals 2019
                                                                                                                                                                     7

Financial performance review
                                                                                                                Year ended        Year ended
                                                                                                                 31 March          31 March
                                                                                                                      2019              2018                 %
Salient features                                                                                                  R million         R million            change

Revenue                                                                                                              13 086            12 393                5,6

– Containers                                                                                                           6 587            6 287                4,8
– Dry bulk                                                                                                             3 719            3 522                5,6
– Break–bulk                                                                                                           1 958            1 816                7,8
– Automotive                                                                                                             822              768                7,0

Operating expenses                                                                                                    (8 545)           (8 221)              3,9

– Energy costs                                                                                                          (668)             (617)              8,3
– Maintenance                                                                                                           (434)             (379)             14,5
– Materials                                                                                                             (522)             (481)              8,5
– Personnel costs                                                                                                     (4 492)           (4 412)              1,8
– Other                                                                                                               (2 429)           (2 332)              4,2

Profit from operations before depreciation, derecognition,
amortisation and items listed below (EBITDA)                                                                           4 541             4 172               8,8
Depreciation, derecognition and amortisation                                                                          (1 524)           (1 705)            (10,6)

Profit from operations before items listed below                                                                      3 017             2 467               22,3

Impairments and fair value adjustments                                                                                  (768)             (249)           208,4
Net finance costs                                                                                                        (62)             (252)           (75,4)

Profit before taxation                                                                                                2 187             1 966               11,2

Total assets (excluding CWIP)                                                     R million                          13 871            15 396                (7,9)

Profitability measures
EBITDA margin1                                                                    %                                    34,7              33,7                1,0
Operating margin2                                                                 %                                    23,1              19,9                3,2
Return on average total assets (excluding CWIP)3                                  %                                    20,5              15,5                5,0
Asset turnover (excluding CWIP)4                                                  times                                  0,9               0,8              12,5
Capital investments5                                                              R million                           1 515             1 365               11,0

Employees
Number of employees (permanent)                                                   number                              7 392             7 096                4,2
Revenue per employee                                                              R million                            1,77              1,75                1,1
1
    EBITDA expressed as a percentage of revenue.
2
    Profit from operations before impairment of assets, fair value adjustments, net finance costs and taxation expressed as a percentage of revenue.
3
    Profit from operations before impairment of assets, fair value adjustments, net finance costs and taxation expressed as a percentage of average total assets,
    excluding capital work-in-progress (CWIP).
4
    Revenue divided by average total assets, excluding CWIP.
5
    Actual capital expenditure (replacement plus expansion), excluding borrowing costs and including capitalised decommissioning liabilities.
Transnet Port Terminals 2019
                                                                                                                                             8

Performance commentary                                                 • Capacity in East London’s automotive terminal will expand,
                                                                         increasing the capacity of the terminal to meet volume forecast.
Financial sustainability                                               • Berth 702 at the RB DBT will be converted from import to
                                                                         export in order to cater for higher export volumes.
• Revenue grew by 5,6% to R13,1billion (2018: R12,4billion) but
                                                                       • A combination of a third tippler and a multi-purpose ship loader
  fell short of the budget by 3%. This was as a result of poor
                                                                         at the RB DBT will boost dry bulk exports by an additional
  volume performance achieved in the containers, bulk and
                                                                         4 mtpa.
  break-bulk sectors.
• Net operating expenses grew by 3,9% to R8,5 billion from the
  prior year (2018: R8,2 billion). While costs have been tightly       Operational performance
  managed, some of the key drivers of the higher costs were:
                                                                       Containers
  –– Energy, which increased by 8,3% on the back of above-
     inflation price increases as well as significant volume growth    • Volumes in the container sector were 2% below budget for
     in the break-bulk and automotive sector;                            2019, declining 2,8% from the prior year.
  –– Higher repairs and maintenance costs due to ageing                • Export containers were 2,7% above the budget while imports
     equipment, particularly in Richards Bay; and                        and transshipments were 1,5% and 11% below budget
  –– Higher materials due to additional component spares and             respectively.
     materials requirements.                                           • All container terminals were significantly impacted by adverse
• As a result of the above, EBITDA increased by 8,8% to                  weather conditions throughout the year. Strong winds, fog,
  R4,5 billion (2018: R4,2 billion) meeting the 2019 target. The         heavy rains and vessel ranging have resulted in intermittent
  EBITDA margin increased from 33,7% to 34,7% in 2019.                   stoppages, long delays and cancellations as shipping lines
• Return on average total asset (ROTA) increased from 15,5% to           struggled to maintain schedules. Adverse weather conditions in
  20,5% in 2019. This is as a result of higher than budgeted             other parts of the world also led to further delays and
  operating profits as well as an asset base that was lower than         cancellations.
  expected. The latter was impacted by capital spend                   • The Durban terminals performed well during the reefer season,
  prioritisation and asset impairments.                                  however, bad weather combined with equipment and labour
                                                                         challenges resulted in both Pier 1 and Pier 2 not achieving their
Looking ahead                                                            full-year budgets.
• Port Terminals anticipates an increase in revenue of 13% to          • The NCT had a slow start to the year as the local economy
  R14,8 billion in the 2020 financial year.                              continues to deteriorate, however, strong performance in the
• There will be strong focus on operational efficiency and               last quarter helped the terminal finish the year 0,7% ahead of
  unlocking new business initiatives while enhancing a high              its budget.
  performance culture across the division.                             • The Port Elizabeth Container Terminal suffered a massive blow
                                                                         during the year when one of its cranes fell into the harbour
Capacity creation and maintenance                                        during adverse weather conditions and another crane was taken
                                                                         out of operation for safety reasons. This left the terminal with
• Capital expenditure for the year was R1,5 billion, falling             only one crane to service the vessels calling at the terminal.
  marginally short of the adjusted budget of R1,64 billion. This       • CTCT has been severely impacted by deteriorating weather
  was primarily as a result of contract non-awards and completion        conditions, with some customers opting to bypass the terminal,
  delays on the Caillard refurbishment project at Richards Bay.          which resulted in the terminal volumes falling 5,3% below
• Phase 1 of the Saldanha Refurbishment Programme was                    budget.
  completed in 2019.
• Refurbishment of Shed 12 and railway replacement was                 Bulk
  completed in Maydon Wharf.
• Equipment deliveries, which will improve the fleet reliability and   • Volumes in the bulk sector ended the year 4% below budget,
  operational efficiencies, included:                                    representing a 0,9% decline from the previous year.
  –– 10 x Empty Container Handlers at DCT Pier 2;                      • The high demand for manganese continued in 2019 with Port
                                                                         Terminals opening up new channels in an effort to meet the
  –– 18 x Haulers at DCT Pier 1;
                                                                         required demand. Two new back-of-port facilities in Lohatla and
  –– 1 x Rail-mounted gantry crane at CTCT;
                                                                         Newcastle were opened in 2019, in addition to the ports of
  –– 10 x Excavators at Richards Bay Dry Bulk Terminal                   Durban and Richards Bay starting to export manganese during
     (RB DBT); and                                                       the year.
  –– 3 x 18-tonne forklifts and 3 x 32-tonne forklifts for Saldanha
                                                                       • Iron ore volumes ended the year 2,7% below budget as a result
     Multi-Purpose Terminal.
                                                                         of a number of supply chain challenges experienced during the
                                                                         year. These challenges include a number of derailments, tippler
Looking ahead                                                            breakdowns, an incident which damaged a rail bridge and
Planned five-year capacity creation projects to facilitate volume        adverse weather conditions that led to intermittent stoppages.
growth include the following:                                            These challenges have also resulted in lower stockpiles and
• The Cape Town phase 2B project, which involves resurfacing             lower volumes exported.
  work and the creation of a truck staging area and ancillary          • Magnetite volumes did not perform well as a result of low
  works, will increase the terminal’s capacity by 0,4 million TEUs,      demand for certain grades as well as production challenges
  from 1,0 million TEUs to 1,4 million TEUs.                             experienced at the mines.
• The introduction of mobile ship loaders at the Saldanha              • Coal volumes were below budget as demand reduces in an effort
  Multi-Purpose Terminal will increase its capacity from                 to curb carbon emissions.
  8,7 mtpa to 10 mtpa.                                                 • Chrome volumes were impacted by low volumes in the first
• The berth deepening and lengthening at the North Quay of               quarter as well the potential trade war between China and the
  DCT Pier 2 will restore berth capacity to 2,9 million TEUs.            US on Chinese steel imports.
Transnet Port Terminals 2019
                                                                                                                                             9

Break-bulk                                                            Operational excellence
• Break-bulk volumes performed well, exceeding the budget by
                                                                      Container moves per ship working hour
  1,6% and growing 4,1% from the prior year.
• Manganese volumes performed well in both Saldanha and               • Port Terminals’ primary measure of operational efficiency,
  Port Elizabeth, resulting in both terminals exceeding their           average moves per SWH has improved across most container
  annual budgets.                                                       terminals despite not meeting the 2019 targets.
• The Durban multi-purpose terminal also exceeded its budget as       • Durban Container Terminal’s Pier 1 has improved its SWH
  a result of good steel performance after the relaxation of            performance from 46 to 48 moves in 2019, while DCT
  import duties and the Safe Guard Duty introduced by                   Pier 2 has marginally increased its SWH from 53 to 54 moves.
  Government to protect the local industry.                             Both terminals were severely impacted by inclement weather,
                                                                        congestion due to high stack occupancy during the peak reefer
Automotive                                                              season and insufficient availability and reliability of key
                                                                        operating equipment.
• Automotive volumes showed good performance, ending the
                                                                      • The CTCT’s SWH has also increased marginally to 46 moves from
  year 2,5% ahead of budget, boasting 5,6% growth from the
                                                                        45 moves in the prior year. These improvements have been
  prior year.
                                                                        achieved despite the terminals experiencing operational
• The Durban Car Terminal ended the year 7,4% above budget,
                                                                        challenges due to adverse weather conditions.
  however, the Port Elizabeth and East London terminals were
                                                                      • The NCT SWH has decreased from 50 to 47 moves due to
  impacted by the emissions legislation in the UK requiring a
                                                                        limitations in people resources, which is being addressed. The
  specification rework of vehicles. This led to a slowdown in
                                                                        terminal has also experienced a significant decline in weather
  exports while manufacturers adapted to the new legislation.
                                                                        conditions, which has had a negative impact on operations.
Looking ahead
                                                                      Moves per gross crane hour
Volume targets for the 2020 financial year:
                                                                      The average moves per gross crane hour declined to
• Containers: 4,86 million TEUs
                                                                      22 moves (2018: 25 moves), falling short of the 2019 targets
• Bulk cargo: 85,6 million tons
                                                                      across the container terminals. Some of the key reasons include
• Break-bulk cargo: 21,7 million tons                                 the significant deterioration in weather conditions over the past
• Automotive units: 724 141 units                                     year and the poor reliability and availability of key operating
                                                                      equipment.
Port Terminals will:
• Implement Port Terminals’ core container strategy to increase       Train turnaround time
  maritime connectivity, grow rail market share and transform
  into a logistics service provider.                                  The container terminals maintained their train turnaround time
• Increase maritime connectivity through improvements in service      below the targeted four hours in 2019 while the bulk terminals
  levels, appropriate pricing solutions, capacity creation projects   maintained their train turnaround times at the targeted
  and the introduction of value-added services.                       109 minutes at Saldanha and below the targeted 11 and
• Maximise manganese throughput through the use of inland             12 hours at Richards Bay and Port Elizabeth respectively.
  terminal networks and back-of-port facilities.
• Maximise magnetite throughput by providing an integrated            Truck turnaround time
  logistics service offering to support the beneficiated magnetite    The average truck turnaround time was 42 minutes against a
  volumes coming out of the Phalaborwa complex.                       target of 35 minutes. The terminals were impacted by equipment
• Maximise chrome ore and ferrochrome volumes through the use         challenges and weather delays, which resulted in delays in turning
  of inland terminal networks and back-of-port facilities,            around trucks inside the terminals.
  culminating in an integrated Transnet logistics service offering.
• Leverage existing partnerships to maximise and grow coal            Looking ahead
  volumes via Richards Bay export facilities.
                                                                      Port Terminals will:
• Rollout the PSP programme to increase agricultural volumes in
  Durban and East London.                                             • Seek to increase SWH to 53 moves on average in the
                                                                        2020 financial year by focusing on the following efficiency
• Create capacity ahead of demand for the increase in automotive
                                                                        improvements:
  volumes in Durban over the next five years.
                                                                        –– Resourcing gangs and supporting equipment to maximise
• Increase the volume (moves/tonnes/units) per ship working hour
                                                                           crane deployment across vessels;
  (SWH) to turn vessels around faster and attract shipping lines
  to South Africa.                                                      –– Employing wind mitigation strategies such as anti-sway
                                                                           technology on cranes as well as new technology to address
• Collaborate closely with Freight Rail and the National Ports
  Authority to improve operational efficiencies and strengthen             vessel ranging;
  Port Terminals’ position as a gateway terminal to serve both          –– Working collaboratively with shipping lines to optimise
  local and regional economies.                                            stowage, thus enabling higher productivity;
• Develop competitive value propositions to provide customers           –– Leveraging technology to enable more efficient planning of
  with complete logistics solutions through supply chain                   vessels; and
  integration.                                                          –– Creating a base layer of business intelligence and prescriptive
• Leverage technology to improve customer experience and                   analysis of operational statistics.
  service offerings.                                                  • Maintain truck turnaround time below the target of 41 minutes.
Transnet Port Terminals 2019
                                                                                                                                                     10

• Maintain train turnaround times below four hours at the                       • 189 artisans were assessed on outcomes-based modular
  container terminals, 12 hours at the Port Elizabeth bulk                        learning.
  terminal, 11 hours at the Richards Bay bulk terminal and 109                  • A total of 836 employees trained on Lean Six Sigma.
  minutes at the Saldanha iron ore terminal.                                    • Youth programme activities in Port Terminals include:
• Work collaboratively with the National Ports Authority to                       –– 103 apprentices in training;
  minimise the impact of infrastructure projects on operations.                   –– 34 young professionals in training; and
• Focus on cultivating an innovative culture and establishing                     –– 15 engineers in training.
  partnerships with other organisations for research and
  development.                                                                  Health and safety
                                                                                • Port Terminals achieved a DIFR of 0,52 against a target of 0,70.
Sustainable Developmental Outcomes
Human capital (employment and transformation)                                   Community development (social
• Port terminals achieved a permanent employee headcount of                     accountability)
  7 392 against the target of 8 132.                                            Highlights for the reporting period include:
• Black employees represented 88% of the total employee base                    • Port Terminals, together with supplier Fast World Industries and
  against a target of 89%.                                                        City Late, donated a new classroom to Yiboni Primary school in
• Female employees represented 28% of the total employee base                     May 2018. The joint initiative was part of an ongoing objective
  against a target of 32%.                                                        to leverage off relationships with suppliers for the benefit of
• People with disabilities represented 1,4% of the total employee                 the communities in which Port Terminals operates.
  base target of 3,2%.                                                          • Port Terminals also held a number of blood donation drives
• Port Terminals achieved its objective of obtaining a B-BBEE                     across the country in an effort to assist the South African
  scorecard rating of level 3.                                                    National Blood Services (SANBS) to build up stocks.
                                                                                • Employees from Port Terminals donated clothing and blankets
Skills development                                                                on 18 July 2018, as part of celebrating Nelson Mandela Day. The
                                                                                  donations were distributed to St Monica’s Old Age Home and the
• Port Terminals spent 3,2% (direct, indirect and skills levies cost)             Addington Children’s Home.
  of its total labour bill on employee training and skills                      • The sustainability team donated vegetables harvested from the
  development.                                                                    Head Office vegetable gardens to the Wentworth Aids Action
• A total of 949 employees underwent sector-specific training,                    Group (WAAG). The WAAG provides a hot meal daily to children
  such as Operator: Lifting Equipment (OLE), Operator: Bulk                       between the ages of 6 and 18 years from the soup kitchen.
  Handling Equipment (OBHE), Cargo Co-ordinators (CC) and                       • The sustainability team and employee volunteers
  Planners. An additional 1 115 employees completed refresher                     commemorated Arbour Day by donating and planting 12
  and recertification training.                                                   indigenous trees at Charles Hugo Primary School in Sydenham.
• A total of 237 managers and supervisors underwent various                     • Port Terminals marked 16 days of Activism against women and
  leadership programmes.                                                          child abuse with Head Office employees participating in a march
                                                                                  to create awareness.

Key risks and mitigating activities
The following table details Port Terminals’ top five risks and the key mitigating activities.

 Key risks                                          Mitigating activities

 Deterioration in macroeconomic                     • Quarterly presentation of commodity and customer profitability analysis
 environment leading to low margins                 • Identification of new revenue streams
                                                    • Benchmarking cost structures and efficiencies across terminals

 Inability to fund capital projects leading to      • Revise current capital prioritisation tool in line with Transnet’s digital strategy and
 capacity constraints, operational                    Port Terminals’ Top Five in Five strategy
 inefficiencies and loss of market share            • Implement post implementation reviews as per policy
                                                    • Monthly reporting of delays in capital spend to Port Terminals’ Capital Investment
                                                      Committee

 Operational inefficiencies leading to              •   Roll out of overall equipment efficiency monitoring
 customer dissatisfaction                           •   Implementation of spreader anti-sway system for rubber-tyre gantry cranes at CTCT
                                                    •   Straddle improvement project for CTCT
                                                    •   Acquisition of 18 haulers for DCT
                                                    •   Roll out the Scientific Gang configuration tool
                                                    •   Reskill OLEs at DCT Pier 1 and Pier 2 to improve performance
                                                    •   Review business processes (governance framework for standardisation)
                                                    •   Six Sigma training
Transnet Port Terminals 2019
11
Key risks Mitigating activities
Adverse sustainability events leading to • Business continuity management simulations are conducted for various scenarios
business disruption (e.g. droughts, storms • Increase capacity of reverse osmosis plant in Saldanha
and energy shortages) • Refurbishment of the Richards Bay water recycling plant (Delkor)
• Treatment of the borehole water for Richards Bay
• Disaster management plan
• Communication of weather information
Ageing critical equipment leading to • Upgrade of the ship unloaders in Richards Bay
business discontinuity • Commissioning of the Durban Agriport Substation
• Execution and commissioning of the Saldanha Tippler 3 project
• Refurbishment of the shiploader for Durban Agriport
• Replacement of the Durban Agriport ship unloader
• Implementation of the Richards Bay stacker replacement project
• Saldanha equipment refit project
• Refurbishment of cranes on the East Quay at the DCT
• Richards Bay tippler 1 and 2 capacity upgrade project
Opportunities
• There is growing demand for Port Terminals’ current services as
well as opportunities to expand service offerings across the
transport value chain. Opportunities are being explored
back-of-port to offer warehousing and value-add services in the
container, mineral bulk and automotive segments.
• Support of Transnet’s International Strategy by applying
strengths and capabilities to countries in Africa.
• PSP opportunities which may reduce funding and operational
requirements and present opportunities for leveraging the
capabilities of partners for mutual benefit.
• The Transnet Value Chain Co-ordinator continues to facilitate
improvements in operational efficiencies and logistics
integration with Freight Rail. This creates opportunities to shift
more cargo from road to rail, which will ease congestion on the
roads and reduce carbon emissions for a more sustainable
future.
• Offer tailor-made solutions to OEMs in the automotive industry.
• Partner with Government departments, such as the Department
of Trade and Industry in order to attract new OEMs.Transnet Port Terminals 2019
12
Abbreviations
B-BBEE Broad-Based Black Economic Empowerment
CTCT Cape Town Container Terminal
DCT Durban Container Terminal
DIFR Disabling injury frequency rate
EBITDA
Earnings before interest, taxation, depreciation and amortisation
mtpa Million tons per annum
NCT Ngqura Container Terminal
OEM Original equipment manufacturer
PSP Private sector partnership
RB DBT Richards Bay Dry Bulk Terminal
SHEQ Safety, Health, Environment and Quality
SOC State-Owned Company
TEU Twenty-foot equivalent unitYou can also read