RESEARCH BULLETIN - Fraser Institute
←
→
Page content transcription
If your browser does not render page correctly, please read the page content below
FRASER
RESEARCH              BULLETIN                                                           April 2019

Examining Federal Debt in Canada by
Prime Ministers Since Confederation, 2019
by Jake Fuss and Milagros Palacios

Summary                                            turns contributed significantly to the substan-
                                                   tial growth in debt per person that occurred

 Canada’s 23 prime ministers have each left a      during the tenures of Sir Robert Borden (188.1
legacy, and each of those legacies has an effect   percent) and William Lyon Mackenzie King
on all Canadians. One element critical to an       (145.2 percent).
analysis of each prime minister is whether he
or she left the federal government more or less

                                                    During economic downturns, the federal
                                                   government collects less revenue and spends
indebted than when first taking office.
                                                   more as incomes decline and Canadians draw

 This bulletin measures the debt legacies of       more on services such as Employment Insur-
all prime ministers since 1870, up to the ex-      ance. These downturns contribute significantly
pected end of Prime Minister Justin Trudeau’s      to federal debt accumulation, but are out of the
first term in 2019. We examine the percent-        direct control of prime ministers.
age change in inflation-adjusted gross debt
per person during the tenures of various prime

                                                    Upon completing his term in 2019, Prime
                                                   Minister Justin Trudeau is projected to be the
ministers. By accounting for population growth
                                                   largest accumulator of federal debt per person
and inflation, the level of debt accumulated by
                                                   (5.6 percent) among prime ministers who did
each prime minister can be compared through
                                                   not fight a world war or experience an eco-
Canada’s history.
                                                   nomic downturn during their tenure. Sir Mack-

 Historical context is vital to understanding      enzie Bowell and Sir John Abbott are the only
the debt legacies of each prime minister. For      other prime ministers in Canada’s history who
instance, global conflicts such as World War I     have increased federal debt without facing a
and World War II and multiple economic down-       global conflict or an economic downturn.

fraserinstitute.org                                                FRASER RESEARCH BULLETIN 1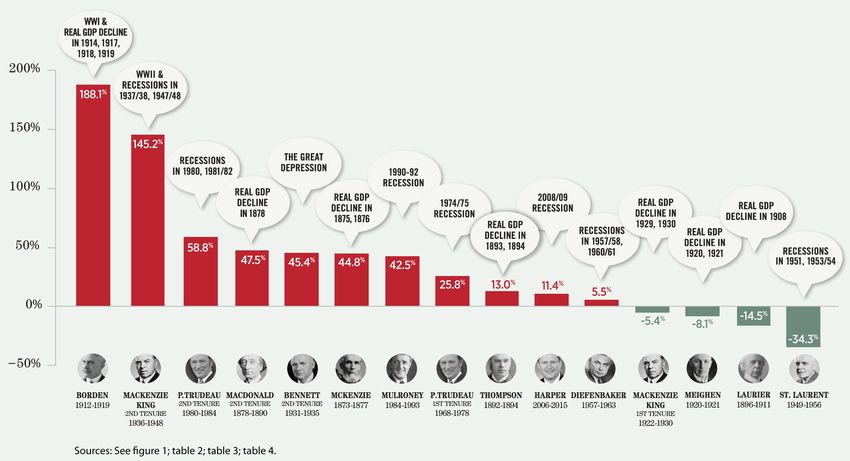
Prime Ministers and Federal Debt, 2019

Introduction                                          er—are allocated to whichever prime minis-
Over the last century and a half, Canada’s 23         ter was in office for the majority of the year. If
prime ministers have helped shape the country         a year was nearly evenly divided between two
in countless ways, leaving legacies that affect all   prime ministers, we assigned responsibility for
Canadians. Each prime minister’s legacy is ulti-      that year to whichever prime minister delivered
mately influenced by whether he or she left the       the year’s federal budget, and we list the allo-
federal government more or less indebted than         cated tenures in table 2.2
when taking office. Understanding the trajecto-       There were three instances where prime minis-
ry of debt is important because as the debt bur-      ters had non-continuous tenures. For example,
den grows, tax dollars must be diverted from          William Lyon Mackenzie King served as Cana-
public programs to service the federal govern-        da’s prime minister from 1922 to 1930 but was
ment’s annual interest payments. High amounts         defeated by R.B. Bennett, and then reassumed
of federal debt may also cause the government         office in 1935 for his second tenure. Sir John
to raise taxes in future, which burdens future        A. Macdonald also served twice (1867-1872 and
generations with the cost of past spending.           1878-1890), as did Pierre Trudeau (1968-1978
This bulletin examines the history of federal         and 1980-1984). We chose to divide the time in
debt in Canada since Confederation and analyz-        office for these prime ministers into separate
es the impact that various prime ministers have       tenures to ensure the change in federal debt
had on debt accumulation throughout their ten-        that happened under another prime minister
ures.1 The bulletin has two main sections. The        was not allocated to these three prime min-
first describes the method used to measure the        isters when they were out of office. This ap-
change in federal debt. The second provides a         proach ensures, for instance, that R.B. Bennett’s
comprehensive overview of the changes in fed-         debt between 1931 and 1935 is not allocated to
eral debt under each prime minister.                  William Lyon Mackenzie King.

                                                      There are 20 prime ministers included in this
Measuring the change in federal debt                  analysis, as opposed to 23, because the tenures
Debt legacies for the prime ministers are mea-        of three prime ministers were too short for us
sured by calculating the change in debt during        to allocate a budget year to them. Sir Charles
their respective tenures. The first step in the       Tupper was prime minister for two months, and
analysis is to allot the period(s) of tenure for      Kim Campbell and John Turner each held office
each prime minister as listed in table 1.             for three months. Notwithstanding the exclu-
                                                      sion of these three prime ministers, table 2 lists
We allocated years of tenure for every prime
minister using the methodology of Fuss et al.         2
                                                        Prime Ministerial tenures range from a single year
(2019), who analyzed spending levels by prime
                                                      to 15 years, which means that some prime ministers
minister since 1870. Transitional years—years of      were in office longer than others to either accumu-
overlap in which prime ministers shifted pow-         late or reduce federal debt. However, longer tenures
                                                      do not necessarily translate into larger total in-
                                                      creases or decreases in debt. In fact, the correlation
1
  This bulletin is based on and draws partly from     between length of tenure and the total increase in
work by Di Matteo (2017), Lammam and MacIntyre        debt per person over that tenure (the measure used
(2017), and Fuss et al. (2019).                       in this bulletin) is relatively weak (p = 0.30).

fraserinstitute.org                                                    FRASER RESEARCH BULLETIN 2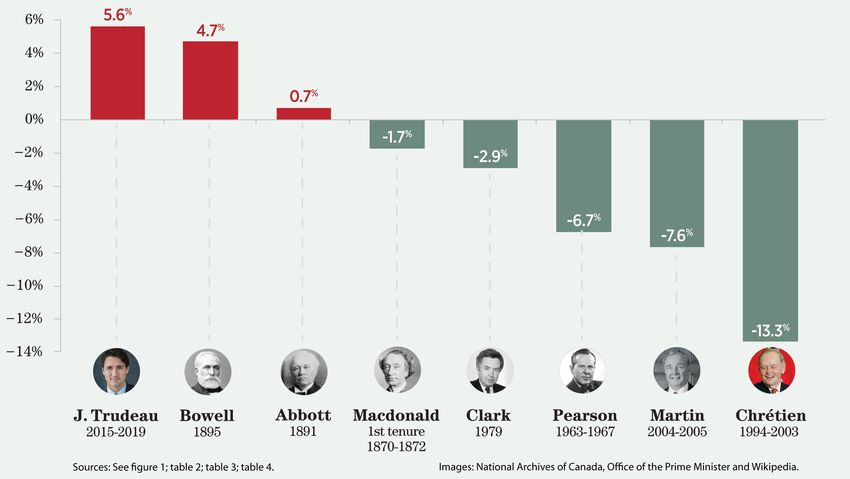
Prime Ministers and Federal Debt, 2019

Table 1: Canada’s 23 Prime Ministers, Their Political Party, and Time in Office

 Prime Minister                       Party                                                 Time in Office

 Sir John A. Macdonald                Liberal Conservative Party                            1867-1873, 1878-1891
 Alexander Mackenzie                  Liberal Party                                         1873-1878
 Sir John Abbott                      Liberal Conservative Party                            1891-1892
 Sir John Thompson                    Liberal Conservative Party                            1892-1894
 Sir Mackenzie Bowell                 Conservative Party                                    1894-1896
 Sir Charles Tupper                   Conservative Party                                    1896
 Sir Wilfrid Laurier                  Liberal Party                                         1896-1911
 Sir Robert Borden                    Conservative Party, Unionist Party                    1911-1917, 1917-1920
 Arthur Meighen                       National Liberal and Conservative Party,              1920-1921, 1926
                                      Conservative Party
 William Lyon Mackenzie King          Liberal Party                                         1921-1926, 1926-1930,
                                                                                            1935-1948
 R.B. Bennett                         Conservative Party                                    1930-1935
 Louis St. Laurent                    Liberal Party                                         1948-1957
 John Diefenbaker                     Progresssive Conservative Party                       1957-1963
 Lester B. Pearson                    Liberal Party                                         1963-1968
 Pierre E. Trudeau                    Liberal Party                                         1968-1979, 1980-1984
 Joe Clark                            Progresssive Conservative Party                       1979
 John Turner                          Liberal Party                                         1984
 Brian Mulroney                       Progresssive Conservative Party                       1984-1993
 Kim Campbell                         Progresssive Conservative Party                       1993
 Jean Chretien                        Liberal Party                                         1994-2003
 Paul Martin                          Liberal Party                                         2003-2006
 Stephen Harper                       Conservative Party                                    2006-2015
 Justin Trudeau                       Liberal Party                                         2015-Present

 Notes
 1) Sir Robert Borden led the Conservative Party from October 10, 1911 to October 11, 1917, and then the Unionist Party
 from October 12, 1917 to July 10, 1920. The Unionist Party was a centre-right party primarily consisting of members of the
 Conservative Party along with some former members of the Liberal Party.

 2) The National Liberal and Conservative Party is the name adopted by the Conservative Party in 1920 after the end of the
 Unionist Party.

 Source: Parliament of Canada (2019); Fuss et al. (2019).

fraserinstitute.org                                                                FRASER RESEARCH BULLETIN 3
Prime Ministers and Federal Debt, 2019

Table 2: Prime Ministers Assessed and Their Allotted Tenures

 Prime Minister                                                Allotted Tenure

 Sir John A. Macdonald                                         Tenure 1: 1867-1872
                                                               Tenure 2: 1878-1890
 Alexander Mackenzie                                           1873-1877
 Sir John Abbott                                               1891
 Sir John Thompson                                             1892-1894
 Sir Mackenzie Bowell                                          1895
 Sir Wilfrid Laurier                                           1896-1911
 Sir Robert Borden                                             1912-1919
 Arthur Meighen                                                1920-1921
 William Lyon Mackenzie King                                   Tenure 1: 1922-1930
                                                               Tenure 2: 1936-1948
 R.B. Bennett                                                  1931-1935
 Louis St. Laurent                                             1949-1956
 John Diefenbaker                                              1957-1963
 Lester B. Pearson                                             1963-1967
 Pierre E. Trudeau                                             Tenure 1: 1968-1978
                                                               Tenure 2: 1980-1984
 Joe Clark                                                     1979
 Brian Mulroney                                                1985-1993
 Jean Chretien                                                 1994-2003
 Paul Martin                                                   2004-2005
 Stephen Harper                                                2006-2015
 Justin Trudeau                                                2015-2019

 Notes
 1) The fiscal year-end for the federal government was changed from June 30th to March 31st in 1907.
 2) Does not include budgets for 1867–1869 due to a lack of inflation data for those years.
 3) The 1984 budget was allocated to the tenure of Pierre Trudeau even though John Turner served as PM during the year
 before losing the general election to Brian Mulroney and the Progressive Conservative Party.
 4) The 1993 budget was allocated to the tenure of Brian Mulroney even though Kim Campebll served as PM during the
 year before losing the general election to Jean Chretien and the Liberal Party.
 5) For details on the specific allocation of budgets, see Fuss et al. (2019).

 Source: Fuss et al. (2019).

fraserinstitute.org                                                                  FRASER RESEARCH BULLETIN 4
Prime Ministers and Federal Debt, 2019

23 tenures because each of Macdonald, Mack-             might serve as a measure of a government’s po-
enzie King, and Pierre Trudeau had multiple             tential financial capacity. However, in this bul-
tenures.                                                letin, we focus on gross debt as a measure of
                                                        federal debt for two primary reasons. First, it
For the 2015/16 fiscal year, Fuss et al. (2019)
                                                        might be difficult for the federal government
made an adjustment for the transition from
                                                        to sell some financial assets, such as employee
Stephen Harper to Justin Trudeau. We have
                                                        or public pension assets, in part due to liquid-
made a similar adjustment because Justin
                                                        ity issues; further, there may be valuation ques-
Trudeau increased government spending im-
                                                        tions surrounding outstanding loans, equity in-
mediately upon taking office in 2015. The
                                                        vestments, and advances, among instruments
original 2015 budget, under Stephen Harper,
                                                        on the asset side of the balance sheet. Second,
planned for a surplus ($1.4 billion), while the im-
                                                        the interest that governments pay on liabili-
mediate spending increases introduced by Jus-
                                                        ties is determined by gross debt rather than net
tin Trudeau ultimately led to a budget deficit
                                                        debt. Significant research has found that high
($2.9 billion). These spending changes meant
                                                        gross debt levels may harm economic perfor-
that more debt was amassed by Trudeau than
                                                        mance through, for example, the potential for
was planned for under Harper (Canada, De-
                                                        higher future taxes (see Reinhart and Rogoff,
partment of Finance, 2015 and 2018).3 As a re-
                                                        2010; Chudik et al., 2015; and Lammam et al.,
sult, the cut-off period for debt accumulation
                                                        2017 for a review of this research).4
under Harper was adjusted to reflect the debt
projected in the original 2015 budget ($1.1 tril-       Data on federal gross debt come from different
lion in 2019 dollars). The beginning point for the      sources. The Canada Year Books for 1940, 1950,
change in debt during Justin Trudeau’s tenure           1960, and 1967 were used to collect federal debt
is also the 2015 budget number.                         data from 1867 through 1966. Debt figures from
                                                        1967 to 2016 are drawn from the Fiscal Refer-
Measuring federal debt                                  ences Tables5 published by the Department
Collecting comparable data on federal debt is           of Finance, and federal debt data for the last
an important step in measuring the debt lega-           three years are taken from the 2019 Federal
cies of the prime ministers. Gross debt direct-
ly measures the degree to which the various             4
                                                          The previous version of this paper also used gross
prime ministers increased or decreased Cana-            debt data as its measure. Converting gross debt to
da’s financial liabilities. It is defined as the fed-   net debt was considered for the methodology in
eral government’s total amount of financial li-         this paper, and ultimately rejected for viability and
                                                        consistency concerns. In recent years, the defini-
abilities including employee benefits (pensions),
                                                        tions and dollar amounts assigned to federal finan-
interest-bearing debt, and accounts payable.            cial assets have changed substantially (e.g., equity
                                                        investments and loans, etc.). Concerns about asset
Net debt is gross debt less financial assets, the
                                                        valuations and liquidity are reiterated here. For fur-
latter of which governments may sell when               ther details, see Lammam et al. (2017).
needed to meet liabilities. Hence, net debt
                                                        5
                                                          The federal government revised the fiscal results
                                                        for 2008/09 to 2016/17 to reflect a change in meth-
3
  Notably, program spending was ultimately 5.0          odology determining the discount rate for unfunded
percent higher in 2015/16 than what was planned in      future benefits (Canada, Department of Finance,
the 2015 budget.                                        2018: 9).

fraserinstitute.org                                                       FRASER RESEARCH BULLETIN 5
Prime Ministers and Federal Debt, 2019
Figure 1: Federal Gross Debt, 1870-2019 (in 2019 $)
$1,400
$1,200
$1,000
Billions (2019 dollars)
$800
$600
$400
$200
$0
Sources: Canada, Department of Finance (2018 and 2019); Statistics Canada (2009a, 2009b, 2009c, 2009d); Altman (1992);
Urquhart (1988); Statistics Canada (2019a and 2019c); calculations by authors.
Budget.6 Debt projections for the 2019/20 fis- that is the first year for which the GDP deflator
cal year have been included to provide results price index is available.7
for the tenure to date of Prime Minister Justin
Figure 1 exhibits federal gross debt (inflation
Trudeau.
adjusted) from 1870 to 2019. The colours in the
Two adjustments were made to enable us to area graph are either red or blue, representing
more easily compare changes in federal debt each prime minister’s affiliated political party
over a long time. As in Fuss et al., 2019, we ac- during their tenure. Areas in red indicate debt
count for changes in the general price level (in-
flation) using a GDP deflator. The starting year
7
Data coverage is more complete for a gross
for the analysis of federal debt is 1870 since
domestic product price deflator as opposed to a
consumer price index, which guided our choice.
We use a GDP deflator with sources as follows: for
6
The 2019 federal budget restated the figures from 1870 through 1930, Altman (1992), a GNP deflator; for
2017/18 and onwards to reflect the change in ac- 1931 through 1960, Urquhart (1988); for 1961 through
counting treatment of the Canadian Commercial 2018, Statistics Canada (2019a); and for 2019-2022,
Corporation. Canada, Department of Finance (2019).
fraserinstitute.org FRASER RESEARCH BULLETIN 6Prime Ministers and Federal Debt, 2019
levels for liberal prime ministers, while conser- rect control of prime ministers, such as reces-
vative prime ministers are displayed in blue. sions or booms.
Figure 1 shows a clear pattern of increasing To focus on changes in the debt-to-GDP ratio
gross debt since 1870, though the dollar val- would therefore penalize prime ministers who
ues were low through to 1940. However, dur- served during recessions and would benefit,
ing World War II, inflation-adjusted federal by happenstance, prime ministers who served
gross debt increased almost 300 percent, as it during periods of economic expansions. When
grew from $80 billion in 1938, the year before recessions occur, the debt-to-GDP ratio tends
the war, to $318 billion in 1945. Notwithstand- to rise due to automatic increases in govern-
ing the immediate fall in gross debt following ment spending (e.g., employment insurance),
the end of the war, post-war debt levels did any stimulus spending, and the decrease in
not return to pre-war levels. Beginning in the economic output. Conversely, prime ministers
1950s, federal gross debt steadily increased who preside over strongly positive econom-
until 1996. ic growth may be more likely to record falling
debt-to-GDP ratios.
In the mid-1990s, Prime Minister Jean Chré-
tien introduced important fiscal reforms, and As an example of how variations in economic
gross debt began to decrease until the 2008 re- growth can dominate results, consider the 8.1
cession, when it again began to climb upward. percent growth in real GDP during R.B. Ben-
Federal gross debt is expected to reach its nett’s 1935 tenure. While debt as a share of GDP
highest level ever in 2019, at $1.2 trillion. decreased by 1.1 percentage points that year,
debt increased by 6.5 percent or $4.8 billion in
Although federal gross debt has mostly in-
2019 dollars; the decrease in debt-to-GDP was
creased throughout Canadian history, the
due to economic growth. Conversely, following
country’s population has also grown. Canada’s
the debt per person measure, debt increased by
population has grown from 3.5 million peo-
5.5 percent in 1935. Moreover, because popula-
ple in 1867 to a projected 37.4 million people in
tion growth is less variable over time than eco-
2019 (Statistics Canada, 2019b; Urquhart, 1988).
nomic growth, as mentioned above, we believe
As the population grows, the debt burden is
population-adjusted debt is better than the
shared by more people, so we report inflation-
debt-to-GDP ratio as a measure of debt accu-
adjusted gross debt per person.
mulation by prime minister.8
Another way of measuring debt accumulation
by prime minister would be to examine chang- Debt per person from 1870 to 2019
es in the debt-to-GDP ratio, rather than debt To provide historical context, figure 2 shows
per person. The debt-to-GDP ratio summarizes federal debt per person (in 2019 dollars) from
the ability of the government to sustain a given
amount of debt based on the size of the econ- 8
The population in Canada grew at an average
omy, but it would produce misleading results
annual rate of 1.6 percent from 1867 to 2018. The
for changes in debt levels by prime minister for standard deviation is 0.8 percentage points. The av-
several reasons. For instance, the GDP growth erage annual change in inflation-adjusted GDP is 2.4
rate is more variable, year-to-year, than is pop- percent from 1871 to 2018. The standard deviation is
ulation, and is subject to factors outside the di- 4.9 percentage points.
fraserinstitute.org FRASER RESEARCH BULLETIN 7Prime Ministers and Federal Debt, 2019
Figure 2: Federal Gross Debt per Person, 1870-2019 (in 2019 $)
$40,000
$35,000
$30,000
$25,000
$20,000
$15,000
$10,000
$5,000
$0
Sources: Canada, Department of Finance (2018 and 2019); Statistics Canada (2009a, 2009b, 2009c, 2009d); Altman (1992);
Urquhart (1988); Statistics Canada (2019a and 2019c); calculations by authors.
1870 to 2019: since Confederation, per-person There was another general increase in federal
federal debt levels have generally been ris- debt per person from the mid-1960s until 1995.
ing. However, some periods are noteworthy for Federal debt per person grew 225 percent from
their sharp increases and declines. For exam- 1966 ($11,387) until the historic peak in 1995
ple, federal debt per person rapidly increased ($37,054). After the mid-1990s, debt reduction
during both World War I and World War II. continued to be a focus for Jean Chrétien, Paul
Prior to World War I, in 1913, federal per-per- Martin, and for the first two years of Stephen
son debt amounted to $1,950, but had grown Harper’s tenure.9 Federal per-person debt fell
to $5,483 by war’s end (1918). Similarly, with re- to $25,267 in 2007, the lowest value since 1984.
spect to World War II, debt per person rose However, the 2008 financial crisis in the United
from $7,149 per person, in 1938, to $26,340 in States prompted a recession in Canada and fed-
1945 (all figures in 2019 dollars). Following each eral debt began to sharply increase once again.
world war, federal debt per person in Canada
declined for nearly a decade, but did not in ei- 9
For a discussion on fiscal reforms under Jean
ther case fall to pre-war levels. Chrétien, see Clemens et al. (2017).
fraserinstitute.org FRASER RESEARCH BULLETIN 8Prime Ministers and Federal Debt, 2019
By 2019, federal debt per person is expected to Table 3: Years and Amounts that (Real)
reach $32,589. Inflation-Adjusted GDP Declined,
1870-2018
Changes in federal debt per person by
prime minister Year Percent Sitting Prime Minister
decrease
When evaluating debt accumulation under the
various prime ministers, historical context is an 1875 4.2% Alexander Mackenzie
important consideration. Federal debt per per-
1876 1.7% Alexander Mackenzie
son increased dramatically during each world
war, as shown in figure 2. Sir Robert Borden and 1878 3.0% Sir John A. Macdonald
William Lyon Mackenzie King were the prime
1893 0.5% Sir John Thompson
ministers during those wars, and each of them
increased federal debt to finance Canada’s war 1894 0.4% Sir John Thompson
efforts, which plays a role in how we might un- 1908 4.6% Sir Wilfrid Laurier
derstand their debt legacies.
1914 6.8% Sir Robert Borden
Economic downturns also contribute to the ac-
1917 1.1% Sir Robert Borden
cumulation of debt by prime minister. During
periods of recession and declining market in- 1918 6.1% Sir Robert Borden
comes, the federal government receives less tax
1919 4.6% Sir Robert Borden
revenue and automatically increases spending
owing to programs like Employment Insurance 1920 0.5% Arthur Meighen
and the presence of income-tested benefits.10 1921 3.5% Arthur Meighen
As a consequence, governments are likely to
face declining budgetary balances during re- 1929 0.2% William Lyon Mackenzie King
cessions; while the debt accumulated by prime 1930 3.8% William Lyon Mackenzie King
ministers during downturns is not entirely out
1931 13.5% R.B. Bennett
of their control, we also consider the state of
the economy in evaluating debt legacies.11 1932 9.2% R.B. Bennett
1933 7.1% R.B. Bennett
10 1945 3.1% William Lyon Mackenzie King
During a downturn, spending on Employment
Insurance tends to go up as the newly jobless make 1946 1.0% William Lyon Mackenzie King
claims and unemployment spells lengthen; if house-
hold incomes decline, the value of refundable credits 1954 0.7% Louis St. Laurent
and income-tested benefits are likely to increase.
1982 3.2% Pierre E. Trudeau
Such automatic stabilizers are distinct from the
discretionary choices governments may make in 1991 2.1% Brian Mulroney
response to a downturn.
2009 2.9% Stephen Harper
11
Major government undertakings such as the con-
struction of national railways under Sir John A. Mac- Sources: Canada, Department of Finance (2018);
donald and Alexander Mackenzie, and the expansion Statistics Canada (2019c); Altman (1992); Urquhart
of social programs under Pierre Trudeau, might (1988); calculations by authors.
fraserinstitute.org FRASER RESEARCH BULLETIN 9Prime Ministers and Federal Debt, 2019
There are different aspects to measuring eco- Table 4: Canadian Recessions Since 1926
nomic downturns. One involves assessing the
years in which economic output shrank in real Years of recession Sitting Prime Minister(s)
terms. In Canadian history, there have been 23
years in which there was a year-over-year real 1929-1933 William Lyon Mackenzie King/
decline in GDP (table 3). The largest reductions R.B. Bennett
in GDP occurred in 1931, 1932, and 1933, de- 1937-1938 William Lyon Mackenzie King
pression years during R.B. Bennett’s tenure.
1947-1948 William Lyon Mackenzie King
However, there are years where the over- 1951 Louis St. Laurent
all growth rate was positive, but the economy
1953-1954 Louis St. Laurent
nonetheless showed a downturn; such circum-
stances may have adverse effects on federal 1957-1958 John Diefenbaker
debt accumulation and we seek to account for 1960-1961 John Diefenbaker
this. We take account of this in table 4, which
1974-1975 Pierre E. Trudeau
lists the years Cross and Bergevin (2012) recog-
nized as recessions, and the prime minister who 1980 Pierre E. Trudeau
held office during those years. While tables 3 1981-1982 Pierre E. Trudeau
and 4 mostly overlap, Cross and Bergevin (2012)
1990-1992 Brian Mulroney
include additional years of recession that are not
reflected in table 3. For example, Canada expe- 2008-2009 Stephen Harper
rienced downturns, or recessions, during John
Source: Cross and Bergevin (2012).
Diefenbaker’s tenure, in 1957-58 and in 1960-61,
and during Pierre Trudeau’s first tenure.
Percent change in federal debt per person
prime ministerial tenures shown, because three
by prime minister
prime ministers had multiple tenures in office.
How has inflation-adjusted federal debt per
person grown over the tenures of the Canadian Federal debt per person increased during 14 out
prime ministers? We divide the tenures of the of the 23 tenures that we examined; increas-
prime ministers, and show growth patterns in es in federal debt per person coincided with a
Figure 3a for those in office when a world war world war and/or an economic downturn in
or economic downturn was not taking place, 11 out of the 14 cases. And as indicated in fig-
and in Figure 3b the tenures during which ure 3a, Justin Trudeau emerges the largest debt
there was a world war or economic downturn. accumulator (5.6 percent) of any prime minis-
Economic downturns are identified as either or ter who did not experience a world war or an
both of a year-over-year drop in GDP, or a re- economic downturn during his tenure, and Sir
cession as defined by Cross and Bergevin (2012). Mackenzie Bowell (4.7 percent) came in second
As mentioned above, there are a total of 23 place on this measure. The third and final prime
minister to increase federal debt without facing
a global conflict or economic downturn was Sir
provide economic context for increases in federal John Abbott (0.7 percent). In contrast, five out
debt while remaining discretionary policy choices. of the eight prime ministers who did not expe-
fraserinstitute.org FRASER RESEARCH BULLETIN 10Prime Ministers and Federal Debt, 2019 Figure 3a: Percent Change in (Inflation-Adjusted) Debt per Person over Prime Ministerial Tenures Without a World War or Economic Downturn Figure 3b: Percent Change in (Inflation-Adjusted) Debt per Person over Prime Ministerial Tenures With a World War or Economic Downturn fraserinstitute.org FRASER RESEARCH BULLETIN 11
Prime Ministers and Federal Debt, 2019

rience a world war or economic downturn dur-                 King’s second tenure.13 However, Trudeau expe-
ing their tenures successfully reduced federal               rienced multiple economic downturns during his
debt per person. The list includes prime minis-              second tenure as prime minister, as Cross and
ters Jean Chretien (-13.3 percent), Paul Martin              Bergevin (2012) identified 1980 and 1981-1982
(-7.6 percent), and Lester Pearson (-6.7 percent).           as periods of recession. To illustrate, growth in
                                                             economic output decreased by 1.5 percentage
Changes in debt per person throughout the
                                                             points in 1980 and by 3.2 percent in 1982.
tenure of prime ministers during a world war
or economic downturn appear in Figure 3b. The                The remaining prime ministers who oversaw
prime minister during World War I, Sir Robert                per-person debt increases (as shown in Fig-
Borden, oversaw by a wide margin the largest                 ure 3b) had increases ranging from 5.5 percent
percentage increase in debt per person. Bor-                 (John Diefenbaker) to 47.5 percent (Sir John A.
den served from 1912 to 1919 and federal debt                Macdonald’s second tenure). Similar to Mack-
per person increased by 188.1 percent in that                enzie King, Sir John A. Macdonald managed to
time. However, Borden’s tenure coincided with                decrease per-person debt levels during his first
a decline in economic growth in four out of the              tenure (-1.7 percent), but registered a signifi-
eight years that he was in office (1914, 1917, 1918,         cant increase in his second tenure. However,
and 1919) in addition to fighting World War I.               Macdonald encountered a declining GDP dur-
                                                             ing 1878.
William Lyon Mackenzie King oversaw the sec-
ond largest percentage increase in debt per                  Four prime ministers reduced levels of per-
person (145.2 percent) during his second ten-                person debt even though they faced economic
ure. That tenure was between 1936 and 1948,                  downturns during their tenures. Louis St. Lau-
which covered the period of World War II and                 rent recorded the largest debt reduction of any
four different economic downturns—two reces-                 prime minister during his tenure. He succeed-
sions (1937-38 and 1947-48) and two years of                 ed in reducing per-person debt by 34.3 per-
declining economic growth (1945 and 1946). In                cent from 1949 to 1958 and accomplished this
contrast, Mackenzie King attained a 5.4 percent              notwithstanding recessions in both 1951 and
reduction in federal debt per person during his              1953-54. Similarly, Sir Wilfrid Laurier, Canada’s
first tenure, when there was no global conflict.             seventh prime minister, oversaw a reduction
                                                             in federal debt per person of 14.5 percent. In-
Pierre Trudeau recorded the next highest per-
person debt increase during his second ten-
ure. He increased debt by 58.8 percent,12 which
                                                             Trudeau’s second tenure, the calculation for this
is less than half the increase during Mackenzie
                                                             tenure in figure 3 excludes “other liabilities.”
                                                             13
                                                                Pierre Trudeau’s two tenures in office were inter-
12
   During Pierre Trudeau's second tenure (1980-              rupted by a single year with the victory and subse-
1984), a change in accounting practices meant that           quent defeat of Joe Clark in 1979. Pierre Trudeau’s
debt from federally-owned crown corporations was             tenures are separated to be consistent with the
added to federal government debt. This is reflected          method used with Sir John A. Macdonald and Wil-
in the Fiscal Reference Tables, which itemized an in-        liam Lyon Mackenzie King. If Pierre Trudeau’s two
crease in the category of debt referred to as “other         tenures are combined, debt per person increased by
liabilities” from $3.5 billion in 1982 to $29.5 billion in   112 percent under him. (This total growth includes
1983. To ensure a consistent time series for Pierre          the 3 percent reduction under Joe Clark.)

fraserinstitute.org                                                          FRASER RESEARCH BULLETIN 12
Prime Ministers and Federal Debt, 2019
terestingly, the percent reductions during both Canada, Department of Finance (2019). Invest-
St. Laurent’s and Laurier’s tenures are higher ing in the Middle Class: Budget 2019. Gov-
than the reduction during Jean Chrétien’s ten- ernment of Canada. ,
economic recession. The final two prime min- as of March 21, 2019.
isters who oversaw reductions in per-person Chudik, Alexander, Kamiar Mohaddes, M. Hash-
debt levels during global conflicts or economic em Pesaran, and Mehdi Raissi (2015). Is there
downturns are Arthur Meighen (-8.1 percent) a Debt-threshold Effect on Output Growth?
and William Lyon Mackenzie King in his first IMF Working Paper WP/15/197. International
tenure (-5.4 percent). Monetary Fund. , as of
April 1, 2019.
Conclusion
Federal debt per person changed remarkably Clemens, Jason, and Milagros Palacios (2017).
and in different ways during the tenures of Prime Ministers and Government Spending: A
each Canadian prime minister from 1870 to the Retrospective. The Fraser Institute. , as of March 21, 2019.
cumulator among prime ministers who did not
fight a world war or experience an economic Fuss, Jake, Milagros Palacios, and Jason Clem-
downturn during their tenure. Sir John Abbott ens (2019). Prime Ministers and Government
and Sir Mackenzie Bowell, Canada’s third and Spending: 2019 Edition. The Fraser Institute.
fifth prime ministers respectively, are the only , as of March 21, 2019.
flict or an economic downturn. Clemens, Jason, Milagros Palacios, Mathew Lau,
and Niels Veldhuis (2017). End of the Chretien
References Consensus? Fraser Institute. , as of March 21, 2019.
an GNP Estimates and Canadian Econom-
ic Growth, 1870-1926. Review of Income and Cross, Philip, and Philippe Bergevin (2012).
Wealth Series 38, 4 (December): 455-474. Turning Points: Business Cycles in Canada
since 1926. CD Howe Institute. , as of March 21, 2019.
Di Matteo, Livio (2017). A Federal Fiscal His-
Canada, Department of Finance (2018). Fiscal
tory: Canada, 1867-2017. The Fraser Insti-
Reference Tables 2018. Government of Canada.
tute. , as of March 21, 2019.
fraserinstitute.org FRASER RESEARCH BULLETIN 13Prime Ministers and Federal Debt, 2019
Lammam, Charles, and Hugh MacIntyre (2017). www150.statcan.gc.ca/t1/tbl1/en/
An Analysis of Federal Debt in Canada by tv.action?pid=3610013001>, as of March 21,
Prime Ministers since Confederation. The Fra- 2019.
ser Institute. , as of March 21, 2019. Age and Sex, as of July 1, Canada, Provinces
and Territories, Annual. Government of Can-
Lammam, Charles, Hugh MacIntyre, Feixue Ren, ada. , as of March 21,
ment Debt in Canada, 2017. The Fraser Insti- 2019.
tute. , as of March 21, 2019. Gross Domestic Product, Expenditure Based,
Canada, Quarterly. ,
of Canada. Web page. Parliament of Canada. as of March 21, 2019.
, as of March Urquhart M.C. (1988). Canadian Economic
21, 2019. Growth 1870-1980. Discussion Paper No. 734.
Queen’s University, Economics Department.
Reinhart, Carmen, and Kenneth Rogoff (2010).
Growth in a Time of Debt. American Economic
Review 100, 2 (May): 573–78.
Statistics Canada (2009a). Canada Year Book
1940. Government of Canada. , as of March 21, 2019.
Statistics Canada (2009b). Canada Year Book
1950. Government of Canada. , as of March 21, 2019.
Statistics Canada (2009c). Canada Year Book
Copyright © 2019 by the Fraser Institute. All rights
1960. Government of Canada. , as of March 21, 2019.
ISSN 2291-8620
Statistics Canada (2009d). Canada Year Book
Media queries: For media enquiries, please contact
1967. Government of Canada. , as of March 21, 2019.
Support the Institute: call 1.800.665.3558, ext. 574
Statistics Canada (2019a). Table 36-10-0130- or e-mail: development@fraserinstitute.org
01: Gross Domestic Product Indexes, An-
Visit our website: www.fraserinstitute.org
nual. Government of Canada.Prime Ministers and Federal Debt, 2019
Milagros Palacios is the Associate
Director of the Addington Centre Acknowledgments
for Measurement at the Fraser
Institute. She holds a BSc in Indus This bulletin was inspired by the 2017 work
trial Engineering from the Pon
of Professor Livio Di Matteo and his analy-
tifical Catholic University of Peru
sis of the finances of Canada over its his-
and an MSc in Economics from the
University of Concepción, Chile. tory (A Federal Fiscal History: Canada, 1967-
2017) and related work by Jason Clemens
and Milagros Palacios (Prime Ministers and
Government Spending: A Retrospective). The
Jake Fuss is a Policy Analyst at the authors would like to thank Charles Lam-
Fraser Institute. He holds a Bach- mam and Hugh MacIntyre, who contribut-
elor of Commerce and a Master’s ed to an earlier version of this study. They
Degree in Public Policy from the also thank Finn Poschmann for his review
University of Calgary. and invaluable feedback. The authors would
also like to express their appreciation to the
anonymous reviewers of earlier versions of
this paper. Any remaining errors or omis-
sions are the sole responsibility of the au-
thors. As the researchers have worked in-
dependently, the views and conclusions
expressed in this paper do not necessarily
reflect those of the Board of Directors of
the Fraser Institute, the staff, or supporters.
fraserinstitute.org FRASER RESEARCH BULLETIN 15You can also read