No postcode untouched - Stroke in Australia 2017 - Stroke in Australia 2017 ...
←
→
Page content transcription
If your browser does not render page correctly, please read the page content below
No postcode
untouched
Stroke in Australia
2017
Key insights
                                                                        Regional
                                                                        Australians are

      9
                    In 2017, someone has                                19 percent
                    a stroke in Australia                               more likely to
                    every 9 minutes                                     suffer a stroke
                                                                        than those in
                                                                        metropolitan
                                                                        areas.

                                        2050:

                           56,000

                          2017:
                          stroke survivors =

                         475,000

  Highest stroke incidence                              Australia’s stroke
  per capita                                            hotspot North coast, NSW

      SA                                                  NSW
                       TAS

Federal electorate stroke and stroke risk numbers are detailed in full on the Stroke
Foundation website strokefoundation.org.au/no-postcode-untouched and paint the
clearest picture yet of the impact of stroke in Australian cities and towns.
Introduction                                                 What is stroke?
Every nine minutes someone in Australia will suffer          Stroke attacks the brain – our most vital organ. A stroke
a stroke. By 2050, without action, this number will          occurs when blood supply to the brain is cut off because
increase to one stroke every four minutes.                   of a clot blocking an artery (ischaemic stroke) or due to a
                                                             burst artery (haemorrhagic stroke). When blood supply to
In 2017 alone, Australians will suffer more than
                                                             the brain is blocked brain cells begin to die at a rate of
56,000 strokes. Many of these will be experienced
                                                             1.9 million a minute.
by people living in regional Australia. In fact,
regional Australians are 19 percent more likely              Every stroke is different depending on where in the
to suffer a stroke than those living in a                    brain it strikes and how severe it is. What is common is
metropolitan area.                                           the devastation it can cause the survivor, their carer and
                                                             family.
Advancements in stroke treatment and care mean
that stroke is no longer a death sentence for
many. However for the more than 470,000 stroke
survivors and their families living in our community
its impacts are far reaching. Patient outcomes from
stroke vary widely depending on where you live
and your access to a stroke unit.
No postcode untouched, Stroke in Australia 2017
demonstrates the impact of stroke on millions of lives
in cities and towns across the nation now and into
the future. It highlights the ever increasing burden of      Ischaemic stroke               Intracerebral haemorrhage
stroke on regional and rural Australia. The challenge        – a clot                       – a bleed
to our health system is significant.

                                                             The impact of
In this latest report we provide analysis of stroke
statistics and estimations by Federal electorate of the
incidence of stroke, the number of stroke survivors
living in the community and the leading risk factors
for preventable stroke. Risk factors include high blood
pressure, high cholesterol, atrial fibrillation (irregular
                                                             stroke
heartbeat) and physical inactivity.
Using population, health and research data we have           Stroke is a leading cause of disability for Australians.
also estimated the number of new strokes in Australia        Consequences of stroke can include:
over the next 30 years.
                                                             ›› Weakness or paralysis of the face, arm or leg.
No postcode untouched, Stroke in Australia 2017              ›› Blurred vision or loss of vision.
tells the story of stroke and provides a roadmap for
                                                             ›› Difficulties communicating, speaking or understanding.
targeted action to improve outcomes for patients.
The data provides a clear view of the cities and towns       ›› Difficulty with memory and thinking.
where stroke is having its biggest impact, where the         ›› Problems completing everyday activities such as
need for stroke survivor support is most urgent and             dressing and eating.
where the future stroke hotspots are located.
                                                             There is significant unmet need for stroke survivors.
The Stroke Foundation is a national charity that             Most stroke survivors report having unmet needs in the
partners with the community to prevent, treat and            one or more years after their stroke. Eighty-four percent
beat stroke. We do this through raising awareness,           describe unmet health needs relating to concentration,
facilitating research and supporting stroke                  cognition, memory, fatigue and emotion. Thirty-nine
survivors.                                                   percent and 17 percent respectively1 report unmet
                                                             needs relating to home help and personal care.

                                                                                                                           3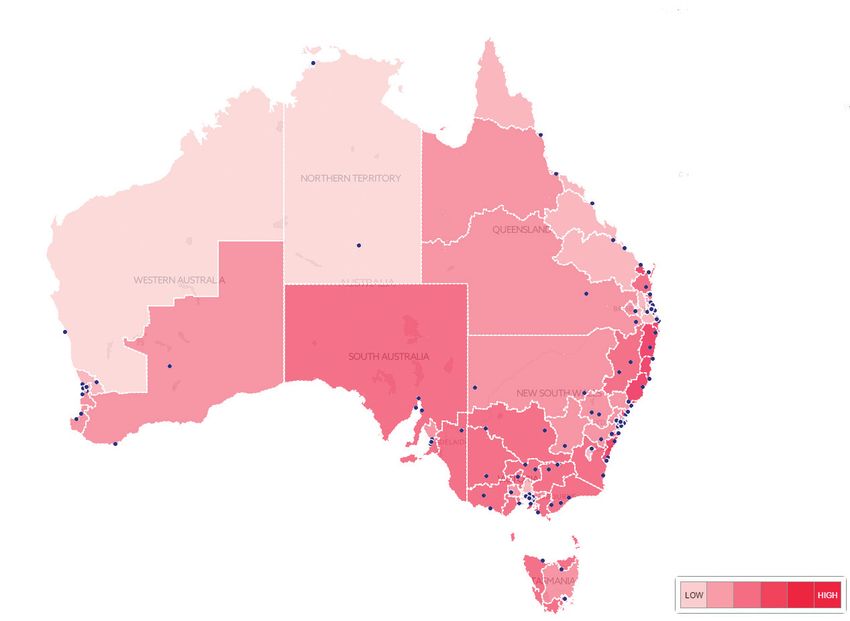
Treating stroke                                                Telemedicine
                                                               Historically, regional hospital emergency departments
                                                               have been unable to provide time critical therapies.
                                                               Patients with stroke need detailed assessment by a stroke
Stroke is a serious medical emergency requiring urgent         specialist to ensure a patient is suitable for treatment.
medical attention, but with the right treatment at the         Telemedicine delivers people living in rural and regional
right time, many people are able to recover from stroke.       areas the opportunity to quickly access stroke specialists
                                                               who can correctly diagnose stroke and support clinicians
‘Time is brain’ therapies                                      on the ground to administer time critical thrombolysis
                                                               treatment or arrange transfer to a comprehensive stroke
Some of the more recent advances in ischaemic stroke
                                                               centre for clot retrieval treatment.
(caused by a clot) treatment are particularly time critical,
and can only be provided within the first few hours of         Telemedicine services are now operating
stroke. The earlier treatment is delivered, the better the     in limited areas, but more investment
outcomes for patients.                                         is required to develop a nationally
›› Thrombolysis (clot dissolving treatment) must occur         coordinated stroke telemedicine network.
   within the first 4.5 hours of stroke symptoms occurring.
                                                               New treatments for stroke are evolving all the time.
   Thrombolysis involves administering a drug which
                                                               Current evidence-based stroke treatments proven to
   can break down and disperse a clot that is preventing
                                                               reduce death and disability include:
   blood from reaching the brain.
›› Endovascular clot retrieval (removal of a clot              ›› Stroke unit care – immediate clinical care within a
   by a retractable mechanical device) needs to be                specialised stroke unit significantly reduces death and
   administered within six hours of stroke symptoms               disability compared with care in general wards for
   occurring. Known as ECR, a large clot blocking a brain         all people with stroke.2 About 67 percent of patients
   vessel is removed via an artery (intra-arterial approach)      access stroke unit care in Australia.3
   and has shown to be highly effective, when combined         ›› Antiplatelet therapy – reduces blood clots by
   with thrombolysis treatment (or alone in patients              preventing platelets in the blood from sticking
   ineligible for thrombolysis).                                  together, reducing the risk of stroke due to blood
Ensuring every Australian household has                           clots. These drugs are given to 97 percent3 of
                                                                  ischaemic stroke patients but adherence declines after
someone who knows the signs of stroke
                                                                  discharge to 21 percent.4
and to call 000 is a key priority of the
Stroke Foundation. Think F.A.S.T. Act FAST.                    ›› Anticoagulant therapy – used for secondary
                                                                  prevention of stroke, particularly when atrial fibrillation
                                                                  (AF) is a factor. Only 62 percent of eligible patients
                                                                  receive anticoagulation after ischaemic stroke.3
                                                               ›› Blood pressure-lowering therapy – vital for
                                                                  preventing secondary stroke. About one in four of
                                                                  eligible stroke survivors are discharged from hospital
                                                                  without this medication.3,5
Has their FACE drooped?                                        ›› Cholesterol-lowering therapy – prevents clots from
Can they lift both ARMS?                                          getting to the brain and is an important medication for
Is their SPEECH slurred and do they understand you?               secondary stroke. These drugs are given to about 80
Call 000, TIME is critical.                                       percent of eligible stroke patients, but adherence after
                                                                  discharge declines to about 65 percent.4

                  “When I was a young neurologist in 1977, we decided to do a list of all the acute interventions
                  that were working to make people better and improve their outcomes once a stroke had
                  occurred. There was nothing, there was zero. We were unable to do anything. That was very
                  frustrating, but at the same time, an enormous opportunity to explore new possibilities. The
                  interventions today, in 2017, that are proven to significantly deliver better outcomes for people
                  with stroke are extensive and well beyond my initial expectations.”
                  - Geoff Donnan
                  Director of The Florey Institute of Neuroscience and Mental Health
                  and Professor of Neurology, University of Melbourne, Austin Hospital
The national picture of stroke in Australia
Total NSW VIC QLD WA SA TAS ACT NT
Aus
Population 24,720,750 7,960,702 6,162,195 4,972,061 2,567,906 1,837,561 569,412 410,360 240,553
Number of strokes in
55,831 18,922 14,239 10,334 5,084 4,868 1,453 713 218
2017
(number per 100k
(226) (238) (231) (208) (198) (265) (255) (174) (91)
people)
Number of stroke
475,160 159,169 119,895 90,255 44,693 39,946 12,384 6,371 2,447
survivors in 2017
(number per 100k
(1,922) (1,999) (1,946) (1,815) (1,740) (2,174) (2,175) (1,553) (1,017)
people)
Number of deaths
12,507 4,320 3,245 2,220 1,083 1,146 318 148 27
from stroke in 2017
(number per 100k
(51) (54) (53) (45) (42) (62) (56) (36) (11)
people)
Stroke incidence – 2017
Stroke unit location
5The over representation of
stroke in regional Australia
Regional Australians are 19 percent more likely to suffer Hospitals with specialist staff and stroke units are proven
a stroke than those in metropolitan areas. to deliver improved outcomes for survivors, but due to
the small numbers of patients treated for stroke, many
Communities living in regional areas are over
rural hospitals do not have stroke units or specialist
represented in stroke statistics, partly due to an ageing
treatment and care teams.
population.
Many stroke specialists, who play an essential role in
Statistics have shown the further people live from major
diagnosing and treating stroke, work predominantly in
Australian cities, the poorer their health and lower their
metropolitan areas.
life expectancy.6
These figures are disturbing, yet echo a widespread
issue of health inequality across Australia. Ensuring all Australians have access to
high quality stroke care, regardless of
where they live is a key priority of the
Stroke Foundation.
When stroke happens, time
is of the essence
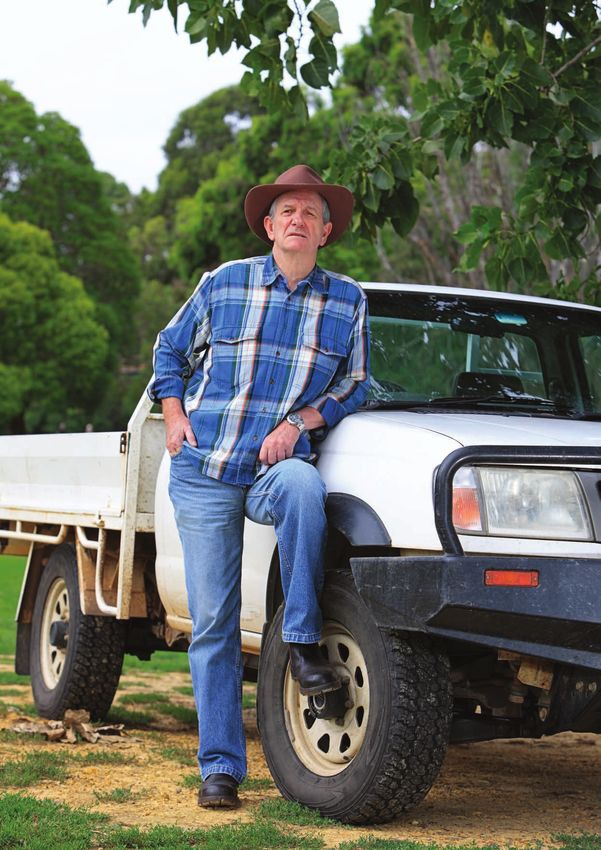
“My husband Stephen was 48 when he had a
stroke – I found him on the floor – eyes open,
unable to speak. I immediately suspected stroke
and dialled 000. The paramedics thought he was
too young to have a stroke and took him to the
local hospital, which doesn’t have a stroke unit.
“After stroke was confirmed, the Westpac Rescue
helicopter was organised to take Stephen to a large
regional hospital with specialised stroke services,
however by the time he arrived he had completely
missed the window for thrombolysis. In the days after the
stroke he suffered multiple life threatening complications,
spending four weeks in intensive care, six weeks on the
stroke ward and another six months in rehab.
“The one thing I always remember is the doctor in charge in
ICU saying it took us too long to get to the stroke unit.
I remember asking how rural patients were
supposed to get to hospital in time.”
- Tracy Ward
Carer, Denman NSW
6Stroke incidence, stroke survivors and deaths per 100,000 people
(metropolitan vs regional)
250 cases
Stroke incidence
p/100k 210 cases
Stroke survivors 2,132 cases
p/100k 1,787 cases
56 cases
Stroke deaths
p/100k 47 cases
0 500 1000 1500 2000
Regional Metropolitan
Stroke care is not equal
“Life saving treatments exist for stroke but the reality is that access to these
treatments and public awareness of stroke remains inadequate.
“Unfortunately access and awareness varies by postcode such that outside
of major cities the outcomes in stroke will be poorer, causing death or life
threatening disability. Not only are these patients and their families denied
the potential benefits of stroke treatment but when the outcomes are poor
they will not receive the skilled guidance, counselling and palliative care that
occurs in an acute stroke unit.
“These patients deserve the benefits of clinicians who understand the
need to advocate for patients unable to communicate their wishes; and
who empower patients’ relatives to make complex decisions regarding life
threatening disability as well as end-of-life care.”
- Dr Claire Muller
Neurologist
7National stroke
forecast
Stroke has been called a national health priority since policy response, there will be almost one million people
1996, but no nationally funded strategy to tackle it from living with the consequences of stroke in Australia by
the Federal Government has ever been produced. In 2050, more than double the number today.
today’s world our health system struggles to meet the The challenge looms large and this report points to
needs of stroke patients and survivors. More than 56,000 a critical need for investment in prevention measures
strokes will occur in Australia this year and two in three and investment to improve the quality and equity of
patients will not receive best practice care.6 stroke care in Australia. Without action to prevent, treat
Australia is facing the challenges of both a growing and and beat stroke there is no doubt the system will be
an ageing population. In the absence of a substantial overwhelmed.
Numbers of stroke survivors in Australia – trends over time
Cases
979,044
1,000,000
900,000 838,270
800,000
700,000 677,799
600,000
516,098
500,000 475,160
400,000
0
2017 2020 2030 2040 2050
Years
Predicted top 20 electorates for stroke survivors in 2050 Regional Metropolitan
Rank State Electorate Location Predicted number of
stroke survivors 2050
1 VIC Lalor Metropolitan 9,830
2 NSW Paterson Regional 9,633
3 VIC Flinders Regional 9,523
4 NSW Lyne Regional 9,226
5 NSW Richmond Regional 9,200
6 NSW Page Regional 9,112
7 NSW Cowper Regional 9,067
8 VIC McMillan Regional 8,752
9 QLD Hinkler Regional 8,718
10 SA Mayo Regional 8,388
11 NSW Gilmore Regional 8,377
12 VIC McEwen Regional 8,342
13 QLD Fairfax Regional 8,337
14 QLD Fisher Regional 8,334
15 NSW Eden-Monaro Regional 8,280
16 SA Wakefield Regional 8,133
17 NSW Dobell Regional 8,063
18 QLD Petrie Metropolitan 8,021
19 NSW Shortland Regional 7,981
20 NSW Farrer Regional 7,921
8Australia needs a national strategy to guide planning and a funded action plan to support
resource allocation for stroke services. This will address the issues of today and plan for the
challenges of the future.
Numbers of new strokes in Australia – trends over time
Cases
150,000
140,000
132,381
130,000
120,000 109,884
110,000
100,000
90,000 83,652
80,000
70,000
60,800
60,000 55,831
50,000
0
2017 2020 2030 2040 2050
Years
Predicted top 20 electorates for stroke incidence in 2050 Regional Metropolitan
Rank State Electorate Location Predicted number of
stroke incidence 2050
1 NSW Paterson Regional 1,343
2 NSW Lyne Regional 1,331
3 NSW Page Regional 1,296
4 VIC Flinders Regional 1,294
5 NSW Cowper Regional 1,291
6 NSW Richmond Regional 1,269
7 VIC McMillan Regional 1,207
8 NSW Gilmore Regional 1,182
9 QLD Hinkler Regional 1,176
10 SA Mayo Regional 1,175
11 QLD Petrie Metropolitan 1,165
12 QLD Fairfax Regional 1,150
13 VIC Lalor Metropolitan 1,149
14 QLD Fisher Regional 1,149
15 SA Boothby Metropolitan 1,143
16 NSW Eden-Monaro Regional 1,137
17 NSW Dobell Regional 1,131
18 NSW Whitlam Regional 1,126
19 VIC Corangamite Regional 1,112
20 SA Sturt Metropolitan 1,112
9Stroke hotspots
National and state data is helpful, but understanding Stroke survivors
stroke needs at a local level provides valuable insights Recovery can be long and difficult for people surviving
into where the need is greatest. This can assist with a stroke and their needs for health and social support
service planning and coordination. It also demonstrates change over time.
that no postcode across Australia is untouched by this
devastating disease.
Number of stroke survivors in Australia
today: 475,160
Proportion of top 20 stroke survivor
electorates found in regional areas:
75 percent
Top 20 stroke survivor electorates in 2017
NSW Lyne 4,481 (2,894 p/100k)
NSW Page 4,434 (2,599 p/100k)
NSW Cowper 4,327 (2,561 p/100k)
NSW Gilmore 4,269 (2,650 p/100k)
NSW Paterson 4,246 (2,611 p/100k)
SA Hindmarsh 4,229 (2,533 p/100k)
NSW Farrer 4,181 (2,417 p/100k)
NSW Richmond 4,136 (2,520 p/100k)
VIC Flinders 4,116 (2,559 p/100k)
SA Sturt 4,069 (2,447 p/100k)
SA Boothby 3,970 (2,468 p/100k)
NSW Robertson 3,917 (2,535 p/100k)
QLD Hinkler 3,908 (2,604 p/100k)
NSW Shortland 3,855 (2,457 p/100k)
NSW Bradfield 3,822 (2,247 p/100k)
NSW Whitlam 3,780 (2,354 p/100k)
NSW Dobell 3,770 (2,270 p/100k)
NSW New England 3,766 (2,273 p/100k) Regional
VIC McMillan 3,746 (2,193 p/100k)
Metropolitan
VIC Maribyrnong 3,738 (2,144 p/100k)
3,000 3,200 3,400 3,600 3,800 4,000 4,200 4,400 4,600
10Stroke incidence
“It’s not fair that our health system forces patients into this cruel lottery. Consistent lack
of stroke-specific funding and poor resourcing is costing us lives and money. For the most
part, doctors and nurses are doing what they can in a system that is fragmented, under-
resourced and overwhelmed.”
- Associate Professor Bruce Campbell
Chair of Stroke Foundation Clinical Council
Top 20 stroke incidence electorates in 2017
NSW Lyne 553 (357 p/100k)
SA Hindmarsh 551 (330 p/100k)
NSW Page 546 (320 p/100k)
NSW Cowper 522 (309 p/100k)
NSW Gilmore 514 (319 p/100k)
SA Sturt 514 (309 p/100k)
SA Boothby 511 (318 p/100k)
NSW Paterson 508 (312 p/100k)
NSW Richmond 505 (308 p/100k)
NSW Farrer 500 (289 p/100k)
VIC Flinders 497 (309 p/100k)
NSW Robertson 494 (320 p/100k)
NSW Bradfield 489 (288 p/100k)
NSW Dobell 471 (284 p/100k)
VIC Chisholm 467 (271 p/100k)
NSW Shortland 464 (296 p/100k)
QLD Hinkler 462 (308 p/100k)
NSW Mackellar 461 (284 p/100k) Regional
VIC Goldstein 458 (288 p/100k)
Metropolitan
VIC Maribyrnong 457 (262 p/100k)
300 350 400 450 500 550 600
11Every 9 minutes Every 4
minutes
2017 2050
The number of strokes will
MORE THAN DOUBLE by 2050
Determination
is vital for
stroke recovery
“The fatigue that was caused by the
stroke was absolutely debilitating. I was
so in and out of sleep I could barely talk
or even listen. My memory was so bad I’d
have to be told repeatedly why I couldn’t
move my body. I was given anti-depressants
and told my brain was no longer able to
maintain serotonin levels to keep me happy.
I think they helped a lot through rehab as it
was such a terrible time.
“The mental side of the stroke has been a lot
harder to recover from than the physical side.
When I moved from hospital to a rehab centre
I was given a strict timetable of physical
rehabilitation for my arms and legs. From then
on recovery became my life, doing relentless
exercises and if after hours of practicing I
could move my leg or hand I’d consider it
a productive day. To recover from a stroke
you need a huge amount of determination.
Fortunately I had a very committed wife and
family to support me and keep me going in the
right direction.”
- Alex Wright
Stroke survivor, Melbourne
12Stroke risk
factors by state
High blood pressure, atrial fibrillation (irregular
heartbeat), high cholesterol and physical inactivity are
all modifiable risk factors for stroke. Non-modifiable risk
factors include age, gender and family history of stroke.
The table below shows a significant proportion of the
Australian population is living at risk of stroke and other
chronic diseases. Many of these people live without
Supporting the Australian community
awareness of their risk and are therefore powerless to
take control. to identify and manage their health
A reduction in modifiable risk factors will help prevent risks must be addressed at multiple
stroke, reducing incidence and impact of the disease. levels and sustained over time.
The national picture of stroke risk
Total NSW VIC QLD WA SA TAS ACT NT
Aus
Population 24,720,750 7,960,702 6,162,195 4,972,061 2,567,906 1,837,561 569,412 410,360 240,553
High blood pressure 4,364,804 1,428,161 1,092,245 854,872 436,137 345,575 108,202 66,506 33,106
(% of population) (18) (17.9) (17.7) (17.2) (17) (18.8) (19) (16.2) (13.8)
Atrial fibrillation 475,367 159,949 119,943 89,818 44,200 40,461 12,622 6,182 2,193
(% of population) (2) (2) (2) (1.8) (1.7) (2.2) (2.2) (1.5) (0.9)
High cholesterol 6,426,245 2,077,848 1,605,710 1,277,138 660,609 490,050 152,990 104,452 57,448
(% of population) (26) (26.1) (26.1) (25.7) (25.7) (26.7) (26.9) (25.5) (23.9)
Physical inactivity 11,206,644 3,622,180 2,815,252 2,218,929 1,149,751 854,336 262,290 184,232 99,674
(% of population) (45) (45.5) (45.7) (44.6) (44.8) (46.5) (46.1) (44.9) (41.5)
“The number of strokes would be practically cut in half
(44 percent) if high blood pressure was eliminated.”
- World Stroke OrganizationHigh blood pressure
Around 4.1 million Australians have high blood pressure.7 High blood pressure is a leading risk factor for stroke. The
World Health Organization and the National Heart Foundation of Australia guidelines define ‘high’ blood pressure as
systolic pressure at or above 140mmHg, diastolic pressure at or above 90mmHg or anyone receiving medication for
high blood pressure.
Major contributors to high blood pressure include poor diet (especially high salt intake), being overweight, excessive
alcohol consumption and insufficient physical activity.
Research8 suggests even a small blood pressure reduction (5 to 6 mmHg systolic, 2 to 3 mmHg diastolic) would result
in 40 percent fewer strokes. Lowering blood pressure has been conclusively shown to prevent both ischaemic and
haemorrhagic strokes, and it is equally important in secondary prevention.
Top 15 electorates for high blood pressure Regional Metropolitan
Rank State Electorate Number of people with % of population with
high blood pressure high blood pressure
1 NSW Lyne 33,783 21.8
2 NSW Gilmore 33,566 20.8
3 NSW Paterson 33,514 20.6
4 NSW Cowper 34,756 20.6
5 QLD Hinkler 30,858 20.6
6 NSW Page 35,051 20.5
7 NSW Richmond 33,633 20.5
8 VIC Flinders 32,849 20.4
9 QLD Wide Bay 30,475 20.4
10 SA Hindmarsh 33,578 20.1
11 NSW Robertson 31,055 20.1
12 NSW Eden-Monaro 31,626 20.0
13 SA Boothby 31,965 19.9
14 VIC Indi 27,695 19.9
15 NSW Shortland 31,170 19.9
Atrial fibrillation
More than 475,000 Australians across the country have an irregular heartbeat known as atrial fibrillation. Atrial
fibrillation (AF) is associated with one in four strokes.9
Like high blood pressure, many people are unaware they suffer from AF and how serious the condition is. As a
consequence, too few people are accessing life-saving treatments to control AF.
Top 15 electorates for atrial fibrillation Regional Metropolitan
Rank State Electorate Number of people with % of population with
atrial fibrillation atrial fibrillation
1 NSW Lyne 4,693 3.0
2 NSW Gilmore 4,452 2.8
3 QLD Hinkler 4,094 2.7
4 NSW Paterson 4,417 2.7
5 NSW Page 4,582 2.7
6 NSW Cowper 4,480 2.7
7 VIC Flinders 4,254 2.6
8 NSW Robertson 4,022 2.6
9 NSW Richmond 4,247 2.6
10 SA Hindmarsh 4,318 2.6
11 NSW Shortland 3,987 2.5
12 VIC Mallee 3,553 2.5
13 QLD Wide Bay 3,762 2.5
14 SA Boothby 4,039 2.5
15 SA Sturt 4,169 2.5
14High cholesterol
More than 6.4 million Australians live with high cholesterol. High cholesterol (hyperlipidemia/dyslipidemia)
contributes to blood vessel disease, which often leads to stroke. High-density lipoprotein (‘good’) cholesterol
helps reduce cardiovascular disease risk, while low-density lipoprotein (‘bad’) cholesterol can increase risk.
Cholesterol comes from two sources – the food we eat (of which only 50 percent of the cholesterol may be
absorbed) as well as that synthesised and metabolised in the body, mainly the liver, which is by far the greater
amount. High cholesterol levels have been associated with ischaemic stroke – those caused by clots. Statins (a
group of medicines that can help lower the level of bad cholesterol in the blood) are demonstrated to reduce the
risk of stroke by about 20 percent.
Top 15 electorates for high cholesterol Regional Metropolitan
Rank State Electorate Number of people with % of population with
high cholesterol high cholesterol
1 NSW Lyne 43,320 28.0
2 QLD Wide Bay 41,727 27.9
3 NSW Richmond 45,684 27.8
4 NSW Eden-Monaro 43,883 27.7
5 TAS Lyons 32,101 27.7
6 SA Mayo 42,581 27.6
7 NSW Cowper 46,593 27.6
8 NSW Gilmore 44,299 27.5
9 VIC Flinders 44,043 27.4
10 SA Hindmarsh 45,681 27.4
11 NSW Paterson 44,466 27.3
12 NSW Page 46,601 27.3
13 QLD Hinkler 40,952 27.3
14 VIC Menzies 39,598 27.3
15 VIC Indi 37,984 27.2
Physical inactivity
Over 11 million Australians, or about 45 percent of the population, are considered physically inactive. The National
Physical Activity Guidelines recommend Australians accumulate 2.5-5 hours of moderate physical activity or 1.25-2.5
hours of vigorous physical activity each week, and aim to be active on most, or preferably all days each week.
Insufficient physical activity may be linked to stroke, as well as to other risk factors such as being overweight and obese,
having diabetes, high blood pressure and high cholesterol.
Top 15 electorates for physical inactivity Regional Metropolitan
Rank State Electorate Number of people % of population who are
physically inactive physically inactive
1 NSW Sydney 98,451 49.0
2 SA Hindmarsh 81,496 48.8
3 VIC Melbourne Ports 85,730 48.3
4 NSW Lyne 74,350 48.0
5 NSW Wentworth 76,569 48.0
6 QLD Moncrieff 80,683 47.9
7 VIC Melbourne 103,477 47.9
8 SA Sturt 79,384 47.7
9 SA Boothby 76,721 47.7
10 VIC Higgins 78,176 47.4
11 SA Adelaide 86,081 47.4
12 VIC Menzies 68,827 47.4
13 WA Perth 76,186 47.4
14 NSW Gilmore 76,196 47.3
15 VIC Chisholm 81,378 47.2
15About
this report
Deloitte Access Economics was commissioned by the Fibrillation, which is derived from Deloitte Access
Stroke Foundation to undertake analyses of stroke Economic (2011).
statistics and provide estimates of the incidence, For the purpose of the report, Australian Electoral
prevalence and mortality of stroke in Australia. This report Commission geographic classifications of provincial and
follows the 2013 paper, the Economic impact of stroke in rural electorates have been combined under a regional
Australia, which estimated that stroke costs the Australian banner. Inner metropolitan and outer metropolitan
economy $5 billion per year, including $3 billion in lost electorate classifications have been combined under a
productivity. Estimates of the impact of stroke by Federal metropolitan banner. The Modified Monash Model is
electorate (2014) are also available. used by the Stroke Foundation to define metropolitan/
Incidence reflects new stroke cases in a given year, regional splits for hospitals as part of national stroke
whereas prevalence refers to the number of people living audits.
after a stroke (survivors) in a given year. Please don’t hesitate to contact Stroke Foundation
The rates (or proportions) for incidence, prevalence and Chief Executive Officer, Sharon McGowan
mortality used in Deloitte Acccess Economics (2013) have ceo@strokefoundation.org.au with any queries about
been used again in this report to ensure consistency. this report.
Incidence rates were taken from Thrift10 which was based
on the North East Melbourne Stroke Study (NEMESIS)11. References
Prevalence rates were taken from the fourth survey of 1
Nadine E. Andrew, Monique Kilkenny, Rebecca Naylor, Tara Purvis, Erin Lalor, Natasha
Moloczij, Dominique A. Cadilhac – Understanding long-term unmet needs in Australian
Disability Ageing and Carers conducted by the Australian survivors of stroke survivors (2014).
2
Stroke unit trialists’ Collaboration. Organised inpatient (stroke unit) care for stroke. Cochrane
Bureau of Statistics (ABS). The survey provides detailed Database of Syst Rev 2007.
information on the self-reported prevalence of stroke by Stroke Foundation Acute Services Audit 2015
3
4
Reid et al 2008
age and gender. 5
Stroke Foundation Rehabilition Services Audit 2016
6
http://myhealthycommunities.gov.au/our-reports/Life-expectancy-and-PAD/september-2016/
Mortality rates were derived from Begg12 and ABS view-the-data
7
AIHW, Australia’s Health
(2012a), whereby for each age-gender cohort, the 8
Law M, Morris J and Wald N (2009) – Use of blood pressure-lowering drugs in the
prevention of cardiovascular disease: meta-analysis of 147 randomised trials in the context of
percentage of the population who had stroke and expectations from prospective epidemiological studies BMJ 338:b1665.
died from it was compared to the percentage of the 9
Stroke Foundation, Price Waterhouse Coopers, The economic costs of Atrial Fibrillation in
Australia, June 2011
population who did not have stroke but died from other 10
Thrift A, Tong B, Senes S, Waters A-M, Lalor E 2012, “No Evidence for an Epidemic of Stroke
with the Ageing of the population” Neuroepidemiology 2012;38:268–273.
causes. The difference between the two percentages is 11
As mentioned in Deloitte Access Economics (2014), NEMESIS defined stroke according to
the relative risk of death from stroke. the World Health Organization definition as ‘rapidly developoing clinical signs of focal (or
global) disturbance of cerebral function lasting more than 24 hours (unless interrupted by
surgery or death) with no apparent cause other than of vascular origin. Therefore transient
Risk factors for stroke data is obtained from the Australian ischaemic attacks less than 24 hours and silent strokes are not measure in this report’.
12
Begg S, Vos T, Barker B, Stevenson C, Stanley L & Lopez A 2007, The burden of disease and
Health Survey, 2011-12 (ABS, 2013), except for Atrial injury in Australia 2003. PHE 82. Canberra: AIHW.
The No postcode untouched: Stroke
in Australia 2017 report was funded
by an unrestricted educational grant
from Boehringer Ingelheim
How to get more involved Contact us
Give time – become a volunteer. 1300 194 196
Raise funds – hold a community fundraising event. strokefoundation.org.au
Speak up – join our advocacy team. /strokefoundation
NSF1586 June 2017
Leave a lasting legacy – with a gift in your Will. @strokefdn
Know your numbers – check your health regularly. @strokefdn
Stay informed – keep up-to-date and share our
message.
16You can also read