Relationship Between Accessibility to Polling Places and Electoral Abstention
←
→
Page content transcription
If your browser does not render page correctly, please read the page content below
Modern Applied Science; Vol. 12, No. 9; 2018
                                                                              ISSN 1913-1844      E-ISSN 1913-1852
                                                               Published by Canadian Center of Science and Education

    Relationship Between Accessibility to Polling Places and Electoral
                             Abstention
                             Diego Escobar1, Santiago Cardona1 & Carlos Moncada2
1
  Universidad Nacional de Colombia, Sede Manizales. Facultad de Ingeniería y Arquitectura, Departamento de
Ingeniería Civil, Carrera 27 # 64-60, Manizales, 170004, Colombia
2
 Universidad Nacional de Colombia, Sede Bogotá. Facultad de Ingeniería, Departamento de Ingeniería Civil y
Agrícola, Ciudad Universitaria edificio 417 oficina 417, Bogotá, 111321, Colombia
Correspondence: Diego Escobar, Universidad Nacional de Colombia, Sede Manizales. Facultad de Ingeniería y
Arquitectura, Departamento de Ingeniería Civil, Carrera 27 # 64-60, Manizales, 170004, Colombia. E-mail:
daescobarga@unal.edu.co

Received: June 6, 2018             Accepted: June 24, 2018         Online Published: August 8, 2018
doi:10.5539/mas.v12n9p7                 URL: https://doi.org/10.5539/mas.v12n9p7

Abstract
One of the great factors to define the consolidation of democracy in the countries is to measure the percentage of
electoral participation. For this reason, reducing abstention in electoral processes by increasing participation is
one of the great challenges for the different countries that seek to move to full democracy. In this sense,
Colombia has had a historical abstention of over 50% (period 1978 - 2018), which can be explained by various
reasons such as the presence of the armed conflict or the remote location of some polling places. For this reason,
this research seeks to analyze the location of the polling places in the urban area of Manizales and Villamaría, in
order to quantify their accessibility through the pedestrian network and look at the population coverage, using
the integral accessibility and the ordinary Kriging method as a predictive statistical geo method for the
construction of the isochronous travel time curves.
Keywords: integral accessibility, walk, polling places, electoral abstention
1. Introduction
Democracy is a system of government where citizens choose those rulers who represent them in the conduction
of the country. It is seen as a form of free and universal participation as well as a method of participation that
creates a framework of equality among the inhabitants, always framing the same rules of the game for everyone
(Levine & Molina, 2007), where there is a clear difference between political participation and electoral
participation, both expressions of democracy (Nohlen, 2004). The first one is understood as different citizen
actions of participation in events focused on democracy as political manifestations, collection of signatures,
among others (Nohlen, 2004). While the electoral participation, which although derived from the latter, is much
more important because it shows the opinion of the majority of the population in an egalitarian way through the
vote (Nohlen, 2004). The phenomenon of abstentionism is understood according to Nohlen, Zovatto, Orozco and
Thompson (2007) "... as the non-participation in the act of voting among those who are entitled to it...",
generating an indicator showing the percentage of people who did not participate in the electoral process
(Nohlen, Zovatto, Orozco, & Thompson, 2007). In addition, this has been used by various researchers to
measure the quality of democracy in countries (Levine & Molina, 2007) which, added to different variables,
show the consolidation and legitimacy of this system of government (Alcántara, 2008). In this sense, Colombia
is one of the Latin American countries that has had a higher percentage of abstention over time, standing at an
average of 53.38% for the presidential elections in the period 1978 - 2018 (See Figure 1), where In particular,
only two years are observed, where the percentage of participation is greater than that of abstention, 1998 and
2018. On the other hand, this indicator is much better in other countries of the world such as the United States
(43.3%), Panama (24.78). %), Chile (55.39%), Argentina (24.49%) or Peru (17.34%), which shows a much
higher percentage of participation, which can be explained by various reasons such as the absence of armed
conflict in the other countries and that explains the high participation in the elections of 2018, the first in
Colombia after the signing of the peace treaty with the FARC, the obligatory nature of the vote in countries like
Chile, a subjectively more consolidated democracy as in the United States, Between other reasons (Center for

                                                         7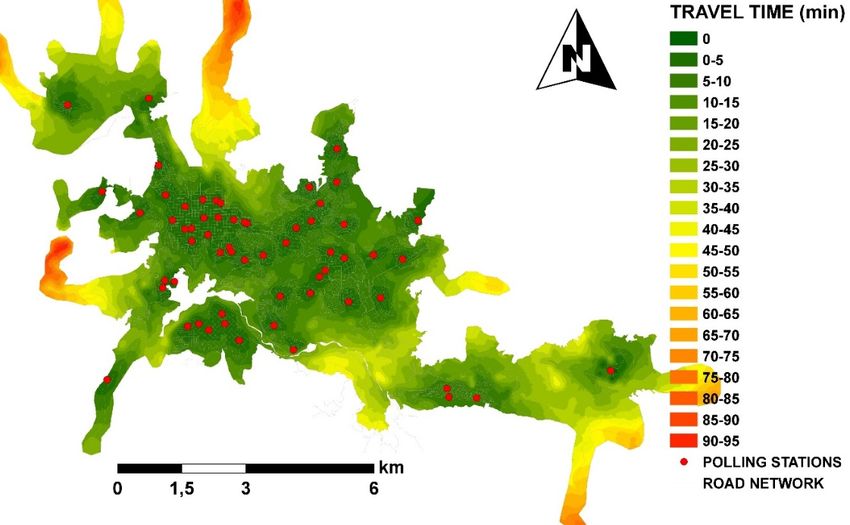
mas.ccsenet.org                                Modern Applied Science                             Vol. 12, No. 9; 2018

Studies in Democracy and Electoral Affairs, 2013). Among the reasons that explain abstentionism in Colombia
and the world, there are social, economic, climatological, geographical and even educational variables, although
this phenomenon cannot be studied universally but particularly to each territory (Center for Studies in
Democracy and Electoral Affairs, 2013; Lehoucq & Wall, 2004; Maldonado, 2011; Nohlen et al., 2007). One of
the most relevant factors in the high abstention is the geographical location of the polling places because they are
not close to the voter, that is why this research seeks to measure the accessibility that citizens have in the city of
Manizales and Villamaría to the different voting places arranged in its urban area through the measurement of
territorial accessibility along the pedestrian urban network.

  Figure 1. Historical percentage of participation and abstention for presidential elections in Colombia, 1978 -
 2018. Source: Own elaboration based on data obtained from the International Institute for Democracy (IDEA,
   2018) and Electoral Assistance, the National Registry of Colombian Civil Status (2018a) and the Electoral
                                       Observation Mission (MOE, 2014)

Accessibility is a concept used since the first decades of the last century to explain land-use planning, transport
planning, diversification of land uses, among other topics (Batty, 2009, Handy & Niemeier, 1997). However, it
was Hansen (1959) who dared to define it as the potential of opportunities for interaction that the inhabitant of a
territory possesses, through a study that used the road network and the jobs offered in Washington D.C. On the
other hand, Ingram (1971) defines this concept as an inherent characteristic of a place to overcome a source of
friction such as distance or time and is used as an explanation tool for the growth of cities, location of equipment
(educational, commercial, security, justice, recreational, etc.) and the combination of land uses. He also
introduced a division of concepts in the term. First, relative accessibility is a measure of connection between two
points through the road network, while integral accessibility is presented as a measure between multiple nodes
versus a few, for example, in a city it is possible to measure the integral accessibility of the citizens against the
offered hospital equipment (Escobar, Holguín, & Zuluaga, 2016). Later, Pirie (1979) listed the different types of
calculus present in the concept of accessibility developed over the years by researchers. On the other hand,
Handy and Niemeier (1997) indicate how the quality, quantity and nature of the opportunities offered determine
the measure as well as the cost of travel due to the fact that the less money and time are spent, the more
opportunities can be reached by the people, increasing accessibility in the territory. Then, Geurs and Ritsema Van
EcK (2001) raised a series of perspectives and components that make up and complement this important concept.
Finally, in recent years efforts have been concentrated on reinforcing the theories previously planted while
developing new approaches and applications for the term (Geurs, De Montis, & Reggiani, 2015; van Wee, 2016).
In this research article, integral accessibility will be used to analyze the accessibility of the inhabitants of
Manizales and Villamaría in relation with the polling places offered by the National Registry of the Colombian
Civil Status, studying its relationship with the high percentage of electoral abstention that is suffered in
democratic participation in Colombia. Manizales (see figure 2), capital of the department of Caldas, is located in
the center west of Colombia on the central mountain range at 2 150 meters above sea level on average, having a
steep territory that makes it difficult for urban settlements and the construction of infrastructure projects
(Robledo, 1996). On the other hand, according to the projections of the 2005 census made by the National
Administrative Department of Statistics (DANE), for 2017 it has a population of 371 307 in its urban area,

                                                          8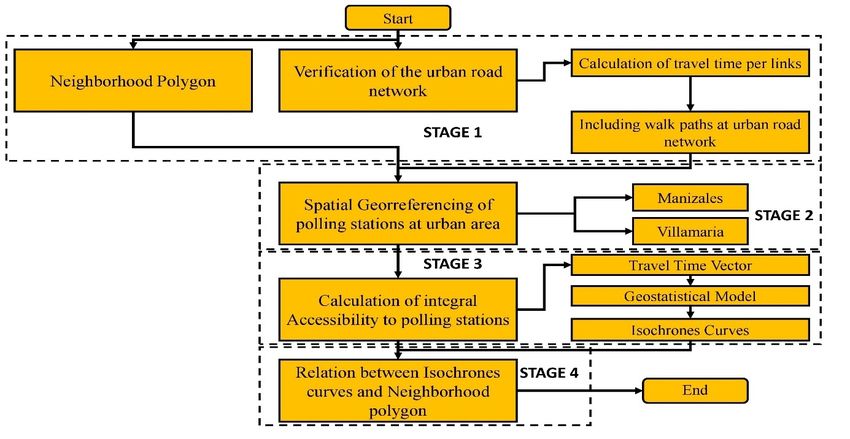
mas.ccsenet.org                              Modern Applied Science                             Vol. 12, No. 9; 2018

reaching 419 943 inhabitants next to the neighboring municipality of Villamaría (DANE, 2010). As for urban
mobility, 29% of its inhabitants use walking as the main mode of travel followed by public transport with 24%,
automobile with 14% and motorcycle with 11%. Also, the main reason for travel is related to work and study,
totaling an average of 2.34 trips per man and 1.85 trips per woman, evidencing an inequity in what refers to
gender (Alcaldía de Manizales, 2017). Accessibility measures have been used in Colombia and specifically in
Manizales as a planning and research method to solve various situations in urban planning and transportation
(Escobar, Duque, & Salas, 2015, Escobar & Garcia, 2011, Perilla, Escobar, & Cardona, 2018; Zuluaga &
Escobar, 2017), therefore in this research the use of these methods is enhanced to explain something as important
as the relation of the location of the polling stations with the electoral abstention.
After the introduction, the research methodology is presented to later make a discussion of the main results along
with the conclusions.

                  Figure 2. Geographic location of Manizales and Villamaria. Source. Authors

2. Methodology
The research methodology (Figure 3) has four (4) consecutive stages that are described below.
2.1 Stage 1
The first stage of the investigation consists of the development of the necessary information for the calculations
of integral accessibility. Firstly, the urban road network of the municipality of Manizales and Villamaría is
obtained together with the neighborhood polygon, both georeferenced in Geographic Information Systems (GIS)
software, a product of previous research carried out in the city (Escobar & Garcia, 2012; Perilla et al., 2018).
Likewise, the road network must be complemented with the pedestrian passages present in the city, such as
pedestrian bridges, stairs and other steps that connect the different neighborhoods with each other. This will
allow the calculation of minimum roads that are made in later stages to be closer to reality (Ortúzar & Willumsen,
1994). In addition, the travel time per arc must be calculated, which is a relation between the length of the arcs
obtained by means of the "Calculate Geometry" tool of ArcGis and the pedestrian speed, established at 4.32
km/h according to previous investigations made in the city related to pedestrians (Zuluaga, Escobar, & Younes,
2018), which may be affected, in some cases, by the slope of the terrain (Urban Development Institute, 2005).
On the other hand, the neighborhood polygon should be updated in its population, since the last registered
population is dated 2015, so it should be projected according to the indications of the DANE for the year 2017
(DANE, 2010), likewise, taking into account the electoral census for Manizales and Villamaría given by the
National Registry of Civil Status for the elections of 2018(Registraduria Nacional del Estado Civil for its name
in Spanish) (Registraduria Nacional del Estado Civil, 2018b).

                                                        9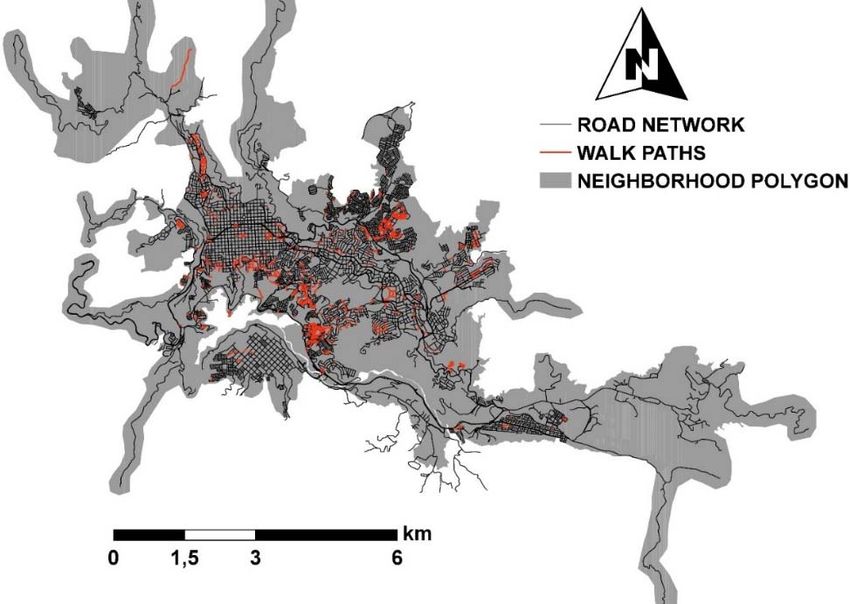
mas.ccsenet.org Modern Applied Science Vol. 12, No. 9; 2018
Figure 3. Research Methodology
2.2 Stage 2
On this stage, the analyzed voting places that are georeferenced in GIS software. For this, a search must be made
on the page of the National Registry of the Colombian Civil Status where it is possible to find the different
polling places present throughout the national territory in front of their names, address and electoral potential of
men and women (Registraduria Nacional del Estado Civil, 2018c).
2.3 Stage 3
To obtain the integral accessibility, the travel time vector must be calculated through the "multiple paths" tool of
the TRANSCAD software which calculates all the minimum paths between the given nodes, minimizing the
chosen variable through the Dijsktra algorithm, in our case travel time (Dijkstra, 1959; Wu et al., 2012). This
research seeks to calculate the minimum path of all nodes in the road network (10,312) to the nodes
corresponding to the polling places (60), resulting in a travel time matrix of 10 312 x 60 from which the
minimum time for each node is extracted, obtaining the vector of minimum travel time paths to the polling
places (Cardona, Zuluaga, & Escobar, 2017; Montoya & Escobar, 2017).
After obtaining the vector of travel times to the polling places, we use the ordinary Kriging geo-model with
semi-linear variogram as the structuring equation, present in the ArcGis software, to obtain the isochronous
curves of integral accessibility (Perilla et al., 2018). This geo-statistic model has been present as a predictor
model in different investigations related to transport networks (Lindner, Pitombo, Rocha, & Quintanilha, 2016;
Moncada, Cardona, & Escobar, 2018; Prasetiyowati, Imrona, Ummah, & Sibaroni, 2016).
2.3 Stage 4
On this last stage, it is sought to relate the isochrones curves of integral accessibility to the polling places with
the neighborhood polygon of the study area, from where an analysis can be carried out among the population
covered by the different curves, differentiating the neighborhoods and strata of the city that obtain a better
integral accessibility. The strata are a socio-economic differentiation that is used in Colombia to divide the
population groups on a scale from 1 to 6, where 1 represents the lowest stratum and 6 the highest stratum. This
division is based fundamentally on economic and social variables (Perilla et al., 2018).
3. Results and Discussion
3.1 Urban Road Network and Neighborhood Polygon
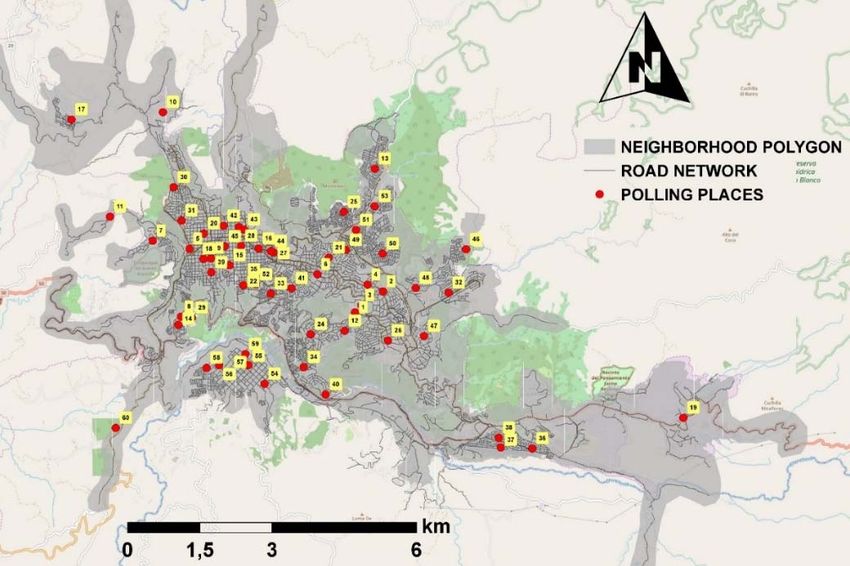
Figure 5 shows the 60 polling places located in the urban area of Manizales (54 polling places) and Villamaría (6
polling places). On the other hand, in table 1 there is a list with the names of the 60 polling places next to their
10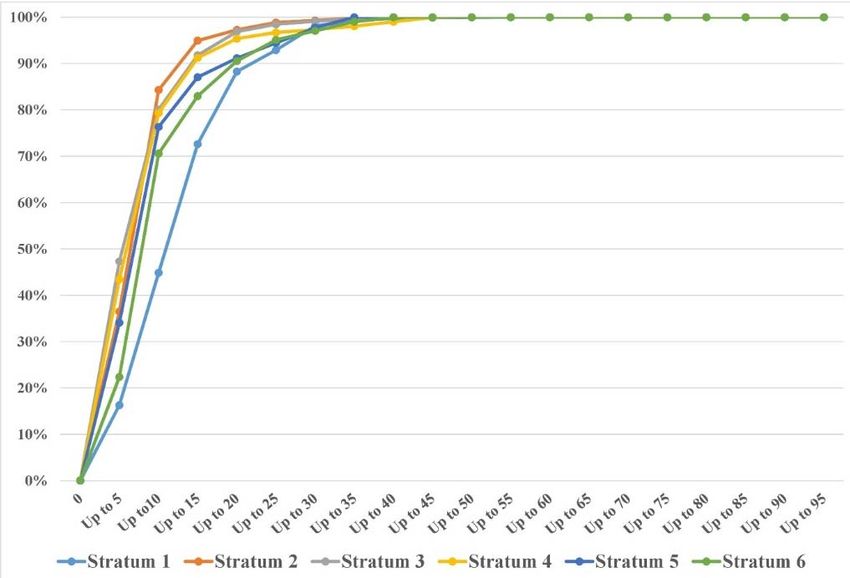
mas.ccsenet.org                               Modern Applied Science                             Vol. 12, No. 9; 2018

electoral potential, divided between men and women and their geographical coordinates (latitude and longitude)
in the WGS 1984 system. You can see that the voting station with the most voters is the University of Caldas (ID
1) with 17,928, followed by the Fe y Alegría educational institution (ID 25) with 11,740 voters and the Isabel la
catholic Educational Institution ( ID 16) with 11,586 voters. On the other hand, the posts that have fewer voters
are the National Men's Prison (ID 8) with 228 voters, the Women's Detention (ID 29) with 47 voters and “the
Escuela de Trabajo los Zagales” (ID 10) with 18 voters (See Table 1). The latter correspond to the detention
centers for male prisoners, women and minors who, according to a decree issued in 1994, can exercise their right
to vote while they are being held but not sentenced.minimum routes and the travel times between nodes which
causes that as the distances between nodes are greater, the difference between the scenarios are greater.

                               Figure 4. Road Network and Neighborhood Polygon

3.2 Polling Places
Figure 5 shows the 60 polling places located in the urban area of Manizales (54 polling places) and Villamaría (6
polling places). On the other hand, in table 1 there is a list with the names of the 60 polling places next to their
electoral potential, divided between men and women and their geographical coordinates (latitude and longitude)
in the WGS 1984 system. You can see that the voting station with the most voters is the University of Caldas (ID
1) with 17,928, followed by the Fe y Alegría educational institution (ID 25) with 11,740 voters and the Isabel la
catholic Educational Institution (ID 16) with 11,586 voters.
On the other hand, the posts that have fewer voters are the National Men's Prison (ID 8) with 228 voters, the
Women's Detention (ID 29) with 47 voters and “the Escuela de Trabajo los Zagales” (ID 10) with 18 voters (See
Table 1). The latter correspond to the detention centers for male prisoners, women and minors who, according to
a decree issued in 1994, can exercise their right to vote while they are being held but not sentenced.minimum
routes and the travel times between nodes which causes that as the distances between nodes are greater, the
difference between the scenarios are greater.

                                                        11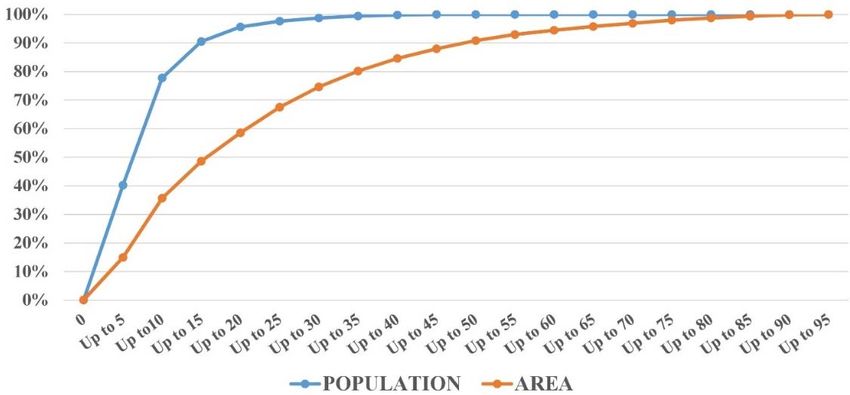
mas.ccsenet.org                             Modern Applied Science                           Vol. 12, No. 9; 2018

                               Figure 5. Geographic location of polling stations

 Table 1. Name, coordinates and voter base per polling station
Id Name                                                   Latitude     Longitude     Women      Men      Total
  1 Universidad de Caldas                                     5.056        -75.493    8 649     9 279     17 928
  2 Universidad Católica de Manizales                         5.060        -75.488    2 913     2 424      5 337
  3 I. E. Normal Superior de Manizales                        5.057        -75.492    2 209     2 193      4 402
  4 Facultad de Ciencias Jurídicas y Sociales                 5.061        -75.490    3 398     2 639      6 037
  5 Facultad de Bellas Artes (U. de Caldas)                   5.068        -75.524    2 126     3 879      6 005
  6 Facultad de Ciencias Para la Salud (U. de Caldas)         5.063        -75.500    4 099     3 350      7 449
  7 Colegio Filipense de Nuestra Señora de Lourdes            5.070        -75.531    1 674     1 449      3 123
  8 Cárcel Nacional de Varones                                5.055        -75.525       36       192        228
  9 Colegio Mayor de Nuestra Señora                           5.066        -75.520    4 291     5 507      9 798
10 Escuela de Trabajo La Linda (Los Zagales)                  5.094        -75.529        5        13         18
11 I. E. Adolfo Hoyos Ocampo                                  5.074        -75.539      996       949      1 945
12 I. E. Atanasio Girardot                                    5.053        -75.495    3 333     2 819      6 152
13 I. E. Bosques del Norte                                    5.083        -75.489    4 511     3 573      8 084
14 I. E. Estambul                                             5.054        -75.526    2 563     2 055      4 618
15 I. E. Gran Colombia                                        5.065        -75.516    3 295     2 706      6 001
16 I. E. Isabel La Católica                                   5.068        -75.511    6 221     5 365     11 586
17 I. E. La Linda                                             5.092        -75.546    2 723     2 657      5 380
18 I. E. León de Greiff                                       5.066        -75.521    3 603     3 619      7 222
19 I. E. Malteria                                             5.036        -75.431      644       662      1 306
20 I. E. Marco Fidel Suarez                                   5.071        -75.521    3 036     4 971      8 007
21 I. E. San Jorge                                            5.066        -75.498    5 139     4 029      9 168
22 I. E. Andrés Bello                                         5.061        -75.514    3 435     2 789      6 224
23 I. E. Divina Providencia                                   5.072        -75.515    1 621     1 334      2 955
24 I. E. Eugenio Pacelli (Sede Principal)                     5.052        -75.501    3 906     3 062      6 968

                                                      12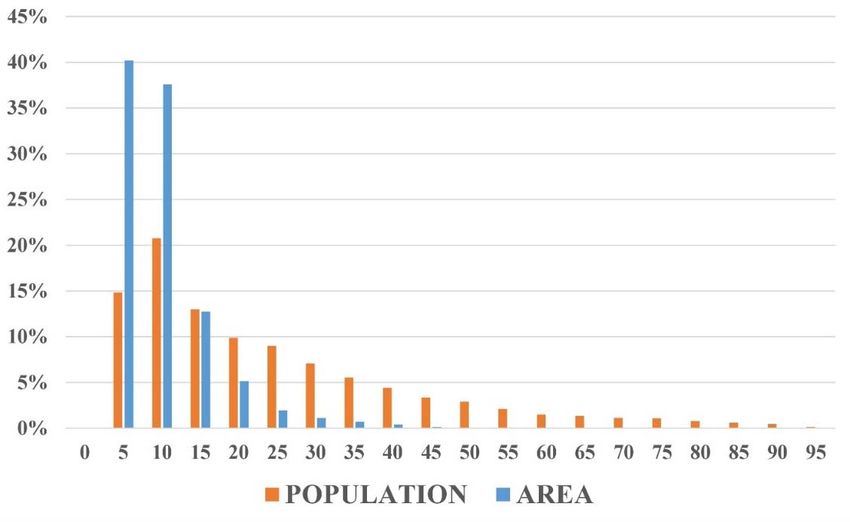
mas.ccsenet.org                                Modern Applied Science                         Vol. 12, No. 9; 2018

Id   Name                                                    Latitude    Longitude    Women      Men      Total
25   I. E. Fe y Alegría La Paz                                   5.075      -75.495    6 545     5 195     11 740
26   I. E. Escuela Nacional de Enfermería                        5.051      -75.487    4 419     3 366      7 785
27   I. E. Técnico Fransico José de Caldas                       5.067      -75.508    4 287       942      5 229
28   Liceo Arquidiocesano de Nuestra Señora                      5.069      -75.514    1 876     3 429      5 305
29   Reclusión de Mujeres Villa Jo.                              5.055      -75.523       45         2         47
30   I. E. Instituto Chipre                                      5.080      -75.527    2 333     1 993      4 326
31   I. E. Chipre Sede B                                         5.073      -75.525    4 968     3 532      8 500
32   I. E. La Sultana Sede A                                     5.060      -75.475    3 971     2 960      6 931
33   I. E. Leonardo Davinci                                      5.060      -75.509    5 165     3 888      9 053
34   I. E. Malabar Sede A                                        5.046      -75.502    4 228     3 272      7 500
35   I. E. Perpetuo Socorro                                      5.062      -75.512    1 639     1 164      2 803
36   I. E. San Pio X                                             5.031      -75.460    4 133     3 771      7 904
37   I. E. San Pio X Sede B                                      5.031      -75.465    2 259     1 879      4 138
38   I. E. San Pio X Sede A                                      5.033      -75.466    2 192     1 674      3 866
39   I. E. Siete de Agosto                                       5.064      -75.520    5 479     4 057      9 536
40   I. E. Aranjuez Sede A                                       5.041      -75.498    2 360     2 005      4 365
41   I. E. Latinoamericano Sede B                                5.061      -75.505    2 095     1 614      3 709
42   I. E. San Agustín                                           5.072      -75.517    1 541     3 164      4 705
43   I. E. Instituto Manizales                                   5.072      -75.514    5 666     3 365      9 031
44   I. E. Instituto Universitario de Caldas                     5.068      -75.509    3 072     2 717      5 789
45   Ed. Industria Licorera de Caldas                            5.069      -75.517    4 208     2 822      7 030
46   I. E. Mariscal Sucre Sede B                                 5.068      -75.472    1 769     1 414      3 183
47   I. E. Mariscal Sucre Sede A                                 5.052      -75.480    2 806     2 143      4 949
48   I. E. Mariscal Sucre Sede D                                 5.061      -75.481    2 401     2 033      4 434
49   I. E. La Asunción Sede A                                    5.068      -75.494    2 783     2 217      5 000
50   I. E. La Asunción Sede C                                    5.067      -75.488    3 417     2 722      6 139
51   I. E. Sinaí Sede B                                          5.072      -75.493    4 297     3 287      7 584
52   I. E. Leonardo Davinci Sede A                               5.061      -75.511    1 123       863      1 986
53   I. E. Liceo Mixto Sinai Sede A                              5.076      -75.489    3 328     2 580      5 908
54   Colegio Villa del Rosario                                   5.043      -75.510    2 956     2 230      5 186
55   I.E. San pedro Claver                                       5.046      -75.513    3 806     3 528      7 334
56   Escuela Jhon F. Kennedy                                     5.046      -75.518    1 606     2 154      3 760
57   I. E. Gerardo Arias Ramírez                                 5.045      -75.516    4 499     3 615      8 114
58   Escuela Rafael Pombo                                        5.046      -75.521    1 644       681      2 325
59   Instituto Villamaria                                        5.048      -75.513    3 573     3 313      6 886
60   Agroturistico El Tablazo                                    5.034      -75.538    2 169     2 131      4 300

3.3 Integral Accessibility to Polling Places
Figure 6 shows the isochrones curves of integral accessibility that the inhabitants of Manizales and Villamaría
have to the voting places offered through the pedestrian road network. There can be found travel times from the
0 to 5 minute intervals, which correspond to nodes that are very close to the voting places, few meters so the
walking time is minimal. On the other hand, there are travel times of more than 60 minutes and that reach 100
minutes, which represent distances to the polling places above 4 km and which reaches a maximum of 6.8 km.
However, the latter case is only found in urban areas where few inhabitants live according to the density
distribution of the neighborhood polygon.

                                                        13
mas.ccsenet.org Modern Applied Science Vol. 12, No. 9; 2018
Figure 6. Accessibility to Polling Places
Thus, Figure 7 shows the frequency histogram between the percentage of population and area against the
coverage of the isochronous accessibility curves. There can be observed how the interval of 0 to 5 minutes
covers 40% of the electoral census (129 525 people) and the interval of 5 to 10 minutes covers 38% of the
electoral census (121 095 people) which indicates that great percentage of the population, 78% according to the
accumulated coverage ogive (figure 8) is covered by travel times by walking to the polling places of 10 minutes
or less. Likewise, 96% of the electoral census (308 413 people) that is covered for less than 20 minutes shows
good accessibility by walking to the polling places showing an excellent offer of this type of equipment.
The interesting thing is in the percentage of the population that has more than 20 minutes (4% equivalent to 14
010 people) since these are times for which the walk is not the first option of transportation to polling places, so
that could be a cause for electoral abstention. Although abstentionism in Manizales for the last presidential
election of June 17, 2018 reached 39.5% and for Villamaría 39.86%, lower percentages were presented in the
national average of 47% (Registraduria Nacional del Estado Civil, 2018a). Therefore, in the urban area there is
no direct relationship between the high percentage of abstentionism and the poor coverage accessibility, since as
shown above there is a high percentage of the electoral census (96%) covered by walking times of less than 20
minutes while the participation reached 60%.
Regarding the analysis of population coverage according to socioeconomic strata, it is found that stratum 1, the
other low economic resources, has the lowest population coverage for travel times of less than 10 minutes,
reaching 45% coverage. While for the other strata this percentage is higher than 70%, reaching 84% coverage for
the neighborhoods belonging to stratum 2. Likewise, stratum 1 reaches 88% coverage for times less than 20
minutes, a percentage that for the total urban area is 96% and for the other strata, it is over 90%. So it can be said
that there is an inequity in the supply of equipment for the stratum 1 neighborhoods (See Figure 9).
14mas.ccsenet.org Modern Applied Science Vol. 12, No. 9; 2018
Figure 7. Histogram of coverage of area and population
Figure 8. Relation between percentage of covered population and area and isochrones
4. Conclusions
Colombia has an imperfect democracy, according to the "Democracy Index 2017" made by The Economist
Intelligence Unit, which measures the quality of democracy in 167 countries around the world through surveys
conducted on the population and analyzed by international experts on the subject of democracy. In this sense,
Colombia reaches an overall score of 6.67, between 1 and 10, where 10 indicates a full democracy, where the
worst indicator suggests political participation among what represents the high percentage of historical
abstentionism that has been presented, which is why advancing in this aspect is fundamental to improve the
quality of Colombian democracy.
Abstentionism happens due to several reasons among which we can find the deficiency in the offer of polling
places so the calculation of the integral accessibility to the polling places through by walking can envision a
picture of the coverage that polling places have in the cities of the country so measures can be taken of where to
locate new polling places or transport infrastructure that should be improved to increase coverage and thus
reduce voter abstentionism.
15mas.ccsenet.org Modern Applied Science Vol. 12, No. 9; 2018
Figure 9. Relation between percentage of covered population, isochrones curves and socio economic strata
Manizales and Villamaría have a participation percentage higher than the national average although the
percentage of participation for the last election (over 60%) does not come close to the great percentage of
coverage they have in terms of the polling places since they reach a coverage of 96% of the electoral census for
less than 20 minutes by walking, which indicates good accessibility and a good offer of electoral equipment. It is
important that for the next elections the percentage of coverage of the polling places reaches 100% for travel
times of less than 20 minutes, so that the distance of the polling places is not a reason for electoral abstentionism.
According to the strata analysis, the coverage of the neighborhoods belonging to stratum 1 should be improved
in order to increase the general accessibility to the voting places. Locating new polling places in these
neighborhoods will make the general coverage grow, benefiting a larger percentage of the population and
decreasing voter abstentionism.
Acknowledgments
The researchers would like to thank the students of the research group on sustainable urban mobility at the
Universidad Nacional de Colombia – Sede Manizales, particularly at Sergio Idarraga Gonzáles Civil Engineer
degree student, for their collaboration in the georeferencing of the polling places.
References
Alcaldía de Manizales. (2017). Plan Maestro de Movilidad de Manizales: Línea base y diagnóstico de la
situación actual de la movilidad de Manizales. Manizales.
Alcántara, M. (2008). Luces y sombras de la calidad de la democracia en América Latina. Quórum. Revista de
Pensamiento Iberoamericano, (22), 169–181.
Batty, M. (2009). Accessibility: In search of a unified theory. Environment and Planning B: Planning and Design,
36(2), 191–194. http://doi.org/10.1068/b3602ed
Cardona, M., Zuluaga, J. D., & Escobar, D. A. (2017). Análisis de la red de ciclo-rutas de Manizales (Colombia)
a partir de criterios de accesibilidad territorial urbana y cobertura de estratos socioeconómicos. Revista
Espacios, 38(28).
Center for Studies in Democracy and Electoral Affairs-Centro de Estudios en Democracia y Asuntos Electorales.
(2013). Abstencionismo electoral en Colombia : una aproximación a sus causas. Registraduriía Nacional
del Estado Civil. Bogota.
Departamento Administrativo Nacional de Estadística – DANE (2010). Proyecciones de población total por sexo
y grupos de edad de 0 hasta 80 y más años (2005 – 2020). Retrieved from
http://www.dane.gov.co/index.php/estadisticas-por-tema/demografia-y-poblacion/proyecciones-de-poblacio
16mas.ccsenet.org Modern Applied Science Vol. 12, No. 9; 2018
n
Dijkstra, E. W. (1959). A note on two problems in connexion with graphs. Numerical Mathematics, 1(1),
269–271. https://doi.org/10.1007/BF01386390
Electoral Observation Mission - Misión de Observación Electoral. (2014). Resultados Elecciones Presidenciales
Primera Y Segunda Vuelta 2014.
Escobar, D. A., Duque, J. P., & Salas, A. (2015). Accesibilidad como herramienta de planeación urbana. Caso de
estudio : Redireccionamiento vial en Riosucio (Caldas - Colombia). Avances Investigación En Ingeniería,
11(2), 9–18.
Escobar, D. A., & Garcia, F. (2011). Impacto de un sistema de transporte tipo Cable sobre la movilidad urbana.
Caso Manizales (Colombia). Avances Investigación En Ingeniería, 8(1), 92–98. Retrieved from
http://www.unilibre.edu.co/revistaavances/avances-8-1/r8-1_art11.pdf
Escobar, D. A., & Garcia, F. (2012). Diagnóstico de la Movilidad Urbana de Manizales (Primera ed). Manizales.
Escobar, D. A., Holguín, J. M., & Zuluaga, J. D. (2016). Accesibilidad de los centros de ambulancias y hospitales
prestadores del servicio de urgencias y su relación con la inequidad espacial. Caso de estudio Manizales –
Colombia. Revista Espacios, 37(20), 20.
Geurs, K. T., De Montis, A., & Reggiani, A. (2015). Recent advances and applications in accessibility modelling.
Computers, Environment and Urban Systems, 49, 82–85.
http://doi.org/10.1016/j.compenvurbsys.2014.09.003
Geurs, K. T., & Ritsema van Eck, J. (2001). Accessibility measures: review and applications. Evaluation of
accessibility impacts of land-use transportation scenarios, and related social and economic impact. RIVM
Report, 787, 1–265. Retrieved from https://rivm.openrepository.com/rivm/handle/10029/9487
Handy, S. L., & Niemeier, D. A. (1997). Measuring Accessibility: An Exploration of Issues and Alternatives.
Environment and Planning A, 29(7), 1175–1194. http://doi.org/10.1068/a291175
Hansen, W. G. (1959). How Accessibility Shapes Land Use. Journal of the American Institute of Planners, 25(2),
73–76. http://doi.org/10.1080/01944365908978307
Ingram, D. R. (1971). The Concept of Accessibility: A search for an operational form. Regional Studies, 5(2),
101–107. http://doi.org/http://dx.doi.org/10.1080/09595237100185131
International Institute for Democracy - Instituto Internacional para la Democracia-IDEA (2018). Population |
International IDEA. [Online] Available at:
https://www.idea.int/data-tools/question-countries-view/447/82/ctr [Accessed 1 Jun. 2018].
Lehoucq, F., & Wall, D. L. (2004). Explaining voter turnout rates in new democracies: Guatemala. Electoral
Studies, 23(3), 485–500. http://doi.org/10.1016/S0261-3794(03)00055-6
Levine, D. H., & Molina, J. E. (2007). La Calidad de la Democracia en América Latina: Una Visión Comparada.
America Latina Hoy, (45), 17–46. Retrieved from
http://www.redalyc.org/articulo.oa?id=30804502%0ACómo
Lindner, A., Pitombo, C. S., Rocha, S. S., & Quintanilha, J. A. (2016). Estimation of transit trip production using
Factorial Kriging with External Drift: an aggregated data case study. Geo-Spatial Information Science,
19(4), 245–254. http://doi.org/10.1080/10095020.2016.1260811
Maldonado, A. (2011). Compulsory voting and the decision to vote. Americas Barometer Insights, (63), 1–9.
Montoya, J., & Escobar, D. (2017). Propuesta de ubicación de nuevos centros comerciales, aplicación de un
análisis de accesibilidad territorial urbana. Revista Espacios, 38(51).
Moncada, C. A., Cardona, S., & Escobar, D. A. (2018). Saving Travel Time as an Urban Planning Instrument.
Case Study: Manizales, Colombia. Modern Applied Science, 12(6), 44–57.
http://doi.org/10.5539/mas.v12n6p44
Nohlen, D. (2004). La participación electoral como objeto de estudio. Elecciones, 3, 137–157. Retrieved from
http://www.web.onpe.gob.pe/modEscaparate/caratulas/nohlen2.pdf
Nohlen, D., Zovatto, D., Orozco, J., & Thompson, J. (2007). Tratado de derecho electoral comparado de
américa latina.
Ortúzar, J. de D., & Willumsen, L. G. (1994). Modelling Transport (4th Ed). John Wiley & Sons, Ltd.
17mas.ccsenet.org Modern Applied Science Vol. 12, No. 9; 2018
http://doi.org/10.1002/9781119993308
Perilla, D. J., Escobar, D. A., & Cardona, S. (2018). New Transportation Infrastructure Impact in Terms of
Global Average Access - Intersection "La Carola" Manizales (Colombia) Case Study. Contemporary
Engineering Sciences, 11(5), 215–227. http://doi.org/https://doi.org/10.12988/ces.2018.812
Pirie, G. H. (1979). Measuring Accessibility: A Review and Proposal. Environment and Planning A, 11(3),
299–312. http://doi.org/10.1068/a110299
Prasetiyowati, S. suryani, Imrona, M., Ummah, I., & Sibaroni, Y. (2016). Prediction of Public Transportation
Occupation Based on Several Crowd Spots Using Ordinary Kriging Method. Journal of Innovative
Technology and Education, 3(1), 93–104. http://doi.org/http://dx.doi.org/10.12988/jite.2016.6723
Registraduría Nacional del Estado Civil (2018a). Historico de Resultados. [Online] Registraduria Nacional del
Estado Civil. Retrieved May 30, 2018, from
https://wsr.registraduria.gov.co/-Historico-de-Resultados,3635-.html
Registraduría Nacional del Estado Civil (2018b). 782.862 COLOMBIANOS ESTÁN HABILITADOS EN
CALDAS PARA VOTAR EN LA ELECCIÓN DE PRESIDENTE Y VICEPRESIDENTE DE 2018. [Online]
Registraduria Nacional del Estado Civil. Retrieved May 30, 2018, from
https://wsr.registraduria.gov.co/782-862-colombianos-estan.html
Registraduría Nacional del Estado Civil (2018c). EN CALDAS HAY 246 PUESTOS INSTALADOS PARA QUE
LOS CIUDADANOS INSCRIBAN SU CÉDULA DE CIUDADANÍA HASTA ESTE DOMINGO 22 DE
MAYO. [Online] Registraduria Nacional del Estado Civil. Retrieved May 30, 2018, from
https://wsr.registraduria.gov.co/782-862-colombianos-estan.html
Robledo, J. E. (1996). La Ciudad de la Colonización Antioqueña. (Universidad Nacional de Colombia, Ed.)
(Primera Ed). Manizales.
Urban Development Institute - Instituto de Desarrollo Urbano. (2005). Guia práctica de la movilidad peatonal
urbana. Retrieved from http://www.pactodeproductividad.com/pdf/guiageneralsobreaccesibilidad.pdf
The Economist Intellingence Unit. (2017). Democracy Index 2017 Free speech under attack. The Economist.
Retrieved from http://pages.eiu.com/rs/753-RIQ-438/images/Democracy_Index_2017.pdf
van Wee, B. (2016). Accessible accessibility research challenges. Journal of Transport Geography, 51, 9–16.
http://doi.org/10.1016/j.jtrangeo.2015.10.018
Wu, L., Xiao, X., Deng, D., Cong, G., Zhu, A. D., & Zhou, S. (2012). Shortest path and distance queries on road
networks: An experimental evaluation. Proceedings of the VLDB Endowment, 5(5), 406-417.
http://doi.org/10.14778/2140436.2140438
Zuluaga, J. D., & Escobar, D. A. (2017). Geomarketing Analysis for Shopping Malls in Manizales (Colombia).
Accessibility approach methodology. Revista Espacios, 38(21), 20.
Zuluaga, J. D., Escobar, D. A., & Younes, C. (2018). A GIS approach based on user location to evaluate a
bike-sharing program. DYNA (Colombia), 85(204), 257–263. http://doi.org/10.15446/dyna.v85n204.67670
Copyrights
Copyright for this article is retained by the author(s), with first publication rights granted to the journal.
This is an open-access article distributed under the terms and conditions of the Creative Commons Attribution
license (http://creativecommons.org/licenses/by/4.0/).
18You can also read