A Briggs-Rauscher Reaction-based Spectrometric Assay to Determine Antioxidant Content in Complex Matrices in Low Technology Environments
←
→
Page content transcription
If your browser does not render page correctly, please read the page content below
74
      CHIMIA 2021, 75, No. 1/2                                                                                                  Future of Chemical Education
                            doi:10.2533/chimia.2021.74                                                     Chimia 75 (2021) 74–79 © A. Singhal, P. Grögli, B. Geiser, A. Handl

                            A Briggs-Rauscher Reaction-based
                            Spectrometric Assay to Determine
                            Antioxidant Content in Complex Matrices
                            in Low Technology Environments
                            Ankit Singhal*a, Philipp Gröglib, Bernd Geiserb, and Alina Handlb

                            Abstract: The Briggs-Rauscher (BR) reaction is free radical based where the kinetics of formation of different
                            iodide species leads to potentiometric and color oscillations. These oscillations were monitored in this study
                            using a UV/Vis attenuated total reflection probe to develop an assay to measure the antioxidant content in com-
                            plex matrices. The periodicity of the BR reaction was found to be very consistent (range 24–25 seconds, n = 16).
                            Adding various amounts of ascorbic acid, a well-known antioxidant, led to an inhibition of the reaction with a
                            linear calibration curve of antioxidant periodicity time (APT, r2 > 0.99). The validity of this test in complex matrices
                            was studied by determining the APT of nine fruits, and the resulting antioxidant capacity in ascorbic acid equiva-
                            lency was calculated. The results generated by this assay were found be accurate through comparison with the
                            well-established FRAP assay. These results show that visual or spectrometric monitoring of BR reaction can be
                            used as a reliable, quick, and inexpensive alternative to more established assays with the added advantage that
                            values generated from this assay is at pH 2 which is similar to that in the human stomach.
                            Keywords: Antioxidant · Ascorbic acid · Briggs-Rauscher · Spectrometric assay

                            Ankit Singhal is currently a gymnasium                  divided in two broad categories of either general assays that mea-
                            (high school) student at the International              sure the total antioxidant capacity (TAC) or specific assays for
                            School of Basel. This research project was              individual antioxidants. General assays, much more commonly
                            initiated for the Swiss Young Naturalist                used than specific assays, fall into two subclasses depending on
                            Tournament (SYNT), an annual competition                the underlying chemical mechanisms: either into the reactive oxy-
                            held at MNG Rämibühl, Zurich. On March 7,               gen species scavenging assays (ROSS assays such as the widely
                            2020 this research was presented and award-             used ORAC) or the redox potential assays (such as the widely
                            ed the first prize at the SYNT 2020 competi-            used FRAP). ORAC (oxygen radical absorbance capacity) uses
                            tion. More details can be found on https://             peroxy radical generated using fluorescein as a probe while FRAP
                            www.synt.ch/index.php/synt/synt-2020.                   (ferric reducing antioxidant power) is based on the reduction of
                                                                                    an Fe(iii) to Fe(ii) ion using ferricyanide as a probe. Both these
1. Introduction                                                                     tests are commercially available as kits but are expensive and may
    Antioxidants have been widely proven to show beneficial ef-                     be out of reach for many parts of the world. These TAC tests
fects on the human body.[1–3] Thus, the accurate, quick and cheap                   can be routinely done in a laboratory environment, however, it
determination of antioxidants present in complex naturally oc-                      needs sophisticated equipment in fluorometry, electron paramag-
curring matrices, such as fruits and vegetables, has been an area                   netic resonance, cyclic voltammetry or sensitive spectroscopic
of continued focus. For example, a new approach based on syn-                       measurements. Similar specialized equipment is also needed for
thetized MnO2 nanosheets to determine antioxidant levels was                        specific antioxidant tests; they typically include high performance
proposed as recently as earlier in 2020.[4] There are three main                    liquid chromatography (HPLC) system to separate antioxidants
challenges to determine antioxidant present in food and nutraceu-                   from natural interfering matrices and then coupling the elute from
ticals: a) there is huge chemical diversity of antioxidants (phenols,               HPLC with a diode-array-detector, mass spectroscopy or fluo-
thiols, carboxylic acids, carotenes, etc.), so any test must account                rescence detector for the detection of antioxidants. Developing
for different chemical structures that contribute to antioxidant                    a HPLC method free from interfering complex food matrix and
properties of that particular food group; b) the matrices of foods                  running this equipment requires specialized knowledge that is
are a complex mixture of cellulosic material, lignin, vitamins,                     not widely available in many geographically isolated parts of the
phytochemicals, etc. so interference from these water-soluble                       world. A reliable, cheaper and quick method to estimate TAC in
materials is an issue during measurements; and c) antioxidants                      complex natural matrix will benefit the agricultural community
are intrinsically unstable due to their rapid oxidation, thus, the                  and other rural communities to maximize antioxidant potential
test must be quick and simple, particularly if being conducted in                   of fruits and vegetables during its harvest, transport, storage and
an agricultural setting.                                                            distribution.
    Several accurate and reliable assays have been developed to                         Positive aspects of current commercial assays are a good guide
measure antioxidants in complex matrices.[5–7] These tests can be                   to design improvements in future assays. Based on this, there are

*Correspondence: A. Singhala, E-mail: ankit.singhal@isbasel.ch
a
  International School Basel, Fleischbachstrasse 2, CH-4153 Reinach, Switzerland, bSynthetic Molecules Technical Development, F. Hoffmann - La Roche Ltd,
Grenzacherstrasse 124, CH-4070 Basel, Switzerland
Future of Chemical Education                                                                                              CHIMIA 2021, 75, No. 1/2   75

at least three critical design elements to designing a new reliable,      2.3 Experimental Set-up
cheaper and quick method. First, the underlying principle should              The experimental set-up used in this study is shown in Fig. 1.
involve free radical mechanisms resulting in a clear response when        The BR reaction was initiated by adding 3 mL of solution C to
antioxidant is added; second, the resulting end point due to changes      premixed 3 ml solution A and 3 mL solution B in a test tube that
in free-radical species should be easy to detect (ideally visually);      was continuously mixed using a magnetic stirrer on a stir plate.
lastly, the assay should be easy to set up and the reagents involved      Each freshly prepared reaction mixture was allowed to come to
should be cheap, safe, and easily accessible. One reaction that fits      regular periodicity by going through 2 cycles of color change as
all of these three criteria is the oscillating Briggs-Rauscher (BR)       defined by appearance of the blue-black color. At the beginning
reaction published in 1973.[8] The oscillatory free-radical change in     of the third oscillation, 50 microliters of standard ascorbic acid
the BR reaction can be observed either through a very quick redox-        solution or fruit juice was added. All fruit juices used in this study
potential change or through cyclical color changes from colorless to      were freshly squeezed and filtered through a 5-micron filter just
amber to a blue-black color. The redox potential oscillations in BR       before each experiment. All experiments were done, at minimum,
has been widely studied using potentiometric methods. Each poten-         in triplicate.
tiometric cycle is reliable, typically lasting 10–30 seconds, thus po-
tentiometric methods have been developed to study the antioxidant
concentration in complex matrices.[9–15] However, potentiometric
measurement require platinum, silver or other similar electrodes
that are not readily available in educational settings. This idea of
using BR reaction to quantify antioxidant can be made simpler for
use to the wider student and agricultural communities if potentio-
metric measurements can be replaced by color change, which can
be monitored visually or be coupled with a simple spectrometer
that is widely available. Thus, in this study, the feasibility of using
color change in BR reaction is studied as a possible approach to
determine antioxidant content in complex matrices. If successful,
this will not only develop a new assay that is cheap and easy to do,
it is easily implementable in all educational settings (particularly at
high schools as needed) to show the beauty of applying a simple
reaction to solve a complicated problem and help energize students
                                                                          Fig. 1. Experimental set-up showing the three stages of the BR reaction
to aspire to study chemistry.
                                                                          as represented in Scheme 1. UV probe in the test tube was used to col-
                                                                          lect the absorbance at 250nm and 350 nm to capture the color change.
2. Experimental Section

2.1 Reagents and Chemicals
    All reagents and chemicals used in this study were purchased          3. Results and Discussion
from commercial sources. Ascorbic acid (vitamin C) was USP
grade and manufactured by DSM Nutritional Products Ltd (UK).              3.1 Blank BR Reaction and Effect of Antioxidant
This was used as a standard for generating the calibration curve.              Freshly mixed BR reaction reagents resulted in clear solution
Potassium iodate used was 99.5% pure from Acros Organics,                 as shown in Fig. 1 and then over the next 10–15 seconds the clear
Malonic acid was ≥99% pure from Fisher Chemical and man-                  solution slowly turned to amber color and then abruptly changed
ganese sulphate monohydrate was ACS reagent ≥ 98% pure                    to blue color. Subsequently, the blue color slowly faded away in
from Sigma-Aldrich. Starch soluble grade was manufactured by              the next 10–15 seconds to a colorless solution and this cycle of
Merck. Hydrogen peroxide was sourced as 30% aqueous solution,             color change repeated. Scheme I shows the color in the BR reac-
nonstabilized, from Acros Organics. Deionized water was used in           tion and underlying chemical species for the color. Formation of
all experiments.                                                          these chemical species, leading to the cyclical color change in the
    Three solutions were prepared for the BR reaction:                    BR reaction, is complex and still not fully understood, although
    Solution A (potassium iodate) was prepared by dissolving ap-          it is widely accepted that several slow non-radical and fast radical
proximately 43 g potassium iodate (KIO3) in 1000 mL deionized
water as the reaction is sensitive to chloride ions. The pH was
adjusted to 2-3 by addition of approx. 9 mL of sulfuric acid.
    Solution B (malonic acid with manganese sulphate) was pre-
pared by dissolving 15.6 g malonic acid and 3.4 g manganese
sulfate monohydrate first in approx. 800 mL deionized water. 4 g
of starch was then added and stirred until dissolved. The final
volume was adjusted to 1000 mL with water.
    Solution C (12% hydrogen peroxide) was prepared by dilut-
ing 30% stock aqueous hydrogen peroxide with water to make
1000 mL of 12% hydrogen peroxide final solution.

2.2 UV/Vis Spectrophotometer Probe
    An attenuated transmission reflectance spectroscopic probe
attached to a UV/Vis spectrophotometer (Carl-Zeiss) was used
for these experiments. These probes are widely available and used         Scheme 1. Color change in BR reaction due to the different amount of
in many applications such as pure inks, dyes, oil samples, etc. The       active species in the reaction mixture. Reaction starts off as colorless,
probe was inserted directly into the test tube where the reaction         slowly converts to amber color, then abruptly to blue color that then
occurs. UV absorbance at 250 nm (amber) and 350 nm (black                 slowly changes back to a colorless solution to continue the cycle to
blue) were collected to monitor the color of solution.                    blue.
76
CHIMIA 2021, 75, No. 1/2 Future of Chemical Education
reactions are occurring in parallel at varying rates that depend on
changing concentrations of the iodide ions species present in the 24
reaction.[16–20] This sets up two different points of equilibrium and 25
the switching of these two states creates the cyclical color change. 24
The overall reaction can be depicted using Eqn. (1) where iodate, 27
25
33
hydrogen peroxide and malonic acid at acidic pH in the presence
of manganese ion as a catalyst react to produce iodomalonic acid
at the end.
IO3– + 2H2O2 + CH2(COOH)2 + H+ → ICH(CO2H)2 + 2 O2 + 3 H2O (1)
Fig. 2. Example of a control BR reaction (without antioxidants). Each
To understand the color change, Eqn. (1) is broken down into peak at 250 nm and 350 nm corresponds to the appearance of blue
Eqns (2) to (4) below. These equations are still simple versions of color. Periodicity of peaks (seconds) in this measurement are shown.
the composite multiple underlying reactions. Reliable periodicity of 24 seconds to 25 seconds are maintained starting
with 3nd periodicity. Several replicates were conducted to establish the
baseline.
IO3– + 2H2O2 + H+ → HIO + 2 O2 + 2 H2O (2)
to reach its regular periodicity. Starting with the third cycle, as ex-
HIO + CH2(COOH)2 → ICH(COOH)2 + H2O (3) pected from the literature, the BR reaction behaved like clockwork
and a reliable baseline periodicity time (BPT) was observed in all
I– + HIO + H+ → I2 + H2O (4) blank runs as shown in Fig. 2 and listed in Table 1. Thus, the steady
state part of BR reaction occurred after the third blue color cycle
and was used as a reliable trigger point for the addition of all an-
I2 + CH2(COOH)2 → ICH(COOH)2 + H+ + I– (5) tioxidant measurements. The average duration of the appearance
of 16 peaks (3rd to 6th) for four blank runs done at different times
during the investigation was 24.6 ± 0.5 seconds with range of 24 to
25 seconds (Table 1).
Eqn. (2) is the simplified equation where hypoiodous acid (HIO)
is produced via a slow non-radical as well as a fast radical pathway. Table 1. Periodicity of the blank BR reaction across different measure-
HIO is consumed by reacting with malonic acid (CH2(COOH)2) ments. Complete run 1 in this table is shown in Fig. 2 with its different
to form iodomalonic acid (ICH(COOH)2) in Eqn. (3). These two periodicity. Steady-state was achieved starting with the 3rd period.
equations are in balance when low amounts of HIO are produced Average of 3rd to 6th periods for four runs was 24.6 ± 0.5 seconds and
in Eqn. (2) via the slow non-radical process. But when production used as baseline periodicity in all future calculations.
of HIO increases quickly due to the faster radical process, HIO
Measure- Periodicity Average
accumulates and the reactions shown in Eqns (4) and (5) start to
ment ± SD
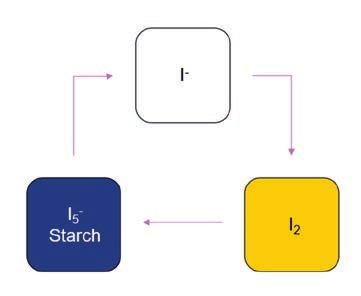
dominate. Initially the iodide anion (I–) is the predominant species 1st 2nd 3rd to 6th
Number
when reagents of the BR reaction are freshly mixed, so the solution
is colorless. Then, as shown in Eqn. (4), an excess of HIO results 1 33 27 25, 24, 24.50 ± 0.5
in the production of elemental iodine (I2) which leads to an amber 25, 24
color. As the concentration of the elemental iodine increases via
2 29 25 24, 25, 24.50 ± 0.5
Eqns (4) and (5), it forms a pentaiodide complex with iodide in
25, 24
high concentrations that binds with starch to create the blue-black
color. Due to the fact that Eqn. (4) is faster than Eqn. (5), the io- 3 24 27 24, 24, 24.25 ± 0.5
dide ion is consumed causing the pentaiodide-starch complexes to 25, 24
dissipate and leaving iodate as the primary species, thus changing
4 33 27 25, 25, 25.00 ± 0.0
the reaction back to a colorless state until enough elemental io-
25, 25
dine is formed again to change the reaction to an amber color. This
reaction continues periodically until either the iodate or malonic
acid is completely consumed by the reaction, which typically takes
>10–20 cycles. It is expected from these underlying free-radical
mechanisms that antioxidants will decrease HIO produced via the As discussed in the introduction, the BR reaction is based on a
fast radical process, and thus, disrupt the BR color cycle until all of slow non-radical as well as fast free-radical reactions (Eqns (2–5)),
the antioxidants are used up. This perturbation of the periodic color so the addition of antioxidants should consume the radicals gen-
cycle can be seen easily visually or via a simple UV/Vis probe. erated in the BR reaction leading to perturbation until all of the
UV/Vis spectra at 250 nm and 350 nm of the BR reaction are antioxidant is used, at which time the BR reaction should resume
shown in Fig. 2. The blue color in the BR reaction corresponded its periodic behavior. This duration of the perturbation, expressed
to the peak at 250 nm and 350 nm while colorless solution shows as the inhibition time (IHT), can be used to quantify the amount of
up as the trough of each peak at 250 nm and 350 nm. As expected antioxidants. To verify this theory and check the sensitivity of the
from the intrinsic wavelength of the blue-black color, 350 nm was BR reaction to determine naturally relevant concentrations of TAC,
more discriminating to pick up the color change in the BR reac- fruit juices known to have low antioxidant (peach) and moderate
tion, and thus was used for all future experiments. The periodicity antioxidant (grapefruit) contents were added separately to blank BR
of each cycle, defined by length of time between two consecutive reactions. Fig. 3 shows the BR reaction when peach or grapefruit
blue-black appearances (peak to peak at 350 nm), is also shown in juice was added at the third oscillation cycle. As expected, the pe-
Fig. 2. The first cycle tended to be the slowest while second cycle riodicity of this cycle was perturbed by the addition of antioxidant
was more consistent with values in the steady state but not yet like creating an IHT, until all antioxidant from the juice was consumed,
clockwork showing that the BR reaction needed the first two cycles after which the BR reaction came back to regular BPT periodicity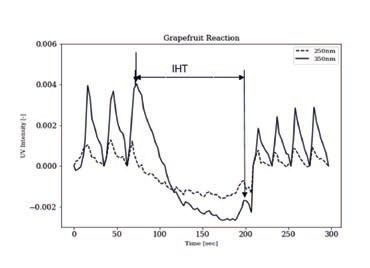
Future of Chemical Education                                                                                                    CHIMIA 2021, 75, No. 1/2   77

of 24–25 seconds when a new steady-state is re-established after               cates and they showed low variability. Fig. 4 shows APT versus
1-2 cycles post-IHT. These experiments also show that the BR reac-             AA standard solution curve. APT follows a linear response (r2 >
tion is sensitive enough to pick up low amounts of antioxidants in             0.99) with increasing AA, suggesting that the BR reaction can be
a fruit like peach (FRAP value of peach = 0.15mmol/100g, one of                used to quantify the antioxidant quantity. However, the validity
the lowest in fruits).[21,22]                                                  of these results to antioxidants present in complex matrices of
     IHT observed in Fig. 3 should be a combination of baseline                fruits needs to be assessed before the BR reaction can be used as
periodicity (BPT in Fig. 1) and the true antioxidant periodicity               a potential assay for TAC.
time (APT) caused by antioxidant perturbing the free-radical in
the BR reaction. Thus, APT due to antioxidant was calculated for
all future experiments by Eqn. (6) shown below:

 APT (antioxidant effect) = IHT (observed) – BPT (baseline)              (6)

   For example in Fig. 3, APT for peach juice and grapefruit juice
was estimated to be 41.4 and 103.4 seconds, respectively, based
on observed IHT of 66 and 128 seconds and BPT of 24.6 seconds.

                                     IHT = 66

                                                                    25

                                                24        24                   Fig. 4. APT at various concentrations of AA. Fit of data is the linear re-
                                                                               gression line (y = 24.99x -4.70) with r2 = 0.998.

                                                                               Table 2: IHT and resulting APT in BR after addition of various amounts of
                                                                               AA at 3rd cycle to measure the linearity of IHT with increasing concentra-
                                                                               tion of AA. All measurements were n = 3.

                                                                                Sample          Ascorbic       Average        Average           Standard
                                                                                                Acid con-      IHT            APT               deviation
                                    IHT = 128                                                   certation
                                                               25   24
                                                                                                (mg/ml)        (seconds)      (seconds)         (seconds)
                                                     21

                                                                                Ascorbic        0.33               29.0         4.4             1.7
                                                                                acid
                                                                                                0.65               34.3         9.8             1.2
                                                                                (vitamin C)
                                                                                                1.28               52.7       28.1              1.5

                                                                                                2.31               78.0       53.4              4.0

                                                                                                3.30           102.0          77.4              5.6
Fig. 3. Typical example of IHT during the BR reaction when fruit juices
containing antioxidant were added. Fruit juice was added at the third BR
peak as indicated by the first arrow. IHT and periodicity of post-IHT BR
                                                                               3.3 Quantification of Antioxidant Level in Fruits and
cycles are also shown. Top) addition of peach juice, IHT = 66 seconds;
Bottom) addition of grapefruit juice, IHT = 128 seconds. Post-IHT peri-
                                                                               Ascorbic Acid Equivalence (AAE)
odicity returned to BPT of 24-25 seconds after steady state was rees-              To demonstrate that the BR reaction can quantify antioxidant
tablished during the 1–2 cycles post-IHT.                                      levels in complex matrices of fruits, nine fruits with >10-fold dif-
                                                                               ferent antioxidant amounts were selected (Table 3). Juice from
                                                                               each of these fruits was squeezed and filtered through 5-micron
                                                                               paper. 50 microliters of the juice were added to the BR reac-
3.2 Calibration Curve and Linearity in Response from                           tion mixture, resulting in responses similar to Fig. 3. When the
Ascorbic Acid                                                                  APT of any fruit juice greatly exceeded that of AA calibration
    Ascorbic acid (vitamin C, AA), a well-known antioxidant,                   curve, juice was diluted with water to stay within the calibra-
was used as the standard to establish baseline linearity of the BR             tion curve. Table 3 shows the IHT and resulting APT of each
reaction and later express the APT for each fruit as total anti-               fruit. Variability in IHT was low (RSD of  0.99) of AAE determined in this study
of the curve was selected to be 10-fold higher to maintain the lin-            from the BR reaction to the published data confirming that the
earity of the curve. Table 2 shows the IHT and resulting APT of                BR assay is accurate in determining TAC. An added advantage
AA standard solutions with varying concentrations ranging from                 of studying BR reaction is the intrinsic pH of reaction mixture
0.33 mg/ml to 3.30 mg/ml. All experiments were done in tripli-                 of approximately 2, which is the pH typically found in stomach,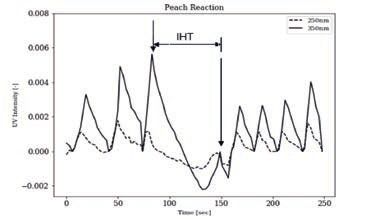
78
      CHIMIA 2021, 75, No. 1/2                                                                                            Future of Chemical Education

Table 3 – IHT and APT of different fruits in BR after addition of undiluted      expected to be much lower than the typical 2–3 USD per test for
or diluted juice of different fruits. All measurements were n=3. *diluted        FRAP or ORAC assay kits. A logical extension of this work will
2-fold, **diluted 4-fold.                                                        be to further simplify the experimental set up by using visual color
                                                                                 instead of a UV/Vis probe to make it commercially available for
 Sample               Scientific Name        Average     Average     Standard
                                                                                 use in agricultural, rural settings or other parts of world. To give
                                             IHT         APT         deviation
                                                                                 confidence that a visual endpoint is possible, all work presented
                                                                                 in this study was re-analyzed based on only visual appearance of
                                             (seconds)   (seconds)   (seconds)
                                                                                 blue-black color seen by the naked eye (only using IHT without
 Grape                Vitis Vinefera           57.3        32.7        2.1       correcting for BPT). All AAE values for fruits remained accurate
                                                                                 to published FRAP values suggesting use of color endpoint by
 Peach                Prunus Persica           62.3        37.7        6.4
                                                                                 end users is possible. In addition, more work is needed to confirm
 Gala Apple           Malus Domestica          64.0        39.4        6.2       the general applicability of AAE from the BR assay to other type
 Clementine           Citrus Clementina        89.3        64.7        9.5
                                                                                 of food groups. But, based on these experiments, it is expected to
                                                                                 apply widely for other water-soluble TACs.
 Lime                 Citrus Aurantiifolia     98.0        73.4        8.7

 Lemon                Citrus Limon           104.0         79.4        6.1
                                                                                 4. Conclusion
                                                                                     The BR reaction provides an excellent underlying chemistry
 Greenstar Apple      Malus Domestica        113.7*        89.1*       5.5       for this antioxidant assay because it was found to be as accurate
 Grapefruit           Citrus Paradisi        128.3       103.7       32.5        as the well-established antioxidant assays such as FRAP, while
                                                                                 using safe and cheap chemicals so no special precaution of pack-
 Pomegranate          Punica Granitum        221**       196.4**     55.4        aging is needed for using assay kits. In addition the end point is
                                                                                 a sharp color change from amber to blue that can be monitored
                                                                                 visually and the assay is very quick to do (typically 5 minutes).
                                                                                 Simplification of the monitoring of the BR reaction by simple vi-
                                                                                 sual assessment or UV/Vis spectrometric measurements, instead
                                                                                 of using potentiometric or cyclic voltammetry measurements, ren-
                                                                                 ders this approach much easier to use in educational institutions.
                                                                                 This can be used to energize and motivate students early in their
                                                                                 career to start thinking of how existing chemistry knowledge of
                                                                                 the BR reaction can be easily applied to solve real-world prob-
                                                                                 lems. The concept and data presented here can also be seen as an
                                                                                 invitation for an organization or a start-up company to develop
                                                                                 commercial BR assays kits that can be readily shipped to farm-
                                                                                 ers, labs in rural areas and/or parts of world where cost is a much
                                                                                 bigger issue.

Fig. 5. Ascorbic acid equivalence (AAE) of different fruits calculated from      Acknowledgements
APT of fruits juice using AA calibration curve.                                      We would like to sincerely thank Stefan Hildbrand for being a great
                                                                                 mentor during this work and provide the infrastructure that was needed
                                                                                 to perform this study. Without his help this work would not have been
                                                                                 possible. Also, we want to acknowledge to Florian Koch at ETH Zurich
                                                                                 for his advice during this project.

                                                                                                                                  Received: August 26, 2020

                                                                                 [1] A. Yashin, Y. Yashin, X. Xia, B. Nemzer, Antioxidants 2017, 6, 70,
                                                                                      https://doi.org/10.3390/antiox6030070
                                                                                 [2] H. N. Siti, Y. Kamisaha, J. Kamsiaha, Vascular Pharmacol. 2015, 71, 40,
                                                                                      https://doi.org/10.1016/j.vph.2015.03.005
                                                                                 [3] I. Gülçin, Arch. Toxicol. 2012, 86, 345,
                                                                                      https://doi.org/10.1007/s00204-011-0774-2
                                                                                 [4] H. Jaberie, S. Momeni, I. Nabipour, Microchem. J. 2020, 157, 104908,
                                                                                      https://doi.org/10.1016/j.microc.2020.104908
                                                                                 [5] F. Shahidi, Y. Zhong, J. Funct. Foods 2015, 18, 757,
Fig. 6. AAE of fruits determined using BR assay compared to the pub-                  https://doi.org/10.1016/j.jff.2015.01.047
lished antioxidant values of fruits determined using widely established          [6] K. Moon, T. Shibamoto, J. Agric. Food Chem. 2009, 57, 1655,
                                                                                      https://doi.org/10.1021/jf803537k
FRAP assays. Fit of data is the linear regression line (y = 6.06x + 0.43)
                                                                                 [7] N. Chaves, A. Santiago, J. C. Alías, Antioxidants, 2020, 9, 76,
with r2 = 0.998.                                                                      https://doi.org/10.3390/antiox9010076
                                                                                 [8] T. S. Briggs, W. C. Rauscher, J. Chem. Educ. 1973, 50, 496,
                                                                                      https://doi.org/10.1021/ed050p496
thus, it is a good indicator of antioxidant performance in the                   [9] J. Gajdos Kljusurić, S. Djaković, I. Kruhak, K. G. Kovačević, D. Komes,
human body.                                                                           Z. Kurtanjek, Acta Alimentaria 2005, 34, 483,
                                                                                      https://doi.org/10.1556/aalim.34.2005.4.15
    All chemicals used for the BR reaction (starch, potassium io-                [10] K. Höner, R. Cervellati, Eur. Food Res. Technol. 2002, 215, 437,
date, manganese sulphate, a keto-enol substrate such as malonic                       https://doi.org/10.1007/s00217-002-0582-2
acid, and hydrogen peroxide) are cheap, widely available, and                    [11] M. Pribus, L. Trnková, O. Grančičová, A. Olexová, Int. J. Chem. Kinetics
safe to use. Amount and cost of reagents for each BR reaction                         2018, 50, 481, https://doi.org/10.1002/kin.21174
                                                                                 [12] E. Prenesti, S. Toso, S. Berto, J. Agric. Food Chem. 2005, 53, 4220,
is an indicator of the potential cost of the BR assay. The cost of                    https://doi.org/10.1021/jf048302y
all reagents used in this study was approximately 0.15 USD per                   [13] S. Furrow, R. Cerevellati, E. Greco, Zeits. Naturforschung B 2012, 67,
5 ml of BR reaction mixture, thus, the final cost of BR assay kit is                  https://doi.org/10.1515/znb-2012-0115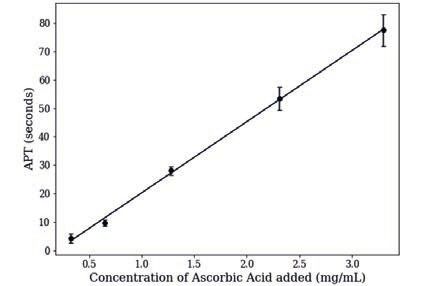
Future of Chemical Education                                                                                                         CHIMIA 2021, 75, No. 1/2   79

[14] L.-I. Csepei, C. Bolla, Studia Universitatis Babes-Bolyai Chemia 2009, 4,   [22] M. H. Carlsen, B. L. Halvorsen, K. Holte, S. K. Bøhn, S. Dragland, L.
     249.                                                                             Sampson, C. Willey, H. Senoo, Y. Umezono, C. Sanada, I. Barikmo, N.
[15] M. Pribus, L. Trnková, Chemistry Select 2018, 3, 10951,                          Berhe, W. C. Willett, K. M. Phillips, D. R. Jacobs Jr, R. Blomhoff, Nutrition
     https://doi.org/10.1002/slct.201802373                                           J. 2010, 9, 3, https://doi.org/10.1186/1475-2891-9-3
[16] S. S. Furrow, J. Chem. Educ. 2012, 89, 1421,
     https://doi.org/10.1021/ed200764r
[17] N. Okazaki, I. Hanazaki J. Chem. Phys. 1998, 109, 637,
     https://doi.org/10.1063/1.476602                                            License and Terms
[18] R. M. Noyes, S. D. Furrow, J. Am. Chem. Soc. 1982, 104, 45,                                             This is an Open Access article under the
     https://doi.org/10.1021/ja00365a011                                                                     terms of the Creative Commons Attribution
[19] F. D’Alba, S. Lorenzo, J. Electroanal. Chem. Interf. Electrochem. 1983,                                 License CC BY 4.0. The material may not be
     156, 435.                                                                                               used for commercial purposes.
[20] S. D. Furrow. K. Höner, R. Cervellati, Helv. Chim. Acta 2004, 87, 735,
     https://doi.org/10.1002/hlca.200490068
                                                                                     The license is subject to the CHIMIA terms and conditions: (http://
[21] D. Haytowitz. S. Bhagwat, USDA Database for ORAC of Selected                chimia.ch/component/sppagebuilder/?view=page&id=12).
     Food, Release 2, 2010, https://www.ars.usda.gov/research/publications/          The definitive version of this article is the electronic one that can be
     publication/?seqNo115=251105, accessed August 18, 2020.                     found at https://doi.org/10.2533/chimia.2021.74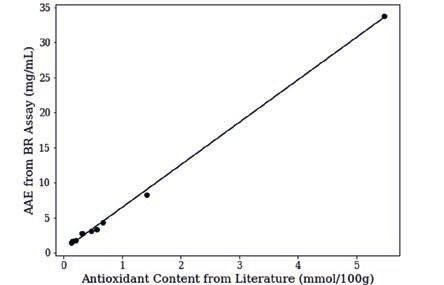
You can also read