OPTIMIZATION OF THE ULTRASOUD-ASSISTED EXTRACTION OF SAPONINS FROM QUINOA (CHENOPODIUM QUINOA WILD) USING RESPONSE SURFACE METHODOLOGY
←
→
Page content transcription
If your browser does not render page correctly, please read the page content below
UM P O L O
AR
TI
NO
N
AC TA
R
SC I E
Acta Sci. Pol. Technol. Aliment. 20(1) 2021, 17–23
UM
www.food.actapol.net pISSN 1644-0730 eISSN 1898-9594 http://dx.doi.org/10.17306/J.AFS.2021.0859
ORIGINAL PAPER Received: 9.07.2020
Accepted: 13.10.2020
OPTIMIZATION OF THE ULTRASOUD-ASSISTED EXTRACTION
OF SAPONINS FROM QUINOA (CHENOPODIUM QUINOA WILD)
USING RESPONSE SURFACE METHODOLOGY
Clara Raquel Espinoza1, Carlos Alexander Jaime Ruiz2, Omar Pablo Flores Ramos3,
Miguel Angel Quispe Solano4, Greta Hinostroza Quiñonez2,
Nancy Elisa Saavedra Mallma2
1
Centro de Investigación de Productos Naturales y Aplicaciones de la Universidad Nacional del Centro del Perú
Prolg. Lima 135, Distrito de San Jerónimo de Tunán – Huancayo – Junín, Peru
2
Facultad de Ingeniería en Industrias Alimentarias de la Universidad Nacional del Centro del Perú
Av. Mariscal Castilla 3909, Peru
3
Facultad de Ingenieria Mecánica de la Universidad Nacional del Centro del Perú
Av. Mariscal Castilla 3909, Peru
4
Estación Experimetal El Mantaro, Centro de Investigación de productos naturales de la Universidad Nacional del Centro
del Perú, Jauja – Junin, Peru
ABSTRACT
Background. Quinoa grain has a bitter tasting layer in the pericarp called saponin, a triterpenoid glycoside
with industrial potential. Traditionally, quinoa saponins are extracted with a large amount of water, which is
why ultrasound technology constitutes an emerging technological alternative which is considered efficient
and profitable compared to traditional extraction methods. The objective of this research was to determine the
amplitude, time, and concentration of ethanol that guarantee a higher content of saponin through extraction
assisted by ultrasound.
Materials and methods. To find the optimal extraction conditions, the response surface methodology was
used using the Box Behnken design with 5 central points, taking as a response the content of saponins (ex-
pressed in oleanolic acid as it is the most abundant sapogenin).
Results. According to the results obtained, the R2 values were in agreement with the adjusted R2, showing
that the data fit the model well. The results showed that ethanol concentration has a significant effect (p < 0.05)
on the saponin content in the extract. Optimization showed that the optimal extraction conditions were 70%
ethanol, 59% amplitude and an exposure time of 12 min. These values were obtained experimentally to
compare theoretical values and found residual error percentages less than 3%. The emulsifying activity was
evaluated, reporting a value of 52,495 units of emulsion activity per milliliter (UAE/mL), and the foaming
stability indicated that 87.54% of the initial foam was maintained after 5 min, indicating high stability.
Conclusion. The parameters of ethanol concentration, amplitude and time were optimized in the extraction
of saponins, assisted by ultrasound. Furthermore, the extract obtained had good foaming and emulsifying
characteristics, suggesting its suitability for use in industry.
Keywords: sapogenin, quinoa, ultrasound extraction, second order polynomial, Box Behnken design
crespinoza@uncp.edu.pe, https://orcid.org/0000-0001-8229-4177
© Copyright by Wydawnictwo Uniwersytetu Przyrodniczego w PoznaniuEspinoza, C. R., Jaime Ruiz, C. A., Flores Ramos, O. P., Quispe Solano, M. A., Hinostroza Quiñonez, G., Saavedra Mallma, N. E. (2021).
Optimization of the ultrasoud-assisted extraction of saponins from quinoa (Chenopodium quinoa Wild) using response surface
methodology. Acta Sci. Pol. Technol. Aliment., 20(1), 17–23. http://dx.doi.org/10.17306/J.AFS.2021.0859
INTRODUCTION saponins assisted by ultrasound from the pericarp of
quinoa, (a by-product of quinoa industrialization). The
Chenopodium quinoa Wild is an annual dicotyledon- surface response methodology was used to optimize
ous plant, it belongs to the Chenopodiaceae family the parameters (amplitude, time, and concentration of
(Wang and Zhao, 2014). Peru and Bolivia are the main ethanol) in the extraction of saponins, assisted by ul-
quinoa producing countries (Gianna et al., 2012). Qui- trasound, as well as to characterize their emulsifying
noa is not only rich in proteins and carbohydrates, but and foaming function.
it is also rich in bioactive substances, polyphenols,
flavonoids, and saponins (Graf et al., 2015). Saponins MATERIAL AND METHODS
are distributed mainly in the pericarp of quinoa seeds
(Woldemichael and Wink, 2001). Quinoa has rela- Materials
tively high levels of saponins depending on the vari- The pericarp of the quinoa grains was of the Hualhuas
ety and thickness of the pericarp (Jarvis et al., 2017). variety, collected from the quinoa processing compa-
They are a large group of complex structures and have nies in the city of Huancayo, Junín region, Peru. Ethanol
a biological activity of an organic nature (Osbour et was purchased from Fisher Scientific Co. (Fair Lawn,
al., 2011). The pericarp of quinoa is a by-product that NJ, USA). For the extraction of saponins from quinoa
is generally discarded because it is responsible for the scarification, a compact ultrasonic laboratory device
astringent or bitter taste, so removal is sought prior to UP 100H (Hielscher Ultrasound Technology, Teltow,
its consumption (Osbourn et al., 2011). Saponins also Germany) of 100 W and 30 kHz of power was used.
have foaming, emulsifying properties (Cheok et al., This equipment can adjust the power output by adjust-
2014), as well as an antioxidant, hepatoprotective, an- ing the amplitude percentage (20–100%). A sonotrode
ti-inflammatory (Jesus et al., 2015), antibacterial (Sun MS 7 was used with a pulse control set to 1 cycle of
et al., 2019), and molluscicidal properties (Jiang et al., continuous operation. The Thermo Fisher Genesis 10S
2018). The traditional extraction method uses large UV spectrophotometer was used for spectrophotomet-
amounts of water and energy expenditure in concen- ric readings, and the Agilent 6890 N gas chromato-
tration, whereas ultrasound-assisted extraction offers graph was used for the identification of sapogenins.
an alternative to minimize the use of water and en-
ergy (Panda and Manickam, 2019). Ultrasound extrac- Sample preparation
tion reduces extraction time compared to traditional The quinoa pericarp was ground to an approximate
methods (Picó, 2013). Ultrasound produces a cavita- size of 0.6 mm, recommended by Laqui-Vilca et al.
tion effect, which can cause physical and mechanical (2017), and then stored in plastic bags until use.
changes in raw materials, facilitating the extraction of
compounds (Chemat et al., 2017; Morales et al., 2020). Hydrolysis of saponin
The Box-Behnken Design Tool (BBD) is used for the To facilitate the quantification of total saponins, the
optimization of biological compound extraction proce- method proposed by Medina-Meza et al. (2016) was
dures and is an important surface methodology (RSM) used. An aliquot of about 0.8 mL of the crude con-
(Box and Wilson, 1951). BBD is a second-order ro- centrate was hydrolyzed with an equal proportion of
tary design based on a three-level incomplete factorial 6 N HCl at 110°C for 2 hours. The hydrolyzate pro-
design. This design is widely used as an inexpensive duced was cooled for 5 min with ice water. Later, it
method to extract a large amount of information with was neutralized with an ammonia solution. Then the
a small number of experiments (Aslan and Cebeci, neutralized solution was centrifuged at 3000 g for
2007). Also, the response surface methodology allows 5 min. The supernatant was extracted and combined
the monitoring of the interaction of the independent with ethyl acetate (3 mL of ethyl acetate for every 5 ml
variables with the response variables by using a col- of the sample). The fractions were then combined and
lection of statistical and mathematical methods (Hey- filtered on a bed of anhydrous sodium sulfate. The fi-
dari-Majd et al., 2014). The objective of this study was nal extract was stored at –20°C in an Eppendorf tube
to evaluate the effect of the conditions of extraction of until later analysis. Oleanolic acid is a compound that
18 www.food.actapol.net/Espinoza, C. R., Jaime Ruiz, C. A., Flores Ramos, O. P., Quispe Solano, M. A., Hinostroza Quiñonez, G., Saavedra Mallma, N. E. (2021).
Optimization of the ultrasoud-assisted extraction of saponins from quinoa (Chenopodium quinoa Wild) using response surface
methodology. Acta Sci. Pol. Technol. Aliment., 20(1), 17–23. http://dx.doi.org/10.17306/J.AFS.2021.0859
is found as a precursor for triterpenic saponins (Ahu- foam. The height of the foam generated was measured
mada et al., 2016). This acid was used as a standard to immediately and again after 5 min. The foam height at
elaborate the standard curve if it was also possible to the initial stage indicates the foaming power of the sur-
quantify the saponins when used as the predominant factant solution. The parameter R5, defined as the ratio
acid (Medina-Meza et al., 2016). of the height of the foam at 5 min to that at the initial
stage, is proposed as an evaluation of foam stability.
Oleanolic acid quantification
To determine the total saponins expressed in oleanol- Identification of sapogenins (GC)
ic acid, the proposed method by Medina-Meza et al. It was performed using gas chromatography (Medi-
(2016) was used. In this method, 250 μL of the final na-Meza et al., 2016). It consists of taking an aliquot
extract with 1000 μL of the reagent mixture (glacial of the final dry extract. The extracted saponins were
acetic acid / sulfuric acid 1:1 v/v) was placed in an Ep- then derivatized, using 100 µL of anhydrous pyri-
pendorf tube to develop the color. It was shaken vigor- dine, 100 µL of bis (trimethylsilyl) trifluoroacetamide
ously in a vortex for 30 s and then heated in a water (BSTFA), and 10 µL of cholesterol decanoate (inter-
bath at 60°C for 30 min, during which a faint lilac nal standard, IS). They are added to the dry extract
color developed. The mixture was then cooled in ice and heated at 70°C for one hour. Derivatized extracts
water for 5 min. The absorbance at 527 nm was meas- (2 µL) are injected into an Agilent 6890N gas chroma-
ured. Glacial acetic acid was used as a blank. tograph. A RESTEK Rxi-5HT capillary column (60 m
× 0.25 mm × 0.25 mm) was used. The injector and de-
Determination of emulsifying activity tector temperatures were adjusted to 350°C, while the
The emulsifying activity of saponins was carried out oven temperature was programmed from 160 to 220°C
using vegetable oil in an aqueous medium and by add- at 15°C/min, from 220 to 290°C at 10°C/min, for 7 min,
ing 3 ml of the crude extract of saponins and 0.5 ml from 290 to 330°C at 8°C/min maintained for 15 min.
of vegetable oil. It was stirred vigorously for 2 min
and incubated at room temperature for 1 hr without Experimental design
disturbance to separate the aqueous phase and the oil The ultrasound-assisted extraction of saponins was
phase. The aqueous phase was carefully removed us- carried out in a 1:50 ratio (solvent ratio) (Wang et al.,
ing a 1 mL micropipette and the absorbance was meas- 2018). The ultrasound-assisted extractions of saponin
ured. The solution without any oil was taken as a blank from quinoa scarification were optimized by response
(Ghagi et al., 2011). The absorbance of the emulsion surface methodology (RSM) using a Box Behnken
was measured using a spectrophotometer at a wave-
length established by complete scanning of the light
spectrum. The wavelength that obtained the highest Table 1. Levels and coded values of the independent vari-
absorbance for the sample was taken as the optimal ables of the response surface model
wavelength for all samples (this being 700 nm). The
Independent variables Levels Coded values
emulsification activity per ml (AE/ml) was calculated
using the formula: emulsification unit = absorbance Amplitude, % (A) 55 –1
obtained × dilution factor 60 0
65 +1
Determination of foaming stability
Ethanol concentration (B) 70 –1
The method used for measuring foaming power and
foam stability was that used by Chen et al. (2010). 75 0
A portion of the test solution was placed in a jacketed 80 +1
cylinder. Foam developed when a stream of the second Time (C) 10 –1
portion of 200 mL test solution was added to the first
12.5 0
portion of the test solution through a standard orifice
from a 90 cm height. This resulted in turbulence and 15 +1
www.food.actapol.net/ 19Espinoza, C. R., Jaime Ruiz, C. A., Flores Ramos, O. P., Quispe Solano, M. A., Hinostroza Quiñonez, G., Saavedra Mallma, N. E. (2021).
Optimization of the ultrasoud-assisted extraction of saponins from quinoa (Chenopodium quinoa Wild) using response surface
methodology. Acta Sci. Pol. Technol. Aliment., 20(1), 17–23. http://dx.doi.org/10.17306/J.AFS.2021.0859
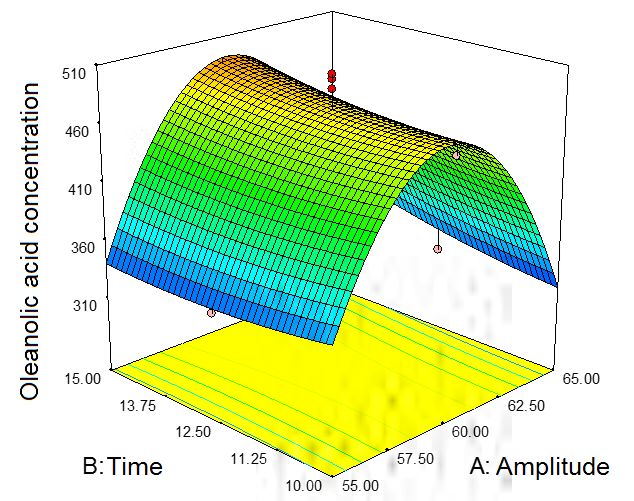
design with 5 central points. The amplitude (A), expo- Model analysis
sure time (B), and ethanol: water ratio (C), were taken Figure 1 shows the response surface graphs obtained
as independent variables and the saponin content (Z) for the factors studied.
as the dependent variable. The independent variables
were evaluated to optimize the extraction of saponins
from the scarified quinoa.
A second-order polynomial was used for the math-
ematical modeling of the relationship between the de-
pendent and independent variables.
The total content of saponins at optimal conditions
was estimated using second-order polynomials and
was validated experimentally. Surface response meth-
odology experiments were designed and analyzed us-
ing Design Expert 7 software.
3 3 2 3
Y = β0 +∑ βi X i + ∑ βii X i2 + ∑ ∑ β ij X i X j + ε (1)
i =1 i =1 i =1 j=i +1
where:
Y – the response or dependent variable,
X1, X2, X3 – independent variables,
β0, βi, βii, βij – the linear intersection, quadratic and
interaction coefficients, respectively,
ε – the residual.
RESULTS AND DISCUSSION
Fit to model
The content of saponins expressed as oleanolic acid
obtained experimentally was used to calculate the co-
efficients of the second-order polynomial equation, the
regression coefficients, and the p values. The regres-
sion model was established between the oleanolic acid
content (Z), the amplitude (A), the time (B), and the
ethanol-water ratio (C). The equation for the multivar-
iate quadratic adaptation of the regression model is:
Z = –3381.77714 + 90.84486 × A + 4.63171 × B
+ 18.12157 × C – 0.03 × A × B + 0.213 × A × C
– 0.018 × B × C – 0.86986 × A2 – 0.095429 × C2
– 0.19386 × C2
The value of R2 and adjusted R2 was 0.93 and 0.86
respectively. This also shows a significant value for
the equation (p < 0.01) whilst the model’s F value of
13.37 implies that the model is significant. Values of Fig. 1. Graphs of response surfaces of oleanolic acid ex-
Prob > F less than 0.05 indicate that the model terms tracted from quinoa pericarp affected by the amplitude,
are significant. time, and concentration of ethanol
20 www.food.actapol.net/Espinoza, C. R., Jaime Ruiz, C. A., Flores Ramos, O. P., Quispe Solano, M. A., Hinostroza Quiñonez, G., Saavedra Mallma, N. E. (2021).
Optimization of the ultrasoud-assisted extraction of saponins from quinoa (Chenopodium quinoa Wild) using response surface
methodology. Acta Sci. Pol. Technol. Aliment., 20(1), 17–23. http://dx.doi.org/10.17306/J.AFS.2021.0859
Medina-Meza et al. (2016) mention that the mix- and ethanol concentration – 70%, and thus, obtain-
ture of ethanol in water is used to extract the polar ing an oleanolic acid concentration of 532.35 mg of
and nonpolar components of the saponin. In this work oleanolic acid/ml of extract.
a dilution of ethanol in water was used, varying the In order to verify the optimized results produced
polarity for the extraction of saponin. This was impor- by the program, experimentation was carried out
tant in this work since the polar and apolar behavior which obtained results very close to those expected.
is a structural characteristic of this glycoside, which Therefore, we can say that the results are optimal for
is made up of a sugar and an aglycone (Wink, 2016). extraction.
Regarding the ultrasonic extraction time for saponins, Wang et al. (2018) obtained very similar values
it is lower compared to other extraction methods. The when optimizing the extraction of saponins from
extraction of saponins with water, for tea leaves, was oat bran, but with longer times. This was probably
reported by Yu (2018) as taking one hour. This was due to the extraction material, which allows for less
substantially higher in the time of ultrasonic extrac- cavitation.
tion carried out, as well as the extraction time of three
hours by Soxhlet reflux as reported by (Medina-Meza Quantification of sapogenin
et al., 2016). Short times were taken based on prelimi- by gas chromatography
nary results gathered and finding no significant differ- Four sapogenins present in the extracts obtained by ul-
ence in the time interval considered. Long extraction trasound were identified (oleanolic acid, hederagenin,
times tend to deteriorate metabolites and increase and sejanic acid).
the temperature of the medium. The optimal extrac-
tion time found in this work is lower than that found
Table 2. Sapogenins obtained in gas chromatography
by Wang et al. (2018), but the ethanol-water ratio is
higher. These variations are caused by the type of reac- Purified Holding time STD AO STD AO AO
tor used. A rod-type reactor was used for this research sapogenin min µg area µg
and not an ultrasound bath, as supported by Panda and Oleanolic acid 13.37 500 30 018 634 10.92
Manickam (2019) who state that the type of reactor
intervenes in the extraction due to the manner in which Hedagerin 14.39 500 30 018 634 8.55
the transfer of the ultrasonic waves is carried out. Sejánic acid 16.65 500 30 018 634 5.62
It was observed that as the amplitude increases, the
Others 17.03 500 30 018 634 2.90
oleanolic acid content in the extracts also increased,
but that it was not statistically significant for the sol- STD AO µg – standard oleonolic acid, µg; STD AO area –
vent content and time studied. Chemat et al. (2017) standard oleonolic acid, area; AO µg – oleonolic acid, µg.
advises a high amplitude to obtain the necessary me-
chanical vibrations that will lead to cavitation. Similar
ultrasound equipment was used by Zardo and Espindo- Madl et al. (2006), as well as Jeong et al. Yoon
la (2019), which tells us that the effects of ultrasound (2019), also found these saponins in analyses of quinoa
on extraction performance depend on the nature of the samples. The composition of sapogenins in saponins
plant material. The main effects related to improved determine their emulsifying and foaming properties.
releases of plant material content can be attributed to Elias and Diaz (1988) reported similar contents for
cavitation (which disrupts the cell wall), reduction in other varieties of quinoa planted in Perú.
particle size, intensification of mass transfer, and, con-
sequently, an increase in extraction. Emulsifying activity and foaming stability
of saponins from quinoa pericarp
Validation of optimal extraction conditions The sample had 52.49 units of emulsifier activity per
The estimated levels of optimal extraction conditions, milliliter (UAE/ml) and 84.5% foam stability (R5).
for the maximum response of oleanolic acid with de- They are two very important attributes in the industry
sirability value, were: amplitude – 59%, time – 12 min, and biological action (Ghagi et al., 2011).
www.food.actapol.net/ 21Espinoza, C. R., Jaime Ruiz, C. A., Flores Ramos, O. P., Quispe Solano, M. A., Hinostroza Quiñonez, G., Saavedra Mallma, N. E. (2021).
Optimization of the ultrasoud-assisted extraction of saponins from quinoa (Chenopodium quinoa Wild) using response surface
methodology. Acta Sci. Pol. Technol. Aliment., 20(1), 17–23. http://dx.doi.org/10.17306/J.AFS.2021.0859
The emulsifying activity and foaming stability of Colomb. Cien. Quím.-Farm., 45(3), 438–469. https://
saponins are mainly due to the presence of a lipid- doi.org/10.15446/rcciquifa.v45n3.62043
-soluble aglycone and a water-soluble sugar chain, Aslan, N., Cebeci, Y. (2007). Application of Box-Behnken
design and response surface methodology for modeling
which show an amphiphilic nature. In this way, foam-
of some Turkish coals. Fuel, 86, 1–2, 90–97.
ing is achieved (with liquid-gas phases), as is an
Box, G. E. P., Wilson, K. B. (1951). On the experimental
emulsifying effect (with liquid-liquid phases), and dis-
attainment of optimum conditions. J. Royal Stat. Soc.,
persibility (with liquid-solid phases). Saponins with 13, 1, 1–45.
a sugar chain have the best foaming characteristics Böttcher, S., Drusch, S. (2016). Interfacial properties of sap-
(Oleszek and Hamed, 2010). However, the emulsify- onin extracts and their impact on foam characteristics.
ing activity and foaming stability vary depending on Food Biophys., 11(1), 91–100. https://doi.org/10.1007/
the type of saponin and the aglycones present in its s11483-015-9420-5
structure, for example, the saponins of Sapindus mu- Chemat, F., Rombaut, N., Sicaire, A. G., Meullemiestre, A.,
korossi studied by Ghagi et al. (2011), lower than 235 Fabiano-Tixier, A. S., Abert-Vian, M. (2017). Ultrasound
UAE/ml in its emulsifying activity. assisted extraction of food and natural products. Mecha-
The foam, as spherical bubbles surrounded by nisms, techniques, combinations, protocols and appli-
liquid or wet foam, presented small bubbles. As time cations. A review. Ultrason. Sonochem., 34, 540–560.
passed, certain bubbles formed polyhedra. The re- Chen, Y. F., Yang, C. H., Chang, M. S., Ciou, Y. P., Huang, Y.
duced size of the bubbles indicated a decrease in C. (2010). Foam properties and detergent abilities of the
surface tension, whilst the subsequent increase in sur- saponins from Camellia oleifera. Int. J. Mol. Sci., 11(11),
face, but with a low variation in the size of polyhedral 4417–4425. https://doi.org/10.3390/ijms11114417
Cheok, C. Y., Salman, H. A. K., Sulaiman, R. (2014). Ex-
bubbles, indicated foam stability (Stevenson, 2012).
traction and quantification of saponins: A review.
The change in foam height presented a value of R5
Food Res. Int., 59, 16–40. https://doi.org/10.1016/j.
higher than 50% for what is considered a good stabil-
foodres.2014.01.057
ity. 87.54% was obtained for the R5 factor which is Elías Peñafiel, C., Díaz Villar, L. (1990). Determinación
slightly higher than the 86% reported by (Chen et al., espectrofotométrica de ácido oleanolico y saponinas de
2010). The result is quite similar to the 85% reported quinua (Chenopodium quinoa Willd, variedad Kancol-
by (Böttcher and Drusch, 2016). la). Arch. Latin. Nutr., 38, 113−131.
Ghagi, R., Satpute, S. K., Chopade, B. A., Banpurkar, A.
CONCLUSIONS G. (2011). Study of functional properties of Sapindus
mukorossi as a potential bio-surfactant. Ind. J. Sci. Tech-
Optimal conditions for the extraction of saponins nol., 4(5), 530–533.
from quinoa pericarp were optimized. They are: 60% Gianna, V., Montes, J. M., Calandri, E. L., Guzma, C. A.
amplitude, 12 minutes, and 70% ethanol. The sapo- (2012). Impact of several variables on the microwave
nin extracts extracted under these conditions had an extraction of Chenopodium quinoa willd saponins.
emulsifying activity of 52.49 units of activity of emul- Int. J. Food Sci. Technol., 47, 1593–1597. https://doi.
sion per milliliter (UAE ml–1) and foaming stabil- org/10.1111/j.1365-2621.2012.03008.x
ity of 87.54% for factor R5, obtaining good stability. Graf, B. L., Rojas-Silva, P., Rojo, L. E., Delatorre-Herrera, J.,
Baldeón, M. E., Raskin, I. (2015). Innovations in health
Saponins constitute an important biocomponent in the
value and functional food development of quinoa (Che-
pharmaceutical and agro-industrial industries, sug-
nopodium quinoa Willd.). Compr. Rev. Food Sci. Food
gesting the ultrasound-assisted extraction method as
Safety, 14(4), 431–445. https://doi.org/10.1111/1541-
a good alternative. 4337.12135
Heydari-Majd, M., Rajaei, A., Bashi, D. S., Mortazavi, S.
REFERENCES A., Bolourian, S. (2014). Optimization of ultrasonic-
assisted extraction of phenolic compounds from bovine
Ahumada, A., Ortega, A., Chito, D., Benítez, R. (2016). pennyroyal (Phlomidoschema parviflorum) leaves using
Saponins of quinoa (Chenopodium quinoa Willd): response surface methodology. Ind. Crops Prod., 57,
Un subproducto con alto potencial biológico. Rev. 195–202.
22 www.food.actapol.net/Espinoza, C. R., Jaime Ruiz, C. A., Flores Ramos, O. P., Quispe Solano, M. A., Hinostroza Quiñonez, G., Saavedra Mallma, N. E. (2021).
Optimization of the ultrasoud-assisted extraction of saponins from quinoa (Chenopodium quinoa Wild) using response surface
methodology. Acta Sci. Pol. Technol. Aliment., 20(1), 17–23. http://dx.doi.org/10.17306/J.AFS.2021.0859
Jarvis, D. E., Ho, Y. S., Lightfoot, D. J., Schmöckel, S. M., Oleszek, W., Hamed, A. (2010). Saponin‐based surfactants. In
Li, B., Borm, T. J. A., Tester, M. (2017). The genome M. Kjellin, I. Johansson (Eds.), Surfactants from renew-
of Chenopodium quinoa. Nature, 542(7641), 307–312. able sources resources (pp. 239–249). Chichester, UK:
https://doi.org/10.1038/nature21370 Wiley. https://doi.org/10.1002/9780470686607.ch12
Jeong, L., Hyum-Mee, P., Ki, Y. (2019). Analysis of sapo- Osbourn, A., Goss, R. J., Field, R. A. (2011). The saponins:
nin composition and comparison of the antioxidant polar isoprenoids with important and diverse biological
activity of various parts of the quinoa plant (Chenopo- activities. Nat. Prod. Rep., 28(7), 1261.
dium quinoa Willd.). Food Sci. Nutr., 8, 1. https://doi. Panda, D., Manickam, S. (2019). Cavitation technology –
org/10.1002/fsn3.1358 the future of greener extraction method: A review on the
Jesus, Jéssica, A. de, Lago, Joao Henrique, G., Laurenti, extraction of natural products and process intensifica-
Marcia, D., Yamamoto, Eduardo, S., Passero, Luis Fe- tion mechanism and perspectives. Appl. Sci., 9(4), 766.
lipe, D. (2015). Antimicrobial activity of oleanolic and https://doi.org/10.3390/app9040766
ursolic acids: An update. Evid.-Based Compl. Altern. Picó, Y. (2013). Ultrasound-assisted extraction for food and
Med. ID 620472. Retrieved from http://www.hindawi. environmental samples. TrAC – Trends Anal. Chem.,
com/journals/ecam/contents.html%5Cnhttp://ovidsp. 43, 84–99. https://doi.org/10.1016/j.trac.2012.12.005
ovid.com/ovidweb.cgi?T=JS&PAGE=reference&D=em Stevenson, P. (Ed., 2012). Foam engineering. Fundamentals
ed13&NEWS=N&AN=2015822252 and applications. Wiley-Blackwell.
Jiang, X., Cao, Y., Gersdorff Jørgensen von, L., Strobel, B. Sun, X., Yang, X., Xue, P., Zhang, Z., Ren, G. (2019).
W., Hansen, H. Ch. B., Cedergreen, N. (2018). Where Improved antibacterial effects of alkali-transformed
does the toxicity come from in saponin extract? Chem- saponin from quinoa husks against halitosis-related bac-
osphere, 204, 243–250. https://doi.org/10.1016/j.chem- teria. BMC Compl. Altern. Med., 19(1), 46. https://doi.
osphere.2018.04.044 org/10.1186/s12906-019-2455-2
Laqui-Vilca, C., Aguilar-Tuesta, S., Mamani-Navarro, W., Wang, J. C., Zhao, X. W. (2014). Research progress on char-
Montaño-Bustamante, J., Condezo-Hoyos, L. (2018). acteristics and development and utilization of quinoa. J.
Ultrasound-assisted optimal extraction and thermal sta- Zhejiang Agric. For. Univ., 31(2), 296–301.
bility of betalains from colored quinoa (Chenopodium Wang, S., Guo, X., Ma, T. (2018). Optimization of the ultra-
quinoa Willd) hulls. Ind. Crops Prod., 111, 606–614. sound-assisted extraction of saponins from germinated
https://doi.org/10.1016/j.indcrop.2017.11.034 quinoa and the evaluation of the radical-scavenging ac-
Madl, T., Sterk, H., Mittelbach, M. (2006). Tamdem mass tivity. 2018 International Conference on Modeling, Sim-
spectrometric analysis of a complex triterpene saponin ulation and Optimization (MSO 2018, pp. 580–585).
mixture of Chenopodium quinoa. J. Am. Soc. Mass Wink, M. (2016). Alkaloids: Toxicology and health effects.
Spectr., 17, 6, 795–806. https://doi.org/10.1016/j. In B. Caballero, P. M. Finglas, F. Toldrá (Eds.), The en-
jasms.2006.02.013 cyclopedia of food and health (pp. 106–114). Elsevier.
Medina-Meza, I. G., Aluwi, N. A., Saunders, S. R., Gan- https://doi.org/10.1016/B978-0-12-384947-2.00020-9
jyal, G. M. (2016). GC-MS profiling of triterpenoid Woldemichael, G. M., Wink, M. (2001). Identification and
saponins from 28 quinoa varieties (Chenopodium qu- biological activities of triterpenoid saponins from Che-
inoa Willd.) grown in Washington State. J. Agric. Food nopodium quinoa. J. Agric. Food Chem., 49(5), 2327–
Chem., 64(45), 8583–8591. https://doi.org/10.1021/acs. 2332. https://doi.org/10.1021/jf0013499
jafc.6b02156 Zardo, I., Espíndola, A. de (2019). Optimization of ultra-
Morales, M., Zapata, K., Sagaste, C. A., Angulo, A. A., Ro- sound assisted extraction of phenolic compounds from
jano, B. (2020). Optimización de la extracción asistida sunflower seed cake using response surface method-
por ultrasonido de polifenol, mangiferina y su expresión ology. Waste Biomass Valor., 10, 33–44. https://doi.
antioxidante en la piel de mango (Mangifera indica) org/10.1007/s12649-017-0038-3
utilizando metodología de superficie de respuesta. Acta
Sci. Pol. Technol. Aliment., 19(1), 5–14. https://doi.
org/10.17306/J.AFS.2020.0733
www.food.actapol.net/ 23You can also read