EFFECT OF HIGH PRESSURE, CALCIUM CHLORIDE AND ZNO- AG NANOPARTICLES ON BEEF COLOR AND SHEAR STRESS
←
→
Page content transcription
If your browser does not render page correctly, please read the page content below
Article

Effect of High Pressure, Calcium Chloride and ZnO-
Ag Nanoparticles on Beef Color and Shear Stress
Begoña Panea 1,2,*, Pere Albertí 1 and Guillermo Ripoll 1,2
 1 Animal Production and Health Unit, Centro de Investigación y Tecnología Agroalimentaria de Aragón,
 Avda. Montañana, 930, Zaragoza 50059, Spain; palberti@aragon.es (P.A.), gripoll@aragon.es (G.R.)
 2 Instituto Agroalimentario de Aragón-IA2 (CITA-Universidad de Zaragoza) Avda. Montañana, 930,

 Zaragoza 50059 Spain
 * Correspondence: bpanea@aragon.es

 Received: 13 January 2020; Accepted: 8 February 2020; Published: 12 February 2020

 Abstract: This study investigates how the use of a combination of high-pressure treatment, steak
 marination and active packaging influences beef color and shear stress. A 2 × 2 × 2 × 3 factorial design
 was applied, including pressure, marination, packaging and storage time. Many significant
 interactions among factors were found, but the effects of pressure and marination were so high that
 the effect of packaging was almost undetectable. Independent of storage type, pressurized
 treatments presented higher values for both L* and hab than unpressurized treatments, and
 independent of pressure application, the increase in L* and hab with storage time was higher for
 marinated treatments than for unmarinated treatments. In unpressurized samples, marination
 provoked an increase in L*, a* and hab and a decrease in ∗ , whereas in pressurized samples,
 marination had no effect on color. Pressurized samples always showed higher values for shear stress
 (on average 71% higher) than unpressurized samples.

 Keywords: pressure; marination; color; texture; packaging

1. Introduction
 The high-pressure technique is applied in the food industry mainly to inactivate microbial
growth, resulting in safety and extending the shelf life of products [1,2], but it can also be used to
improve meat tenderness. Nevertheless, although the use of high pressure in meat tenderization is
well known [2–4], its implementation in industry has been limited because the effect of high pressure
on meat texture depends on several factors, such as the pressure applied, temperature, time, muscle
and aging period. In addition, the application of high pressure promotes intense decoloration [1],
which can cause consumer rejection since color is one of the most important factors in buying
decisions [5]. In addition, high-pressure is an expensive technique since the machine costs about
500.000 euros and, in addition, 0.10–0.15 euros per sample (provider data).
 These changes in color are mainly due to two processes: adiabatic heating of the meat [6] and
changes in the oxygen consumption rate [7]. Lower oxygen consumption rates allow greater
penetration of oxygen into the muscle, resulting in more stable color [7]. Thus, the use of high-oxygen
packaging could aid in preserving underpressurized meat color. Nevertheless, when meat is packed
in high-oxygen packaging, it is more susceptible to lipid and protein oxidation, which in turn also
causes changes in color and sensory meat quality. The use of active packaging could be a solution,
and, in this sense, nanotechnology has broken into the packaging industry in recent years [8]. Metals
and their oxides, such as ZnO, TiO2, MgO and CaO, are particularly interesting because they are safe
for animals and humans [9], and they are allowed in the U.S. Food and Drug Administration list [10]
as well as in European Regulation R.450/2009 [11]. Among metal cations, silver ions are known to

Foods 2020, 9, 179; doi:10.3390/foods9020179 www.mdpi.com/journal/foods
Foods 2020, 9, 179 2 of 13

have the highest antimicrobial capacity against a wide spectrum of Gram+ and Gram–
microorganisms, but ZnO has gained interest due to its low cost [12].
 Another increasingly applied technique to counter the effect of high pressure is the use of
marinades. Marinating enhances meat flavor, juiciness and tenderness and is; therefore, especially
interesting for use in low-quality muscles, such as semitendinosus [13]. Unfortunately, depending on
the marinade liquid, it can also lead to color and texture modifications [14]. Thus, the sole use of
marinades may not be enough to counter pressure effects.
 The aim of the present paper was to investigate how the use of a combination of high-pressure
treatment, steak marination and active packaging influences beef color and shear stress. In the
literature, studies combining high pressure and marination [15] or packaging and marination [16]
can be found, but to the best of our knowledge, this triple combination of pressure, marination and
packaging has not been previously investigated.

2. Materials and Methods

2.1. Packaging: Production Method, Chemical Composition and Migration Assays
 Packaging composed of LDPE (low-density polyethylene, LD 654, ExxonMobil, Chemical,
Baytown, TX, USA) blended with a nano-antimicrobial master batch containing Ag and ZnO
nanoparticles (Avanzare, Navarrete, Spain) at 0% and 5% w/w was produced. Details of the packaging
production, composition and characteristics, as well as the migration assays, can be found in Panea
et al. [17]

2.2. Meat Sampling and pH Measurement
 Eight commercial carcasses from young bulls were used. The animals were slaughtered in a
commercial abattoir at 13 months of age, had a cold carcass weight of 361 ± 37.0 kg, and were
classified as U2 following the European Classification System [18]. Carcasses were kept at 4 °C until
the 5th day post-mortem. Then, the semitendinosus muscle of the left half of the carcasses was excised
and transported to the laboratory, and the pH was measured with a pH meter equipped with a Crison
507 penetrating electrode (Crison Instruments S.A., Barcelona, Spain).
 A 2 × 2 × 2 × 3 factorial design was applied, including pressure, marination, packaging and
storage time.
 From each muscle, eight steaks (3 cm-thick) were chopped perpendicularly to the fiber direction,
vacuum packed (MCOEX material bags, Coimbra Pack, S.L., Zaragoza, Spain) and kept at 4 °C for 24
h. Then, half of the steaks (named P) were treated with a high pressure of 600 MPa for 6 min, with
water at 12 °C as the transmission fluid, using a Hyperbaric 6000 machine (Hiperbaric, S.A., Burgos,
Spain), whereas the other half were not pressurized. Afterwards, all of the samples were removed
from the bags and the color was measured (experimental day 0). Subsequently, both pressurized (P)
and non-pressurized samples were split again, half placed into an LDPE-5%-nanoparticle tray
(named N), half into LDPE-0%-nanoparticle trays. Next, half of both the LDPE-5% or LDPE-0%-
nanoparticle trays were supplemented with calcium chloride solution to marinate the steaks (named
M), the other half remained without marinade liquid. The m-calpain, responsible for the meat
tenderization, needs a concentration of Ca2+ for activation between 1 and 5 nM [19]. However, when
concentration of calcium chloride solutions increased from 0.1 to 0.3 M, meat became darker and
more prone to oxidation [20]. Therefore, the concentration of the calcium chloride was set to 0.1 M.
Then, all of the trays were wrapped with a PE-LD oxygen-permeable film (Coimbra Pack, S.L.,
Zaragoza, Spain), without contact with the meat surface, and kept at 4 °C for 6 or 13 days, which was
considered time enough to see an effect, if one exists.
 Resuming, eight experimental batches were prepared:
• C: Control (unpressurized-LPDE 0%-unmarinated)
• N: unpressurized-LPDE 5%-unmarinated
• M: unpressurized-LPDE 0%-marinated
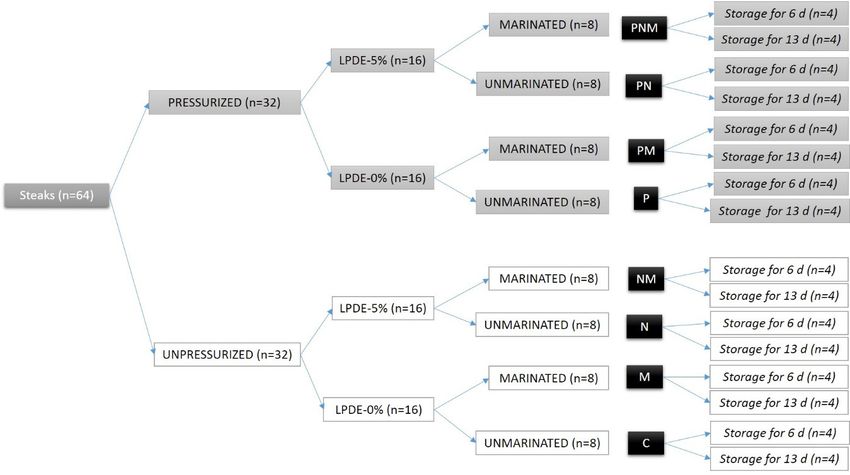
Foods 2020, 9, 179 3 of 13

• NM: unpressurized-LPDE 5%-marinated
• P: pressurized-LPDE 0%-unmarinated
• PN: pressurized-LPDE 5%-unmarinated
• PM: pressurized-LPDE 0%-marinated
• PNM: pressurized-LPDE 5%-marinated.
 The experimental design is shown in Figure 1.

 Figure 1. Experimental design.

2.3. Instrumental Procedures

2.3.1. Color
 Color was measured on the days 0 and 6 of treatment. Color changes were so evident at day 6
that to measure it at day 13 was considered unnecessary. All the samples used for color analysis were
allowed to bloom for 90 min. The color was measured with a Minolta CM-2006d spectrophotometer
(Konica Minolta Holdings, Inc, Osaka, Japan) in CIELAB space (CIE, 1986) with a measured area
diameter of 8 mm. The specular component included 0% UV; the standard illuminant was D65, which
simulates daylight (color temperature 6504 K); a 10° observer angle was used; and zero and white
calibrations were applied.
 The lightness (L*), redness (a*) and yellowness (b*) were recorded, and the hue angle (H°) and
 ∗ °
chroma (C*) indexes were calculated as ℎ = tan ∙ , expressed in degrees, and ∗ =
 ∗
 ∗ + ∗ . The relative contents of metmyoglobin (MMb) and oxymyoglobin (MbO2) were
estimated by the ratios K/S572/525 [21,22] and K/S610/525, respectively [21,23]. These ratios decrease when
the pigment content increases. The Kubelka-Munk K/S values were calculated using SpectraMagic
NX (Minolta Co., Ltd., Osaka, Japan), and K/S at 572 and 525 nm were calculated by linear
interpolation. Additionally, the ratio of light reflectance at 630 and 580 nm (R630/R580) [24,25] was
calculated. Finally, the color difference between two stimuli (ΔE) was calculated as
∆E*= ∆L* 2 + ∆a* 2 + ∆b* 2 , only in the cases in which it was necessary to explain human eye-
detectible differences [25].
Foods 2020, 9, 179 4 of 13

2.3.2. Texture
 Samples of the eight muscles were evenly distributed according to experimental treatments and
times. Because the size of the semitendinosus muscle was not enough to measure texture at three
storage points (0, 6, and 13 days), it was decided to avoid the initial point. Therefore, it was assumed
that differences in texture between treatments at day 0 would be unnoticeable and, consequently,
texture was measured only on days 6 and 13 of treatment. Samples were vacuum packed and heated
in a 75 °C water bath to an internal temperature of 70 °C, which was monitored with a Testo
thermocouple equipped with a probe (Testo SE & Co. KGaA, Lenzkirch, Germany). A minimum of
10 subsamples with a 10 × 10 mm2 cross-section were obtained following a longitudinal configuration
[26]. Samples were sheared using an Instron 5543 (ITW Test and Measurements, Essligen, Germany)
fitted with a Warner–Bratzler device. The shear maximum stress (load at maximum peak shear force
per unit of cross-section, in N/cm2) and toughness (amount of energy necessary to break the sample,
in N/cm2) were recorded.

2.3.3. Statistics
 Statistical analyses were performed with the XLSTAT statistical package v.3.05 (Addinsoft,
USA). Student’s t-test was performed to study the differences in pH between batches. Two
independent general linear model procedures were carried out for color and texture analysis, with
pressure application (yes/no), packaging type (with/without nanoparticles), marinade immersion
(yes/no), and storage time (0 or 6 days for color; 6 or 13 days for texture) as fixed effects. The means
and standard errors of all the considered variables were calculated. The Duncan test was used to
compare means, and the level of significance was p < 0.05.

3. Results

3.1. pH and Color
 The global mean pH was 5.66 (standard error = 0.015, results not shown), and no differences
were observed between samples (p > 0.05).
 Table 1 shows the p-values for the effects of studied factors on color variables. All studied factors
except packaging type (LPDE-0% or LPDE-5%) affected almost all the studied variables. In addition,
many significant interactions among effects were found, including the interaction between pressure
application and packaging type (P×N) on L*, a* and b*.

 Table 1. The p-values of the effects of the studied factors (pressure application, packaging type,
 marination and storage time) on beef color variables.

 L* a* b* ∗ hab MMb
 Pressure (P)
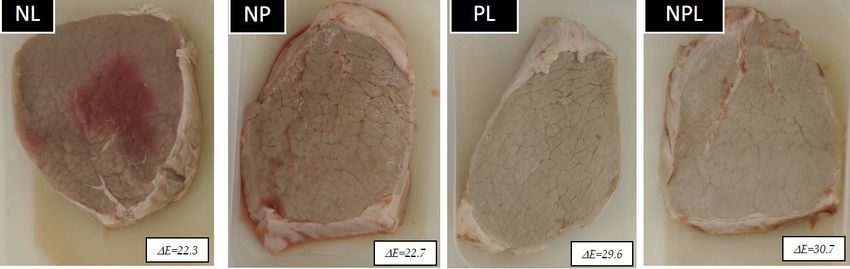
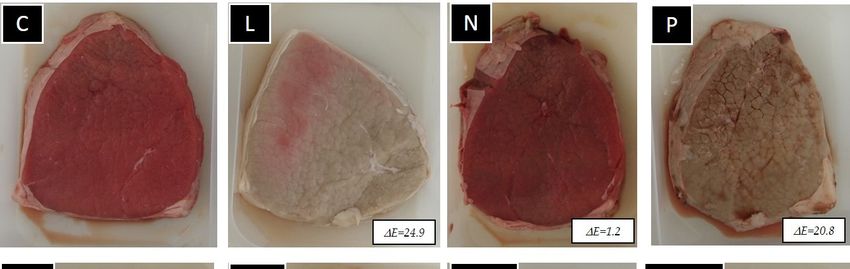
Foods 2020, 9, 179 5 of 13

increase in L*, a* and hab and a decrease in ∗ without an effect on b*. Nevertheless, in pressurized
samples, marination had no effect on color. Within a certain pressure–marinade combination,
packaging type did not affect any of the color variables. In the C and N treatments, storage time only
affected the metmyoglobin percentage, whereas in the rest of the treatments, all of the variables
changed over time, except b*.
 In Figure 2 are shown the ΔE values with respect to the control on day six of exposure. All of
them, except the value of N batch, were higher than the 2.5–3 usually considered as a threshold for
human eye detection [27,28].

 Table 2. The means and standard errors for beef color variables as a function of the studied factors
 (pressure application, packaging type, marinate immersion and storage time).

 Time,
 Treatment L* a* b* hab C* MMb %
 d
 0 40.3 cdx 15.4 ax 8.9 cx 30.2 cdx 17.8 abx 1.43 ax
 C
 6 41.9 Dx 15.2 Ax 9.7 Cx 32.4 Dx 18.1 Ax 1.33 Ay
 0 40.0 cdx 16.2 ax 9.6 bcx 30.9 cdx 18.9 ax 1.41 ax
 N
 6 40.9 Dx 15.8 Ax 9.8 Cxx 32.0 Dx 18.6 Ax 1.29 Ay
 0 41.5 cy 15.3 ax 10.3 bx 34.1 cy 18.5 ax 1.40 ax
 M 83.2
 6 62.4 Bx 1.1 Cy 9.2 Cx 9.3 Dy 0.91 Cy
 ABx
 0 39.3 dy 16.8 ax 8.8 cx 27.7 dy 19.1 ax 1.42 ax
 NM 77.9
 6 60.0 BCx 2.1 Cy 9.7 Cx 10.0 Dy 1.02 By
 BCx
 0 56.7 aby 8.5 bx 14.3 ax 59.6 aby 16.6 bx 0.96 bx
 P 14.7
 6 59.2 Cx 4.4 By 14.1 ABx 72.8 Cx 0.82 Dy
 BCy
 0 58.3 ay 8.0 bx 14.5 ax 61.3 ay 16.6 bx 1.03 bx
 PN
 6 60.8 BCx 4.0 By 15.2 Ax 75.4 Cx 15.7 Bx 0.83 Dy
 0 55.1 by 9.5 bx 13.6 ax 55.2 by 16.7 bx 1.07 bx
 PM
 6 67.4 Ax 0.5 Cy 13.3 Bx 87.7 Ax 13.3 Cy 0.92 Cy
 0 58.2 ay 8.0 bx 14.4 ax 61.0 ay 16.5 bx 1.02 bx
 PNM
 6 68.7 Ax 0.7 Cy 13.7 Bx 87.1 Ax 13.7 Cy 0.91 Cy
 Standard
 1.03 0.594 0.267 2.145 0.295 0.023
 error
 a,b—different letters in a column imply significant differences between treatments at day zero of
 exposure time (p < 0.05); A,B—different letters in a column imply significant differences between
 treatments at six days of exposure time (p < 0.05). x,y—different letters in a column imply significant
 differences between storage times for a certain treatment (p < 0.05). C: Control (unpressurized-LPDE
 0%-unmarinated); N: Unpressurized-LPDE 5%-unmarinated; M: Unpressurized-LPDE 0%-
 marinated; NM: Unpressurized-LPDE 5%-marinated; P: Pressurized-LPDE 0%-unmarinated; PN:
 Pressurized-LPDE 5%-unmarinated; PM: Pressurized-LPDE 0%-marinated; PNM: Pressurized-LPDE
 5%-marinated.
Foods 2020, 9, 179 6 of 13

 Figure 2. Steaks from the different experimental batches on day six of exposure and ΔE with respect
 to the control. C: Control (unpressurized-LPDE 0%-unmarinated); N: Unpressurized-LPDE 5%-
 unmarinated; M: Unpressurized-LPDE 0%-marinated; NM: Unpressurized-LPDE 5%-marinated; P:
 Pressurized-LPDE 0%-unmarinated; PN: Pressurized-LPDE 5%-unmarinated; PM: Pressurized-LPDE
 0%-marinated; PNM: Pressurized-LPDE 5%-marinated.

 Figure 3 is a representation of L* versus hab. In all of the treatments except C and N, both L* and
hab increased with storage time. Independent of the packaging and storage type, the pressurized
treatments (P, PN, PM and PNM) presented higher values for both L* and hab than the unpressurized
treatments (C, M, N, and NM); and independent of the pressure application and packaging type, the
increase in L* and hab with storage time was higher for the marinated treatments (M, NM, PM, and
PNM) than for the unmarinated treatments (C, N, P, and PN).
Foods 2020, 9, 179 7 of 13

 L* PM-6d
 85 M-6d PNM-6d
 NM-6d
 75
 marination-dependent time effect PN-6d

 P-6d
 65
 PNM-0d
 PN-0d
 P-0d pressurized
 55 treatments
 PM- 0d

 45

 N-6d M-0d unpressurized
 35
 N-0d treatments
 C-6d
 NM-0d C-0d hab
 25
 35 40 45 50 55 60 65 70

 Figure 3. Beef color representation of L* and hab as a function of the studied factors (pressure
 application, packaging type, marinate immersion and storage time). C: Control (unpressurized-LPDE
 0%-unmarinated); N: Unpressurized-LPDE 5%-unmarinated; M: Unpressurized-LPDE 0%-
 marinated; NM: Unpressurized-LPDE 5%-marinated; P: Pressurized-LPDE 0%-unmarinated; PN:
 Pressurized-LPDE 5%-unmarinated; PM: Pressurized-LPDE 0%-marinated; PNM: Pressurized-LPDE
 5%-marinated. Marinated treatments are in italics, and pressurized treatments are in bold.

3.2. Texture
 Table 3 shows the p-values for the effects of the studied factors on texture variables, and Table 4
shows the means and standard errors of the texture variables. Only pressure application affected the
texture variables, but a significant interaction was found between pressure and packaging type in
terms of shear stress (p = 0.027). Thus, when samples were pressurized, packaging type influenced
both the shear stress and toughness, whereas when samples were unpressurized, only shear stress
was affected by the packaging type. Independent of the packaging type, pressurized samples always
showed higher values for shear stress (on average, 71% higher) than unpressurized samples.

 Table 3. The p-values for the effects of the studied factors (pressure application, packaging type,
 marinade immersion and storage time) on beef shear stress and toughness.

 Shear Stress (N/cm2) Toughness (N/cm2)
 Pressure (P)
Foods 2020, 9, 179 8 of 13

 Table 4. The means and standard errors of beef shear stress and toughness as a function of treatment.

 Shear Stress (N/cm2) Toughness (N/cm2)
 C 40.5 bc 13.0 c
 N 48.0 b 16.1 bc
 M 38.7 c 17.1 bc
 NM 43.6 bc 17.8 abc
 P 78.9 a 22.7 a
 PN 71.9 a 20.1 ab
 PM 71.1 a 21.1 ab
 PNM 70.7 a 20.9 ab
 s.e. 2.21 0.67
 a,b—different letters in a column imply significant differences between treatments (p < 0.05). C:
 Control (unpressurized-LPDE 0%-unmarinated); N: Unpressurized-LPDE 5%-unmarinated; M:
 Unpressurized-LPDE 0%-marinated; NM: Unpressurized-LPDE 5%-marinated; P: Pressurized-LPDE
 0%-unmarinated; PN: Pressurized-LPDE 5%-unmarinated; PM: Pressurized-LPDE 0%-marinated;
 PNM: Pressurized-LPDE 5%-marinated.

4. Discussion

4.1. Color
 Values found for color variables were similar to those reported by other authors in semitendinosus
muscle [7,15,16].
 The effect of high pressure on meat color has been broadly reported. It is generally accepted that
pressure treatment increases beef lightness, whereas redness decreases and yellowness remains more
or less unchanged [1,3,15,29], in agreement with the current results. Because of these changes,
pressurized meat shows a pink color similar to that of cooked meat [30]. Pressure application occurs
via an adiabatic process that implies an increase in meat temperature [6] of approximately 3 °C per
100 MPa [31], which could explain why the general appearance of the meat resembled cooked meat
instead of fresh meat.
 These changes in color are associated with modifications in myoglobin structure, haem
displacement, the formation of metmyoglobin, the denaturation of myofibrillar proteins and changes
in connective tissue [3].
 Regarding myoglobin, Buckow et al. [32] reported that the primary and secondary structures of
globular proteins are rarely affected by high pressure because covalent bonds are minimally
compressible, whereas the tertiary and quaternary structures are damaged by high pressure. In
addition, pressure promotes the displacement of haem groups and iron ions, and, in the range of 250
to 500 MPa, the conversion of ferrous myoglobin to ferric metmyoglobin can be found, resulting in a
greener color [32]. On the other hand, a linear relationship was observed between the K/S572/525 ratio
and the amount of metmyoglobin accumulated on the steak surface, and it has been stated that
consumers start to discriminate color changes when the percentage of metmyoglobin reaches 20%
[7], that is, when the ratio value is above 1.20 [33,34]. In the current results, the K/S572/525 ratio ranged
between 0.94 and 1.40; therefore, the percentage of metmyoglobin would range between 50% and 0%,
with lower values for pressurized samples. Under the current conditions, it seems that the adiabatic
increase in temperature and not the metmyoglobin content was responsible for the surface meat color.
 In addition to these generally accepted overall color changes, it has been reported in literature
that the pressure effect depends largely on treatment conditions. Then, the L* value increases even at
low pressures (approximately 150 MPa), but no additional changes in L* value were observed for
pressures higher than 350 MPa [32]. Increases in L* values have been related to protein denaturation
[35], which affects light reflectance. On the other hand, the decrease in a* value is more evident above
400 MPa [32], and pressures higher than 300 MPa cause oxymyoglobin to transform into
metmyoglobin [36]. The temperature at which the high pressure was applied also influenced the
effect on meat discoloration. In general, the higher the temperature is, the higher the pressure effect
Foods 2020, 9, 179 9 of 13

[1]. For example, Marcos et al. [37] stated that the increase in L* value was higher when pressure was
applied at 30 °C than when it was applied at 20 or 10 °C.
 Regarding the effect of storage time, contradictory results can be found in the literature. Cheah
and Ledward [38] reported that if pressure is applied in the first two days after slaughter, pressure
treatment increases color stability during subsequent inspection, whereas if pressure treatment is
applied several days after slaughter, it has no effect on color stability. In contrast, King et al. [39]
reported a decrease in L*, a*, b* and ∗ * and an increase in hab from the 0th to 9th day of exposure in
semitendinosus muscle. The current results (Figure 2) show that color changes over time occurred
independently of the pressure, although they were more marked when samples were pressurized.
 The effect of marinating on meat color has been described by several authors. Cruzen et al. [16]
reported that a calcium-salt marinade promotes an increase in L* values without affecting the a*
values of semitendinosus muscle. In addition, these authors indicated that when meat was
unmarinated, the L* values increased from the first day to the 9th day of storage, whereas in
marinated samples, this evolution did not happen. Similarly, Klinhom et al. [40] reported an increase
in L* values and a decrease in a* values when semimembranosus samples were marinated with a 0.2 M
calcium chloride solution.
 The lack of an effect of combined Ag-ZnO treatment on meat color was previously found in our
laboratory in poultry [17]. In the current experiment, the effects of pressure and marination were so
high that the effect of packaging was almost undetectable.
 It can be seen in Figure 2 that differences between treatments are so evident that a consumer
visual test, which would be interesting if the effect were less noticeable, was considered unnecessary.

4.2. Texture
 Several mechanisms have been proposed to explain the effect of pressure on shear force. The
reported mechanisms include the destruction of the sarcomere structure at the I-line, M-line and Z-
line levels, the aggregation of fine and thick filaments [41], the unfolding of connective tissue, a
decrease in protein solubility [15], the activation of autolytic activity, the release of calcium into
cytosol and the denaturation of enzymes.
 As occurs with color, the effect of pressure treatment on meat texture depends on the pressure,
meat rigor state and temperature [3].
 It has been described that moderate pressures (400 MPa) induces meat toughening, and increases in pressure to 800
MPa leads to small changes [6]. In a meta-analysis studying the effect of pressure on pork [3], it was
found that pressures of 100–250 MPa resulted in a significant reduction in shear force of
approximately 0.92 kg, whereas if the pressure was higher than 250 MPa, the reduction was only
approximately 0.38 kg. Morton et al. [4] described that upon applying 175 MPa, shear force decreased
by approximately 60% in longissimus thoracis muscle and approximately 43% in gluteus medius muscle.
The shear force reduction is higher when pressure is applied in a pre-rigor state than when it is
applied in a post-rigor state [31]. Pressures of approximately 100–200 MPa cause the trickling of
cathepsins and calcium into the cytosol and a decrease in calpastatin. As a result, there is a disruption
of the myofibrillar structure and an improvement in tenderness [6,31,42]. Pressures above 300 MPa
induce the contraction of sarcomeres and the denaturation and fragmentation of proteins, but there
is also an increase in the area of the myofibrils, resulting in toughening of the meat, in agreement
with the current results [41,43].
 The sensitivity of proteins to pressure is temperature dependent, and it was much higher at
temperatures of approximately 60–70 °C than at 20 °C [6,42,44]. A combination of low pressure (less
than 200 MPa) and high temperature (approximately 60 °C) results in meat tenderization because
enzymes are active in these conditions, allowing proteolysis. In addition, at 60 °C, there was collagen
denaturation [31].
 Ueno et al. [45] reported that treatment with 100–400 MPa at 4 °C for 5 min caused deformation
of the endomysium, whereas other authors reported a reduction of the thermal stability of collagen
and a separation of the perimysium when meat was pressurized above 200 MPa at room temperature
Foods 2020, 9, 179 10 of 13

[46,47]. Nevertheless, under our experimental conditions (12 °C, 600 MPa), neither enzyme activity
nor collagen denaturation was allowed, and pressurized samples were tougher than unpressurized
samples.
 Several authors [40,48,49] have reported that calcium–salt marinades promote an improvement
in meat tenderness because calcium salts lead to an increase in the water content of the samples and
increase calpain activation, with subsequent protein degradation and weakening of the myofibrillar
structure. In a microstructure study, Sharedeh et al. [14] found that when meat was marinated it had
swelling of the meat fibers and an increase in extracellular space, resulting in lower intercellular
spaces in samples marinated with 2% salt than samples marinated with 0.9% salt. Nevertheless, our
results showed no effect of marination on texture variables, which is in agreement with Kim, et al.
[15], who stated that pressures above 200 MPa caused a decrease in water-holding capacity, resulting
in a more compact structure that did not permit swelling.

5. Conclusions
 Many significant interactions among factors were found in the present study.
 Under the applied conditions, it seems that the adiabatic increase in temperature and not the
metmyoglobin content was responsible for the surface meat color, and in addition, the effects of
pressure and marinade were so high that the effect of packaging was almost undetectable.
 Independent of the storage type, pressurized treatments presented higher values for both L* and
hab than unpressurized treatments.
 Independent of pressure application, the increase in L* and hab with storage time was higher for
marinated treatments than for unmarinated treatments.
 In unpressurized samples, marination provoked an increase in L*, a* and hab and a decrease in
 ∗
 , whereas in pressurized samples, marination had no effect on color.
 Pressurized samples always showed higher values for shear stress (on average, 71% higher) than
unpressurized samples.
 Further studies comparing different marinade ingredients or concentrations as well as different
pressures are necessary in order to find an optimal combination which allows the meat conservation
and tenderization without compromising the color.

Author Contributions: Conceptualization, B.P. and G.R.; methodology, B.P. and G.R.; formal analysis, B.P. and
G.R.; investigation, B.P., P.A. and G.R.; resources, B.P. and G.R.; data curation, B.P. and G.R.; writing—original
draft preparation, B.P.; writing—review and editing, B.P. and G.R.; funding acquisition, G.R. and P.A. All
authors have read and agreed to the published version of the manuscript.

Funding: This research was funded by the Ministerio de Economía, Industria y Competitividad (IPT-060000-
2010-019), Gobierno de Aragón-Fondos FEDER (DRU-2014-02-50-541-IFO-00740020008 and DRU-2014-02-50-
541-00-IFO-00740020009) and Research Group Funds of the Aragón Government (A14-17R SAGAS).

Acknowledgments: The authors are grateful to the AITIIP Foundation Technology Center, Jaime González and
Ángel Fernández-Cuello for their invaluable contribution to packaging design and development.

Conflicts of Interest: The authors declare no conflicts of interest.

References
1. Bak, K.H.; Bolumar, T.; Karlsson, A.H.; Lindahl, G.; Orlien, V. Effect of high pressure treatment on the color
 of fresh and processed meats: A review. Crit Rev Food Sci Nutr 2019, 59, 228-252,
 doi:10.1080/10408398.2017.1363712.
2. Bhat, Z.F.; Morton, J.D.; Mason, S.L.; Bekhit, A.E.-D.A. Applied and Emerging Methods for Meat
 Tenderization: A Comparative Perspective. Comprehensive Reviews in Food Science and Food Safety 2018, 17,
 841-859, doi:10.1111/1541-4337.12356.
3. Zybert, A.; Tarczyński, K.; Sieczkowska, H. A meta-analysis of the effect of high pressure processing on
 four quality traits of fresh pork. Journal of Food Processing and Preservation 2019, 43, e13895,
 doi:10.1111/jfpp.13895.
Foods 2020, 9, 179 11 of 13

4. Morton, J.D.; Pearson, R.G.; Lee, H.Y.; Smithson, S.; Mason, S.L.; Bickerstaffe, R. High pressure processing
 improves the tenderness and quality of hot-boned beef. Meat Sci 2017, 133, 69-74,
 doi:10.1016/j.meatsci.2017.06.005.
5. Mancini, R.A.; Hunt, M.C. Current research in meat color. Meat Sci 2005, 71, 100-121,
 doi:10.1016/j.meatsci.2005.03.003.
6. Ma, H.J.; Ledward, D.A. High pressure processing of fresh meat--is it worth it? Meat Sci 2013, 95, 897-903,
 doi:10.1016/j.meatsci.2013.03.025.
7. McKenna, D.R.; Mies, P.D.; Baird, B.E.; Pfeiffer, K.D.; Ellebracht, J.W.; Savell, J.W. Biochemical and physical
 factors affecting discoloration characteristics of 19 bovine muscles. Meat Sci 2005, 70, 665-682,
 doi:10.1016/j.meatsci.2005.02.016.
8. Kerry, J.; O’grady, M.; Hogan, S. Past, current and potential utilisation of active and intelligent packaging
 systems for meat and muscle-based products: A review. Meat Sci 2006, 74, 113-130.
9. Stoimenov, P.K.; Klinger, R.L.; Marchin, G.L.; Klabunde, K.J. Metal oxide nanoparticles as bactericidal
 agents. Langmuir 2002, 18, 6679-6686.
10. Emamifar, A.; Kadivar, M.; Shahedi, M.; Soleimanian-Zad, S. Evaluation of nanocomposite packaging
 containing Ag and ZnO on shelf life of fresh orange juice. Innovative Food Science & Emerging Technologies
 2010, 11, 742-748, doi:http://dx.doi.org/10.1016/j.ifset.2010.06.003.
11. Commission, E. COMMISSION REGULATION (EC) No 450/2009 of 29 May 2009 on active and intelligent
 materials and articles intended to come into contact with food. In Official Journal of the European Union, 2009;
 Vol. L 135/3.
12. Llorens, A.; Lloret, E.; Picouet, P.A.; Trbojevich, R.; Fernandez, A. Metallic-based micro and
 nanocomposites in food contact materials and active food packaging. Trends in Food Science & Technology
 2012, 24, 19-29, doi:10.1016/j.tifs.2011.10.001.
13. Torrescano, G.; Sánchez-Escalante, A.; Giménez, B.; Roncales, P.; Beltrán, J.A. Shear values of raw samples
 of 14 bovine muscles and their relation to muscle collagen characteristics. Meat Sci 2003, 64, 85-91.
14. Sharedeh, D.; Gatellier, P.; Astruc, T.; Daudin, J.D. Effects of pH and NaCl levels in a beef marinade on
 physicochemical states of lipids and proteins and on tissue microstructure. Meat Sci 2015, 110, 24-31,
 doi:10.1016/j.meatsci.2015.07.004.
15. Kim, Y.-J.; Lee, E.-J.; Lee, N.-H.; Kim, Y.-H.; Yamamoto, K. Effects of hydrostatic pressure treatment on the
 physicochemical, morphological, and textural properties of bovine semitendinosus muscle. Food Science and
 Biotechnology 2007, 16, 49-54.
16. Cruzen, S.M.; Kim, Y.H.; Lonergan, S.M.; Grubbs, J.K.; Fritchen, A.N.; Huff-Lonergan, E. Effect of early
 postmortem enhancement of calcium lactate/phosphate on quality attributes of beef round muscles under
 different packaging systems. Meat Sci 2015, 101, 63-72, doi:10.1016/j.meatsci.2014.11.004.
17. Panea, B.; Ripoll, G.; González, J.; Fernández-Cuello, Á.; Albertí, P. Effect of nanocomposite packaging
 containing different proportions of ZnO and Ag on chicken breast meat quality. J Food Eng 2014, 123, 104-
 112, doi:10.1016/j.jfoodeng.2013.09.029.
18. E.U. Council Regulation (EC) No 1183/2006 of 24 July 2006 concerning the Community scale for the
 classification of carcasses of adult bovine animals. In Official Journal of the European Union, 2006; pp
 L214/211-L214/216.
19. Gerelt, B.; Rusman, H.; Nishiumi, T.; Suzuki, A. Changes in calpain and calpastatin activities of osmotically
 dehydrated bovine muscle during storage after treatment with calcium. Meat science 2005, 70, 55-61.
20. Lawrence, T.; Dikeman, M.; Hunt, M.; Kastner, C.; Johnson, D. Effects of calcium salts on beef longissimus
 quality. Meat Science 2003, 64, 299-308.
21. Mancini, R.A.; Hunt, M.C.; Kropf, D.H. Reflectance at 610 nanometers estimates oxymyoglobin content on
 the surface of ground beef. Meat Science 2003, 64, 157-162.
22. Stewart, M.R.; Zipser, M.W.; Watts, B.M. The use of reflectance spectrohotometry for the assay of raw meat
 pigments. Journal of Food Science 1965, 30, 464-469.
23. Hunt, M.C., et al. Guidelines for meat color evaluation; National livestock and meat board: Chicago, Illinois,
 1991; pp. 1-17.
24. Strange, E.D.; Benedict, R.C.; Gugger, R.E.; Metzger, V.G.; Swift, C.E. Simplified methodology for
 measuring meat color. Journal of Food Science 1974, 39, 988-992.
25. AMSA. Meat Color Measurement Guidelines; American Meat Science Association: 2012.
26. Lepetit, J.; Culioli, J. Mechanical properties of meat. Meat Science 1994, 36, 203-237.
Foods 2020, 9, 179 12 of 13

27. Ripoll, G.; Panea, B.; Albertí, P. Visual appraisal of beef: Relationship with CIELab color space. ITEA
 Informacion Tecnica Economica Agraria 2012, 108, 222-232.
28. Ripoll, G., et al. Color variability of beef in young bulls from fifteen European breeds. Int J Food Sci Technol
 2018, doi:10.1111/ijfs.13890.
29. Ha, M.; Dunshea, F.R.; Warner, R.D. A meta-analysis of the effects of shockwave and high pressure
 processing on color and cook loss of fresh meat. Meat Sci 2017, 132, 107-111,
 doi:10.1016/j.meatsci.2017.04.016.
30. Bajovic, B.; Bolumar, T.; Heinz, V. Quality considerations with high pressure processing of fresh and value
 added meat products. Meat Sci 2012, 92, 280-289, doi:10.1016/j.meatsci.2012.04.024.
31. Warner, R.D.; McDonnell, C.K.; Bekhit, A.E.D.; Claus, J.; Vaskoska, R.; Sikes, A.; Dunshea, F.R.; Ha, M.
 Systematic review of emerging and innovative technologies for meat tenderisation. Meat Sci 2017, 132, 72-
 89, doi:10.1016/j.meatsci.2017.04.241.
32. Buckow, R.; Sikes, A.; Tume, R. Effect of high pressure on physicochemical properties of meat. Crit Rev Food
 Sci Nutr 2013, 53, 770-786, doi:10.1080/10408398.2011.560296.
33. Hood, D.E. Pre-slaughter injection of sodium ascorbate as a method of inhibiting metmyoglobin formation
 in fresh beef. Journal of the Science of Food and Agriculture 1975, 26, 85-90.
34. Ripoll, G.; Albertí, P.; Casasús, I.; Blanco, M. Instrumental meat quality of veal calves reared under three
 management systems and color evolution of meat stored in three packaging systems. Meat Sci 2013, 93, 336-
 343, doi:https://doi.org/10.1016/j.meatsci.2012.09.012.
35. Hughes, J.; Oiseth, S.; Purslow, P.; Warner, R. A structural approach to understanding the interactions
 between color, water-holding capacity and tenderness. Meat Sci 2014, 98, 520-532.
36. Jung, S.; Ghoul, M.; de Lamballerie-Anton, M. Influence of high pressure on the color and microbial quality
 of beef meat. LWT-food science and technology 2003, 36, 625-631.
37. Marcos, B.; Kerry, J.P.; Mullen, A.M. High pressure induced changes on sarcoplasmic protein fraction and
 quality indicators. Meat Sci 2010, 85, 115-120, doi:10.1016/j.meatsci.2009.12.014.
38. Cheah, P.; Ledward, D. Inhibition of metmyoglobin formation in fresh beef by pressure treatment. Meat Sci
 1997, 45, 411-418.
39. King, D.A.; Shackelford, S.D.; Wheeler, T.L. Relative contributions of animal and muscle effects to variation
 in beef lean color stability. J Anim Sci 2011, 89, 1434-1451, doi:10.2527/jas.2010-3595.
40. Klinhom, P.; Klinhom, J.; Senapa, J.; Methawiwat, S. Improving the quality of citric acid and calcium
 chloride marinated culled cow meat. International Food Research Journal 2015, 22, 1410-1416.
41. Jung, S.; de Lamballerie-Anton, M.; Ghoul, M. Modifications of Ultrastructure and Myofibrillar Proteins of
 Post-rigor Beef Treated by High Pressure. LWT - Food Science and Technology 2000, 33, 313-319,
 doi:10.1006/fstl.2000.0654.
42. Ma, H.J.; Ledward, D.A. High pressure/thermal treatment effects on the texture of beef muscle. Meat Sci
 2004, 68, 347-355, doi:10.1016/j.meatsci.2004.04.001.
43. Marcos, B.; Aymerich, T.; Dolors Guardia, M.; Garriga, M. Assessment of high hydrostatic pressure and
 starter culture on the quality properties of low-acid fermented sausages. Meat Sci 2007, 76, 46-53,
 doi:10.1016/j.meatsci.2006.09.020.
44. McArdle, R.A.; Marcos, B.; Kerry, J.P.; Mullen, A.M. Influence of HPP conditions on selected beef quality
 attributes and their stability during chilled storage. Meat Sci 2011, 87, 274-281,
 doi:10.1016/j.meatsci.2010.10.022.
45. Ueno, Y.; Ikeuchi, Y.; Suzuki, A. Effects of high pressure treatments on intramuscular connective tissue.
 Meat Sci 1999, 52, 143-150.
46. Kwiatkowska, A.; Jankowska, B.; Korzeniowski, W. Changes in solubility of the bovine semitendinosus
 muscle collagen under the influence of high pressure. Pol J Food Nutr Sci 2001, 4.
47. Ichinoseki, S.; Nishiumi, T.; Suzuki, A. Tenderizing effect of high hydrostatic pressure on bovine
 intramuscular connective tissue. J Food Sci 2006, 71, E276-E281.
Foods 2020, 9, 179 13 of 13

48. Perez-Chabela, M.L.; Guerrero-Legarreta, L.I.; Gutierrez-Ruiz, M.C.; Betancourt-Rule, J.M.; Perez-Torres,
 A.; Ustarroz-Cano, M. Effect of Calcium Chloride Marination on Electrophoretical and Structural
 Characteristics of Beef, Horse, Rabbit and Chicken Meat. International Journal of Food Properties 2005, 8, 207-
 219, doi:10.1081/jfp-200059476.
49. Whipple, G.; Koohmaraie, M. Calcium Chloride Marination Effects on Beef Steak Tenderness and Calpain
 Proteolytic Activity. Meat Sci 1993, 33, 265−275.

 © 2020 by the authors. Licensee MDPI, Basel, Switzerland. This article is an open access
 article distributed under the terms and conditions of the Creative Commons Attribution
 (CC BY) license (http://creativecommons.org/licenses/by/4.0/).
You can also read


