Ionizographic detector for Breast Cancer Diagnosis
←
→
Page content transcription
If your browser does not render page correctly, please read the page content below
Research, Society and Development, v. 10, n. 9, e24410917229, 2021
             (CC BY 4.0) | ISSN 2525-3409 | DOI: http://dx.doi.org/10.33448/rsd-v10i9.17229

Ionizographic detector for Breast Cancer Diagnosis
Detector Ionizográfico para Diagnóstico de Câncer de Mama
Detector Ionizográfico para el Diagnóstico del Cáncer de Mama

                                                    Received: 06/16/2021 | Reviewed: 06/28/2021 | Accept: 07/15/2021 | Published: 07/25/2021

                                                                                                                   Helton Gírio Matos
                                                                                             ORCID: https://orcid.org/0000-0001-6379-7027
                                                                                                      Universidade Vale do Paraíba, Brazil
                                                                                                     E-mail: helton_matos@yahoo.com.br
                                                                                                   Marco Antonio Ramirez Ramos
                                                                                             ORCID: https://orcid.org/0000-0002-9667-5533
                                                                                                      Universidade Vale do Paraíba, Brazil
                                                                                                         E-mail: marco.antonio@univap.br
                                                                                                                           Lúcia Vieira
                                                                                             ORCID: https://orcid.org/0000-0002-9354-6533
                                                                                                      Universidade Vale do Paraíba, Brazil
                                                                                                             E-mail: lucia.vieira@univap.br
                                                                                                                    Ary Oliveira Pires
                                                                                             ORCID: https://orcid.org/0000-0003-0977-3838
                                                                                                     Universidade Federal do Piauí, Brazil
                                                                                                          E-mail: aryopires@yahoo.com.br

      Abstract
      Every day the number of cancer victims increases. In 2020 alone, 626,030 people were affected in Brazil, according to
      estimates by the National Cancer Institute (INCA). The only way to reduce these numbers is early diagnosis. In the
      present study, a invention called Ionizographic Detector is described, which performs Positron Emission Tomography
      (PET) producing metabolic information in breast nodules. This device enables accurate diagnosis of breast nodules
      regarding its malignancy. To prove its effectiveness, a comparative evaluation was made between the Ionizographic
      Detector and the Positron Emission Tomography/Computerized Tomography (PET-CT) for analysis of the metabolic
      data in breast nodules. The research is being carried out with 20 patients who have histopathologically documented
      breast cancer. From the results it will be possible to prove the device’s efficacy. It will thus enable an accurate and low-
      cost malignancy diagnosis option. The Ionizographic Detector can be hybridized with some anatomical imaging
      technology, such as Ultrasound (US). With this, it is possible to promote greater access to accurate diagnoses,
      significantly increasing the possibility of early diagnoses, enabling a cure or a better prognosis for the patient.
      Keywords: Cancer; Nodule; Breast; PET-CT.

      Resumo
      A cada dia aumenta a quantidade de vítimas do câncer. Só no ano de 2020 acometeu 626.030 pessoas no Brasil, segundo
      estimativas do Instituto Nacional do Câncer – INCA. A única forma para a diminuição desses números é o diagnóstico
      precoce. No presente estudo é caracterizado um invento chamado Detector Ionizográfico, que realiza Tomografia por
      Emissão de Pósitrons (PET) produzindo informações metabólicas de nódulos mamários. Possibilita diagnóstico preciso
      de nódulos mamários quanto a sua malignidade. Para comprovar sua efetividade, foi feita uma avaliação comparativa
      qualitativa entre o Detector Ionizográfico e o Tomografia por Emissão de Pósitrons/Tomografia Computadorizada
      (PET-CT) para análise de dados metabólicos em nódulos mamários. A pesquisa foi realizada com 3 pacientes que
      apresentavam nódulo mamário documentado por histopatológico. A partir dos resultados foi possível comprovar a
      eficiência do aparelho. Possibilitará assim, uma opção de diagnóstico de malignidade preciso e de baixo custo. Seguindo
      a tendência, o Detector Ionizográfico pode ser hibridizado com alguma tecnologia de imagens anatômicas, como o
      ultrassom. Com isso é possível promover maior acesso a diagnósticos precisos, aumentando sensivelmente a
      possibilidade de diagnósticos precoces, viabilizando a cura ou melhor estadia do paciente.
      Palavras-chave: Câncer; Nódulo; Mama; PET-CT.

      Resumen
      Cada día aumenta el número de víctimas de cáncer. Solo en 2020, 626,030 personas se vieron afectadas en Brasil, según
      estimaciones del Instituto Nacional del Cáncer - INCA. La única forma de reducir estos números es el diagnóstico
      temprano. En el presente estudio se caracteriza un invento denominado Detector ionizográfico, que realiza una
      Tomografía por Emisión de Positrones (PET) produciendo información metabólica de los nódulos mamarios. Permite
      un diagnóstico preciso de los nódulos mamarios con respecto a su malignidad. Para comprobar su eficacia, se realizó
      una evaluación comparativa cualitativa entre el Detector Ionizográfico y la Tomografía por Emisión de Positrones /
      Tomografía Computarizada (PET-CT) para el análisis de datos metabólicos en nódulos mamarios. La investigación se

                                                               1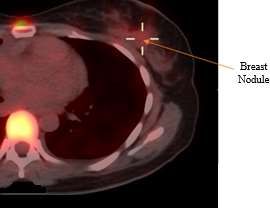
Research, Society and Development, v. 10, n. 9, e24410917229, 2021
                (CC BY 4.0) | ISSN 2525-3409 | DOI: http://dx.doi.org/10.33448/rsd-v10i9.17229

         realizó con 3 pacientes que tenían un nódulo mamario documentado por examen histopatológico. A partir de los
         resultados, fue posible demostrar la eficiencia del dispositivo. De este modo, permitirá una opción de diagnóstico de
         malignidad precisa y de bajo costo. Siguiendo la tendencia, el detector ionizográfico se puede hibridar con alguna
         tecnología de imágenes anatómicas, como la ecografía. Con esto, es posible promover un mayor acceso a diagnósticos
         precisos, aumentando significativamente la posibilidad de diagnósticos precoces, posibilitando una cura o una mejor
         estancia del paciente.
         Palabras clave: Cáncer; Nódulo; Seno; PET-CT.

1. Introduction
         According to Pereira et al. (2010) Brazil has predominantly shown the growth of the elderly population. Consequently,
there is an increase in the incidence of diseases which are characteristic of this risk group. Efforts have been applied in the
prevention and diagnosis of these illnesses.
         According to the World Health Organization (2012) breast cancer is the fifth leading cause of death from cancer in
general and the most common among women worldwide. In Brazil, 57,120 new cases of breast cancer were estimated in 2014,
which represents the leading cause of death from cancer in the Brazilian female population, with 12.10 deaths for 100,000 women
(INCA, 2014). These numbers increased in 2018, totaling 59,700 new cases and corresponding to 29.5% of the total number of
cancers diagnosed in women (INCA, 2018).
         Unlike other diseases, there is no known way to prevent breast cancer, leaving only early diagnosis for cure or treatment,
prolonging the patient's life. For this, there are several techniques for detection and evaluation of breast cancer.
         Breast cancer can be defined as an exaggerated multiplication of malignant epithelial cells that line the ducts or lobes
of the breast. Breast neoplasm is a clonal disease, where a single modified cell is capable of express all its malignant potential
(Kasper et al., 2016). Early diagnosis is of paramount importance, because from it starts the most appropriate and effective
treatment increasing the patient's life expectancy. It is also important to be aware of the disease, how it behaves, and each of its
stages, from diagnostic tests to treatment.
         Efforts have been applied to the development of new equipment and methods, capable of providing early diagnosis of
breast cancer. There has been great advances with computer-aided detection (Computer-Aided Detection - CAD), providing an
increase in image quality and consequently in diagnostic sensitivity, up to 21%. As a result, there was a decrease in false positives
and false negatives in the diagnoses made (Calas, 2012).
         A little over 100 years after the discovery of the first method of obtaining non-invasive images of the interior of the
human body, diagnostic medicine is undergoing an equally profound and transformative revolution. There was phenomenal
increase in digital, computer-based techniques that seek to treat imaging as a complex problem mathematician (Sabbatini, 1999).
         The image’s quality can be understood as a mammographic image with optical densities perceptible to the human eye
and good visualization of relevant tissues for a safe diagnosis, influenced by breast density, radiographic technique, location of
the lesion, characteristics of malignancy and fatigue of the radiologist (Villar et al., 2015).
         Unfortunately, most investments have been made by the private sector. Consequently, access to a more accurate
diagnosis is available for a small portion of the population. For the public health system, predominantly the use of the least
expensive resources that consequently present flaws and inaccuracies in the diagnosis.
         According to Alvares and Michell (2003), diagnostic imaging methods such as mammography, ultrasound and
scintigraphy are essential tests in the diagnosis of breast cancer and in the follow-up after the surgical procedure, however, all
of them have specific limitations.
         The PET-CT (Positron Emission Tomography – Computed Tomography) is a revolutionary technique for cancer
diagnosis. To perform an examination with PET-CT, a radiopharmaceutical is injected intravenously to identify changes that
occur in cell metabolism.

                                                                  2
Research, Society and Development, v. 10, n. 9, e24410917229, 2021
(CC BY 4.0) | ISSN 2525-3409 | DOI: http://dx.doi.org/10.33448/rsd-v10i9.17229
Of the existing technologies analyzed in this work, the device with the greatest accuracy in diagnosis is the PET-CT.
For this reason, it was chosen to be compared with the diagnoses generated by the Ionizographic Detector. PET-CT overlays
metabolic images generated by PET with the anatomical images generated by the tomograph, enabling identify the shape and
malignancy of the tumor. However, an exam with this device costs, on average, a thousand dollars. With the use of ultrasound,
a more affordable exam, it is possible to observe the anatomical images of the tumor, however without the possibility of
differential diagnosis of malignancy.
As a result, it is easy to imagine the difficulty of the less favored population in having access to the necessary diagnostic
tests. There is a limitation of the Health Unic System (SUS) in offering this type of examination, as well as the resistance of
health care plans in authorizing the procedure for the insured.
In December 2014 the Ministry of Health published Ordinance Nº 1340 incorporating PET-CT to the SUS for the
following tumors: potentially resectable non-small cell lung; metastasis exclusively from colorectal cancer; and for the staging
and evaluation of the response to treatment of Hodgkin's and non-Hodgkin's lymphomas. Before the publication of this ordinance,
the PET-CT was carried out through judicializations.
One trend is the combination of the Ionizographic Detector with the Ultrasound device. With that we will have
morphological data (Ultrasound) and metabolic data (Ionizographic Detector) enabling the study of shape and malignancy of the
nodule under study with the combination of two technologies that are very affordable in terms of acquisition costs and
examination with these gadgets.
As it is a relatively simple equipment, it does not need photomultipliers or robust electronics inside a “gantry” (patient
positioning tunnel), as occurs with other devices being used with this goal. The Ionizographic Detector is being developed in a
small size, malleable and with a low cost when compared with products that provide metabolic data.
The Ionizographic Detector makes images with “count rates per second”, it’s not necessary to wait that the entire image
has a good counting statistics to finish the exam, when an ionization cell encounters a standard it stops counting at the end of the
exam. Thus, enabling a whole body detection where the exam would end in a few seconds instead of several minutes as with the
today’s scintigraphy.
With this advance, there is the possibility of connecting nuclear medicine with other areas of imaging such as endoscopy
for example. It would also make it possible to detect the sentinel lymph node (malignant tumor) visually, allowing a more safe
approach to the lymph node of the internal mammary chain by the mastologist increasing the sensitivity and detectability of
breast cancer.
The present study aims to characterize an invention called Ionizographic Detector for acquisition of metabolic data of
breast nodules. To prove its effectiveness, a comparison was made between exams performed with PET-CT and the Ionizographic
Detector. The Ionizographic Detector presents a significant reduction in the costs involved in the manufacture of the device,
providing accessibility and efficiency, contributing to change the current scenario in breast cancer diagnosis.
Table 1 presents a summary of the analyzed technologies, with their respective advantages and disadvantages.
3Research, Society and Development, v. 10, n. 9, e24410917229, 2021
(CC BY 4.0) | ISSN 2525-3409 | DOI: http://dx.doi.org/10.33448/rsd-v10i9.17229
Table 1 – Comparative.
Technology Advantages Disadvantages
Mammography Low cost. Morphological assessment only.
Satisfactory sensitivity most evident in Difficulties in screening dense breasts, post-
breast cancer cases in initial stages. surgical breast changes and breast implants.
Ultrasound Important role as a complementary exam to Morphological assessment only.
mammography and clinical examination. Difficulties in differentiating the malignant or
benign caracteristics as well as in identifying
lesions smaller than 1cm.
Magnetic Evaluates the size and morphological features High cost, long exam time and its
Resonance that are characteristics of the tumor. contraindications.
PET-RM and PET- Metabolic images, overlay with natomical
CT images of cancer under analysis. High cost.
Detector Metabolic Images. Does not show morphological images.
Ionizographic Low cost.
Source: Authors.
2. Methodology
The research is qualitative, as it has an exploratory character, studying individual experiences. Qualitative methods are
those in which the researcher's interpretation is important with their opinions on the phenomenon under study (Pereira et al.,
2018).
Three (3) patients who presented breast nodule(s) documented by histopathology were examined in the Ionizographic
Detector. They were firstly submitted to PET-CT examination, where a radiopharmaceutical known as contrast was injected
intravenously into the patient. Contrast is a radioactive material, usually the Fluordeoxyglucose (FDG), a radioisotope of fluorine
mixed with glucose. Its formula is C₆H₁₁¹⁸FO₅.
Malignant breast nodules, unlike benign breasts, absorb a lot of glucose. In this way, it was possible identify where a
greater emission of radiation occurred and the consequent diagnosis of the malignant nodule(s) was made. During the exam with
the Ionizographic Detector, when there is the presence of radiation, an ionization process occurs. The injected radioactive
material in the patient releases gamma rays and causes ionization in the Geiger Muller sensors. This described process is
converted into energy and the detections per second are measured.
The Ionizographic Detector exam is peformed with the patient taken to a room containing a
Ultrasound. A gown with a front opening was provided. Then, the patient was placed in the supine position, with the upper limbs
raised at a 90 degree angle.
Initially, with the ultrasound device, the nodule(s) was located and five marks were made in the patients with a brush
as shown in the graphic representation in Figure 1. One central mark, where it was the morphological analysis from the
Ultrasound and four other markings, two above and another two below the initial marking, spaced 5 (five) centimeters apart
longitudinally. This step is justified by the need to compare radiation captures per second not only in the nodule region where
there is greater emission of radiation, but also from areas with lower incidence to prove the efficiency of the device's capture.
4Research, Society and Development, v. 10, n. 9, e24410917229, 2021
(CC BY 4.0) | ISSN 2525-3409 | DOI: http://dx.doi.org/10.33448/rsd-v10i9.17229
Figure 1 - Patient markings
Source: Authors.
The Collimator is a casing made in a 3D printer. Internally it stores 2 (two) Geiger sensors and is filled with lead. Lead
is used to shield and prevent sensors from suffering spurious interference, so the capture is well targeted.
In each marking, the collimator is positioned and 20 (twenty) readings are registered in each position of the markings.
The result corresponds to the average of the sum of these captures, which in turn is carried out in triplicate, enabling a most
significant sample for analysis.
Related to the data collected at each collimator position, the fluorine activity present in the radiopharmaceutical
decreases per unit of time, due to the release of photons and emission at random, that is, positrons are emitted in several directions,
being estimated the quantity of 20 (twenty) readings to capture in each position. Fluoride activity is measured in Curie (Ci),
where it represents the amount of decay per unit of time, that is, the unit in which an amount of radioactive material, 3.7x10¹⁰
nuclei disintegrate in every second.
Probe Detector software was used to present the received signal capture in real time. The software transforms the
received signal into bars, representing each one of the sensors, it also makes the sum of the captures and totals it in a report.
With the data from the captures, an analysis was performed and a comparison with the results obtained in PET-CT. In
order to compare the results, since PET-CT is a reference in the diagnosis of malignancy of breast nodules.
3. Results and Discussion
The results obtained in the comparison between PET-CT and the Ionizographic Detector are presented in the following
figures. The graphs referring to the results of the exams made in the Ionizographic Detector are plotted on the X axis with the
numbering from 1 (one) to 5 (five) that corresponds to each position marked on the patient. The Y axis contains the amount of
captures, as described in the methodology.
The bars in blue color indicate sensor 1 of the Ionizographic Detector, which corresponds to a possibility of variation
from 0 (zero) to 250 (two hundred and fifty) captures per second. The bars in orange color correspond to sensor 2 of the Detector.
All graphs correspond to the comparative results obtained in triplicate. The triplicate was generated from 3 (three)
patients undergoing examination with the Ionizographic Detector. These patients, following all the aforementioned methodology,
were examined in January, February and March 2021. They were initially submitted to PET-CT and then to the Ionizographic
Detector.
5Research, Society and Development, v. 10, n. 9, e24410917229, 2021
(CC BY 4.0) | ISSN 2525-3409 | DOI: http://dx.doi.org/10.33448/rsd-v10i9.17229
Figure 2 contains two images and an overlay of metabolic and morphological data obtained from the examination of
the patient 1 obtained by PET-CT. The image generated by the positron emission tomography exam presents areas of greater
glucose metabolism and consequently of greater radiation uptake due to the radiopharmaceutical, showing darker regions, as can
be seen in Figure 2 (a). The image of the test result of computed tomography shown in Figure 2 (b) shows the shape, ie,
morphological features in the nodule. The image shown in Figure 2 (c) was obtained via fusion of the above-mentioned images
from the PET-CT exam.
Patient 1, when undergoing PET-CT examination, presented a nodule in the left breast, as indicated in Figure 2(c). In
the image overlay, dots with more intense color can be seen, representing areas of glycolytic hypermetabolism in multiple
cervical vertebral bodies.
Figure 2 – Patient 1 (a) Positron emission tomography (b) Computed tomography (c) Overlay of (a) + (b) data metabolic and
morphological
Source: Authors.
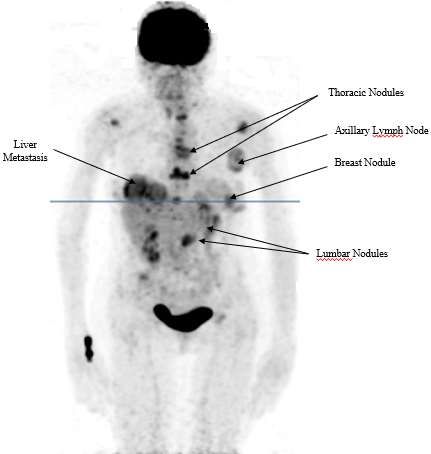
Figure 3 contains an image generated in the Maximum Intensity Projection (MPI) format obtained via PET. One
hypermetabolic lymph node enlargement in the left axilla can be seen in this figure. A hypermetabolic nodule in the left breast
compatible with a primary referred tumor. Thoracic and lumbar nodules can also be seen.
6Research, Society and Development, v. 10, n. 9, e24410917229, 2021
(CC BY 4.0) | ISSN 2525-3409 | DOI: http://dx.doi.org/10.33448/rsd-v10i9.17229
Figure 3 - Image - Maximum Intensity Projection (MPI).
Source: Authors.
Figure 4 refers to the image obtained from the ultrasound exam where it is possible to verify the nodule's shape. This is
the starting point for the marking procedure made on the patient.
Figure 4 - Patient 1 – Ultrasound Image.
Source: Authors.
Figure 5 contains a graph with results from patient 1 regarding the examination in the Ionizographic Detector in the left
breast. On the X axis, the five collimator positions on the patient are shown, with the indication of the first bar referring to sensor
1 and the second one referring to sensor 2. On the Y-axis, the possible variations of captures are presented.
The first reading demonstrated 176 captures per second on sensor 1 and 13 on sensor 2. This is explained by the presence
of an axillary lymph node confirmed by the PET-CT examination. The second position shows a drop in captures, 113 captures
were recorded in sensor 1 and no capture in sensor 2. In the third position, where the nodule was marked from the analysis with
the ultrasound device, was detected an increase of more than 100% in the capture of sensor 1, sensor 2 remained without
7Research, Society and Development, v. 10, n. 9, e24410917229, 2021
(CC BY 4.0) | ISSN 2525-3409 | DOI: http://dx.doi.org/10.33448/rsd-v10i9.17229
recordings. In the fourth position the reading corresponds to the second position. In the fifth reading, there were 50 captures per
second on sensor 1 and 25 on sensor 2.
Figure 5 - Patient 1 - Captures per Second (ME).
Patient 1 - Left Breast
250
227
200
176
150
CAPTURES
113 113
SENSOR 1
100 SENSOR 2
50
50
25
13
0 0 0
0
1 2 3 4 5
POSITIONS
Source: Authors.
Figure 6 contains the results of the exam performed with the Ionizographic Detector in the right breast. 75 captures
per second were identified by sensor 1 and no capture by sensor 2 in the recording taken in the first position. There was a drop
in the uptake of sensor 1 and an increase in the uptake of sensor 2 in the second position. On the third position, the two sensors
showed an increase and recorded 63 captures per second. On the fourth reading, sensor one increased its capture to 101 and
sensor 2 had a drop in captures to 38. And in the last position there was an increase to 125 captures per second in sensor 1 and
drop in sensor 2 to 25 captures. This increase in uptake by sensor 1 is justified by the fact that the patient has a nodule in the
liver, as seen in the PET-CT exam. In this way, as the positions move closer to the liver, uptakes increase.
8Research, Society and Development, v. 10, n. 9, e24410917229, 2021
(CC BY 4.0) | ISSN 2525-3409 | DOI: http://dx.doi.org/10.33448/rsd-v10i9.17229
Figure 6 - Patient 1 - Captures per Second (MD).
Patient 1 - Right Breast
250
227
200
176
CAPTURES
150
113 113
SENSOR 1
100 SENSOR 2
50
50
25
13
0 0 0
0
1 2 3 4 5
POSITIONS
Source: Authors.
Figure 7 contains a Maximum Intensity Projection (MIP) image obtained from patient 2 via PET-CT scan. A nodule in
the left breast can be seen in this figure, with an active primary tumor in addition to axillary and left subpectoral lymph node
enlargement compatible with active secondary implants. No other areas of abnormal accumulation of the radiopharmaceutical
by the patient's body were found.
PET-CT performed with a specific protocol for breast assessment showed good sensitivity and presented association
with important histological/immunohistochemical factors related to aggressiveness and prognosis of breast carcinomas
(Bitencourt et. al., 2014).
9Research, Society and Development, v. 10, n. 9, e24410917229, 2021
(CC BY 4.0) | ISSN 2525-3409 | DOI: http://dx.doi.org/10.33448/rsd-v10i9.17229
Figure 7 - Patient 2 - Maximum Intensity Projection (MPI).
Source: Authors.
The examination with the Ionizographic Detector, initially performed on the left breast of patient 2, captured a
hypermetabolism at the first reading, according to the graph in the Figure 8 where sensor 1 presented 100 and sensor 2 recorded
50. In the second position, there was no record of radiation. On the third reading, there was another point of hypermetabolism,
with the first sensor detecting 126 uptakes and the second 50. On the fourth reading, sensor 1 registered a recording of 50 and
sensor 2 did not pick up radiation. And in the last reading, there was again a radiation capture by the sensors, 75 from sensor 1
and 100 from sensor 2.
10Research, Society and Development, v. 10, n. 9, e24410917229, 2021
(CC BY 4.0) | ISSN 2525-3409 | DOI: http://dx.doi.org/10.33448/rsd-v10i9.17229
Figure 8 - Patient 2 - Captures per Second (ME).
Patient 2 - Left Breast
250
200
150
CAPTURES
126
100 100 SENSOR 1
100 SENSOR 2
75
50 50 50
50
0 0 0
0
1 2 3 4 5
POSITIONS
Source: Authors.
It can be seen that there are hyper-uptake regions of glucose, identified in the darkest region at the region of the thorax
of the patient 2, proving the existence of an axillary lymph node enlargement as shown in Figure 6. That’s the reason why the
first reading showed hypermetabolism, that is, a higher consumption of glucose and, consequently, a region with greater radiation
regions. In the other readings, recordings of uptake were presented, where is observed a left breast nodule.
From the data collected at the examination of the patient's right breast, there were zero or very low uptakes. Considering
these small fluctuations as spurious data. Therefore, concluding that there are no malignant nodules.
The result shown in Figure 9 refers to patient 3 when undergoing the PET-CT examination, overlapping morphological
and metabolic images. The staging for Cancer Antigen (Cancer Antigen – CA) was observed, that is, a discrete uptake in a left
breast nodule compatible with a primary tumor was seen.
Figure 9 - Overlay of morphological and metabolic images.
Source: Authors.
11Research, Society and Development, v. 10, n. 9, e24410917229, 2021
(CC BY 4.0) | ISSN 2525-3409 | DOI: http://dx.doi.org/10.33448/rsd-v10i9.17229
The patient reported that she had undergone two sessions of chemotherapy. That’s the reason for, although already with
a malignant nodules diagnosis, have presented this result.
The result shown in figure 10 contains a graph of the test results carried out with the Detector Ionizography on the left
breast of the patient 3 where it can be seen that a subtle uptake occurred in the third point marked as the location of the nodule.
The captures started with zero on sensor 1 and 50 on sensor 2. Right on the second reading there was a capture of 75 in sensor 1
and none in sensor 2. In the third position, a recording with the highest capture was noted, which was 126 by sensor 1 and 50 by
sensor 2. In the fourth reading, a decrease was presented, that is, the sensor 1 recorded 25 captures and sensor 2 none. And
finally, in the fifth position, no capture was registered.
It can be seen that it is compatible with that presented by the PET-CT exam in the left breast, as shown in Figure 8
where there is an over-uptake in the third reading, that is, point identified with the Ultrasound being from the nodule. The result
presented by the Ionizographic Detector in the patient's right breast was satisfactory. With very low uptakes or none recorded in
the positions marked on the patient. Corresponding to the diagnosis presented by the PET-CT exam.
Figure 10 - Patient 3 - Captures per Second (ME).
Patient 3 - Left Breast
250
200
CAPTURES
150
126
SENSOR 1
100
75 SENSOR 2
50 50
50
25
0 0 0 0 0
0
1 2 3 4 5
POSITIONS
Source: Authors.
4. Conclusion
After analyzing the results, it is possible to conclude the reduction in the number of markings depending on the point
of interest caused it was already visualized on ultrasound. The other readings are merely for checking the equipment's calibration.
For the other exams, three marking procedures will be made instead of five. The equipment will be parameterized to no longer
take 20 readings at each marking (position), 40 will be made, with the intention of obtaining a larger sample of captures,
consequently, more representative recording, since the emission of positrons is random.
With the analysis of the experiment, we can conclude that the record of 50 captures in a given position previously
marked in the patient, may be disregarded, as they represent a base average of the circulating radiopharmaceutical in the patient.
Taking into account higher recording, according to the graphs presented in the survey, associated with the diagnoses generated
with the PET-CT exams.
12Research, Society and Development, v. 10, n. 9, e24410917229, 2021
(CC BY 4.0) | ISSN 2525-3409 | DOI: http://dx.doi.org/10.33448/rsd-v10i9.17229
From the results obtained through the performance of the three exams described in this publication, it is possible to
observe the correspondence in 100% of the diagnoses of the exams performed in PET-CT and in the Ionizographic Detector. All
hypermetabolic uptakes recorded outside the region marked by the breast nodule, were justified by the existence of other
capturing elements in the patient's body. As for example what happened in patient 2, where the Detector Ionizography captured
the metabolic information of the left breast nodule, as well as the high metabolism corresponding to the presence of a lymph
node enlargement in the left axilla and liver lesions.
In the analysis of the most relevant technologies for detecting breast nodules, we concluded that the methodologies
available when they present satisfactory results, are expensive and inaccessible for the majority of the population. The most
accessible are less accurate in such detection. The Ionizographic Detector has advantages in terms of metabolic information
accuracy as efficient as PET scans, with a very affordable cost when compared to other technologies. But as a disadvantage, it
does not capture morphological information, as does PET.
With the proof of the effectiveness of the Ionizographic Detector, a natural consequence, as happened with the PET-CT
and PET-RM, is the hybridization of the technologies, already mentioned above. Enabling to associate metabolic with
morphological data. Accurate diagnosis of breast nodules will be more accessible, enabling early diagnosis or even a better
staging for the patient affected by this disease. As an inevitable consequence, which occurred with all equipment analyzed in
this publication, an evolution of the device so that it can increasingly keep up with advances and needs of this specialty of
medicine.
As a suggestion for future work, further experiments with the Ionizographic Detector should be carried out. Not only in
breast examination, but in analyzing thyroid nodules and assessing kidney function. This makes it possible to prove not only the
effectiveness in diagnosing the invention, but also its diversity of applications.
References
Alvares, B. R., & Michell, M. (2003). O uso da ressonância magnética na investigação do câncer mamário. Radiologia
Brasileira, 36(6), 373-378.
Silva, P. A. D., & Riul, S. D. S. (2011). Câncer de mama: fatores de risco e detecção precoce. Revista Brasileira de Enfermagem, 64(6), 1016-1021.
Barra, F. R., Barra, R. R., & Barra Sobrinho, A. (2012). Novos métodos funcionais na avaliação de lesões mamárias. Radiologia Brasileira, 45(6), 340-344.
Bitencourt, A. G. V., Lima, E. N. P., Chojniak, R., Marques, E. F., Souza, J. A. D., Graziano, L., & Osório, C. A. B. D. T. (2014). Correlação entre resultado do
PET-CT e achados histológicos e imuno-histoquímicos em carcinomas mamários. Radiologia Brasileira, 47(2), 67-73.
Boylestad, R. (2013). Dispositivos Eletrônicos e Teoria de Circuitos-11a.
Brasil. Ministério da Saúde, Secretaria de Atenção à Saúde, Instituto Nacional de Câncer (2006). Controle do Câncer de Mama: documento de consenso. Rio de
Janeiro.
Calas, M. J. G., Koch, H. A., & Dutra, M. V. P. (2007). Ultra-sonografia mamária: avaliação dos critérios ecográficos na diferenciação das lesões
mamárias. Radiologia Brasileira, 40(1), 1-7.
Calas, M. J. G., Gutfilen, B., & Pereira, W. C. D. A. (2012). CAD e mamografia: por que usar esta ferramenta? Radiologia Brasileira, 45(1), 46-52.
Camargo, E. E. (2005). Experiência inicial com PET/CT. Radiologia Brasileira, 38(1), 0-0.
Chala, L. F., & Barros, N. D. (2007). Avaliação das mamas com métodos de imagem. Radiologia Brasileira, 40(1), 4-6.
Jales, R. M., Marussi, E. F., Andrade, K. C. D., & Derchain, S. F. M. (2005). Desempenho da ultra-sonografia na detecção das metástases em linfonodos axilares
em mulheres com câncer de mama. Revista Brasileira de Ginecologia e Obstetrícia, 27(9), 534-540.
Johnson, D. E., Hilburn, J. L., & Johnson, J. R. (1994). Fundamentos de análise de circuitos elétricos. Livros Tecnicos e Cientificos.
Kasper, D. L. et al. Medicina Interna de Harrison. (2016) (19a ed.), AMGH Editora LTDA.
Machado, A. C. B., Pleitez, V., & Tijero, M. C. (2006). Usando a antimatéria na medicina moderna. Revista Brasileira de Ensino de Física, 28(4),
407-416.
Nascimento, J. H. R. D., Silva, V. D. D., & Maciel, A. C. (2009). Acurácia dos achados ultrassonográficos do câncer de mama: correlação da
13Research, Society and Development, v. 10, n. 9, e24410917229, 2021
(CC BY 4.0) | ISSN 2525-3409 | DOI: http://dx.doi.org/10.33448/rsd-v10i9.17229
classificação BI-RADS® e achados histológicos. Radiologia Brasileira, 42(4), 235-240.
Nascimento, F. B. D., Pitta, M. G. D. R., & Rêgo, M. J. B. D. M. (2015). Análise dos principais métodos de diagnóstico de câncer de mama como
propulsores no processo inovativo. Arquivos de medicina, 29(6), 153-159.
Nastri, C. O., Martins, W. D. P., & Lenharte, R. D. J. (2011). Ultrassonografia no rastreamento do câncer de mama. Femina, 97-102.
Nilsson, J. W. & Riedel, Susan A. Circuitos Elétricos. (2015) (10a ed.), Person Education do Brasil.
Sabbatini, R. M. E. (1999) Uma Revolução Feita de Imagens. Chek-Up.
Silva, J. M., Marques, M. A., Moraes, E. C., & Melo, H. J. F. Tomografia Por Emissão De Pósitrons/Ressonância Magnética Na Avaliação Do Câncer De
Mama.
Souza, A. R. D., Paixão, A. C., Uzêda, D. D., Dias, M. A., Duarte, S., & Amorim, H. S. D. (2011). A placa Arduino: uma opção de baixo custo para
experiências de física assistidas pelo PC. Revista Brasileira de Ensino de Física, 33(1), 01-05.
Pereira, A. S., Shitsuka, D. M., Parreira, F. J., & Shitsuka, R. (2018). Metodologia da Pesquisa Científica-Licenciatura.
Pereira, M. R., Santos, A., & Sakae, T. M. (2010). Escore thrombolysis in myocardial infarction para avaliação de risco em síndrome coronariana
aguda em hospital particular no Sul do Brasil. Rev Bras Clin Med, 8(4), 311-5.
Villar, V. C. F. L., De Seta, M. H., Andrade, C. L. T. D., Delamarque, E. V., & Azevedo, A. C. P. D. (2015). Evolution of mammographic image
quality in the state of Rio de Janeiro. Radiologia brasileira, 48(2), 86-92.
, 48(2), 86-92.
14You can also read