Target Detection Using Ternary Classification During a Rapid Serial Visual Presentation Task Using Magnetoencephalography Data - Frontiers
←
→
Page content transcription
If your browser does not render page correctly, please read the page content below
ORIGINAL RESEARCH
                                                                                                                                            published: 26 February 2021
                                                                                                                                      doi: 10.3389/fncom.2021.619508

                                           Target Detection Using Ternary
                                           Classification During a Rapid Serial
                                           Visual Presentation Task Using
                                           Magnetoencephalography Data
                                           Chuncheng Zhang 1 , Shuang Qiu 1 , Shengpei Wang 1 and Huiguang He 1,2,3*
                                           1
                                            National Laboratory of Pattern Recognition and Research Center for Brain-Inspired Intelligence, Institute of Automation,
                                           Chinese Academy of Sciences, Beijing, China, 2 School of Artificial Intelligence, University of Chinese Academy of Sciences,
                                           Beijing, China, 3 Center for Excellence in Brain Science and Intelligence Technology, Chinese Academy of Sciences, Beijing,
                                           China

                                           Background: The rapid serial visual presentation (RSVP) paradigm is a high-speed
                                           paradigm of brain–computer interface (BCI) applications. The target stimuli evoke
                                           event-related potential (ERP) activity of odd-ball effect, which can be used to detect
                                           the onsets of targets. Thus, the neural control can be produced by identifying the
                                           target stimulus. However, the ERPs in single trials vary in latency and length, which
                                           makes it difficult to accurately discriminate the targets against their neighbors, the
                                           near-non-targets. Thus, it reduces the efficiency of the BCI paradigm.
                                           Methods: To overcome the difficulty of ERP detection against their neighbors, we
                                           proposed a simple but novel ternary classification method to train the classifiers. The
                                           new method not only distinguished the target against all other samples but also further
                          Edited by:
                            Ke Zhou,       separated the target, near-non-target, and other, far-non-target samples. To verify the
      Beijing Normal University, China     efficiency of the new method, we performed the RSVP experiment. The natural scene
                       Reviewed by:        pictures with or without pedestrians were used; the ones with pedestrians were used
                              Jing Jin,
 East China University of Science and
                                           as targets. Magnetoencephalography (MEG) data of 10 subjects were acquired during
                   Technology, China       presentation. The SVM and CNN in EEGNet architecture classifiers were used to detect
                              Wei Wei,
                                           the onsets of target.
   Xi’an Polytechnic University, China

                  *Correspondence:         Results: We obtained fairly high target detection scores using SVM and EEGNet
                        Huiguang He        classifiers based on MEG data. The proposed ternary classification method showed
                huiguang.he@ia.ac.cn
                                           that the near-non-target samples can be discriminated from others, and the separation
         Received: 20 October 2020         significantly increased the ERP detection scores in the EEGNet classifier. Moreover, the
         Accepted: 20 January 2021         visualization of the new method suggested the different underling of SVM and EEGNet
        Published: 26 February 2021
                                           classifiers in ERP detection of the RSVP experiment.
                             Citation:
   Zhang C, Qiu S, Wang S and He H         Conclusion: In the RSVP experiment, the near-non-target samples contain separable
(2021) Target Detection Using Ternary      ERP activity. The ERP detection scores can be increased using classifiers of the EEGNet
   Classification During a Rapid Serial
        Visual Presentation Task Using     model, by separating the non-target into near- and far-targets based on their delay
      Magnetoencephalography Data.         against targets.
Front. Comput. Neurosci. 15:619508.
    doi: 10.3389/fncom.2021.619508         Keywords: RSVP, ERP, MEG, CNN, SVM

Frontiers in Computational Neuroscience | www.frontiersin.org                     1                                         February 2021 | Volume 15 | Article 619508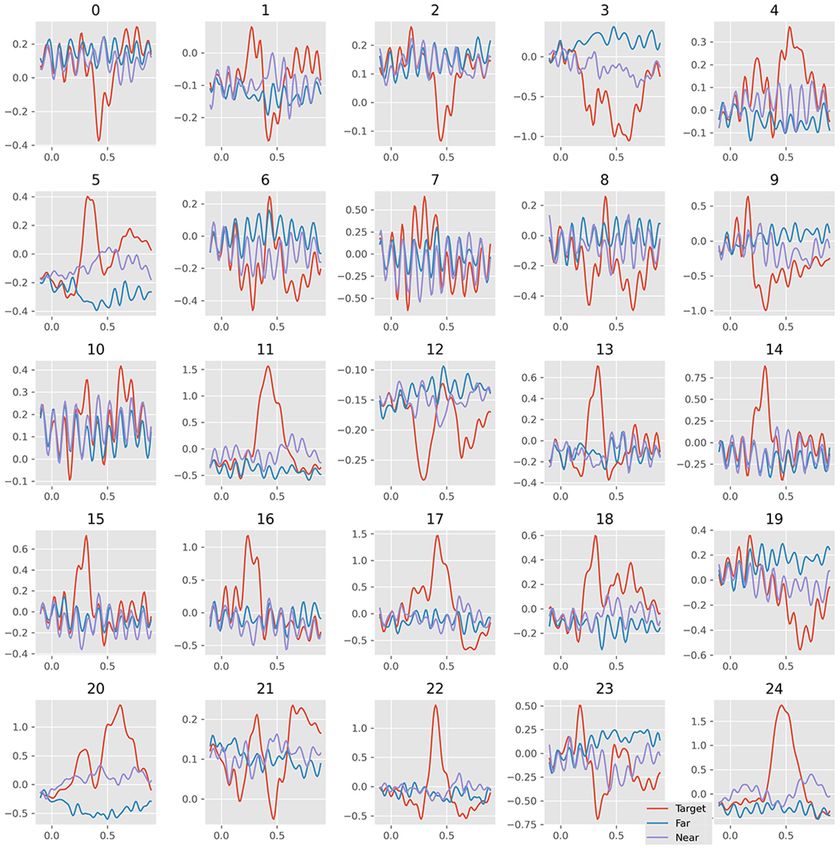
Zhang et al.                                                                                                 Ternary-classification of RSVP Using MEG

INTRODUCTION                                                                RSVP BCI application; however, it still left the difficulty of single
                                                                            sample ERP detection problem unsolved, which is important to
Rapid serial visual presentation (RSVP) is a high-speed brain–              common RSVP applications.
computer interface (BCI) experiment paradigm. In the rapid                      One of the main difficulties of ERP detection using a single
presented sequences, the odd-ball pictures can trigger the                  trial is their complex dynamics (Barry and De Blasio, 2018), since
unique event-related potential (ERP) activity, known as P300                they vary in latency and length across trials. The high-speed
visual-evoked potentials in the brain (Won et al., 2019).                   presented stimulus in the RSVP paradigm makes the stimulus
This neural signal is generally chosen from a variety of                    closer with each other and the difference more ambiguous in
well-studied non-invasive electroencephalography (EEG) and                  temporal. Evenly, the presentation speed is becoming so fast that
magnetoencephalography (MEG) signals (Lawhern et al., 2018).                the ERP reaches its peak after the next stimuli onset, when the
The detection of ERP onsets can be used to identify the pictures of         presentation rate is larger than 30 Hz. Thus, detecting the target
interest in the sequence (Helfrich and Knight, 2019). As a result,          samples against their neighbors is becoming more difficult and
the RSVP paradigm has been used in multiple BCI applications,               produces a higher error rate on the single-trial ERP detection.
e.g., picture identification, screen spellers, and other applications           In this study, we presented an RSVP experiment with MEG
that require identifying target stimulus at high speed.                     data acquired. The visual material is natural scene pictures
   The applications of RSVP in BCI largely depend on the                    with or without pedestrians, and the pictures with pedestrians
ERP detection accuracy. The machine learning methods have                   were used as target pictures. We used a new training method
been widely used in ERP detection using the noisy single                    to increase the ERP detection scores. In the new method, the
sample signals (Huang et al., 2011; Cecotti, 2016; Lin et al.,              samples were separated into three classes instead of two classes
2017). Machine learning algorithm formulates the classifier                 in the traditional method. They are target, near-non-target, and
to learn the ERP pattern in the high-dimensional neural                     far-non-target samples. Thus, we used the classifier not only
signal, and automatically suppress the effect of noise. The                 discriminating the target and other samples but also learning
xdawn algorithm was used to enhance ERP components in the                   the difference between target samples and their neighbors. The
EEG and MEG data. Support vector machine (SVM), linear                      SVM and CNN in EEGNet architecture classifiers were trained
discriminator (Cecotti, 2016), and convolution neural network               to detect ERP based on MEG data. The experiment results
(CNN) classifiers (Lawhern et al., 2018) have been applied to               showed that the new training method improved ERP detection
ERP detection tasks (Xiao et al., 2020). The weighted linear                scores of the EEGNet classifier. The visualization results further
discriminant analysis has been used to reduce calibration time              explained the different underling of ERP detection of SVM and
in the P300-based BCI paradigm; it not only reduces the                     EEGNet classifiers.
computation request but also reduces the fatigue of subjects
prior to BCI experiment (Jin et al., 2020b). Further, optimal
                                                                            MATERIALS AND METHODS
feature selection method of common spatial pattern using L1-
norm and Dempster–Shafer theory has been used in the EEG                    Visual Stimuli and Procedure
dataset to improve the robust against the non-stationary across             The participants were seated in the MEG scanner, and a screen
time and subjects (Jin et al., 2020c). Despite the improvements in          was in front at 680 mm. During the MEG scanning, they were
algorithm, it is still difficult to obtain the reliable ERP waveform        required to gaze on the center of the screen. The rapid visual
from a single trial since the signal-to-noise rate is large in neural       stimuli were presented on the screen using a rapid flashed
signal (Creel, 2019).                                                       sequence of pictures. The picture size was 500 × 500 pixels2
   Besides the algorithm improvement, the paradigm of RSVP                  covering 150 × 150 mm2 areas in the screen; thus, it subtended
experiments also evolved. Jin et al. has developed a novel cheeks-          the area of 12.6 × 12.6 degrees2 in visual angle. The flash rate of
stim paradigm for the P300 BCI experiment to substantially                  pictures was set as 10 Hz, and there were no gaps between two
increase the efficiency and experience of BCI users (Lin et al.,            consecutive pictures.
2018; Jin et al., 2020a). Indeed, the reliable ERP can be obtained             All the pictures were selected from a dataset consisting of
by averaging the waveform of several ERP trials, and there are              1,400 colored street scene pictures. The pictures containing
RSVP paradigm improvements using the averaged multiple trials               pedestrians were used as target pictures, and others were used
to increase the accuracy of ERP detection. Lin et al. developed a           as non-target pictures. There were 56 target pictures and 1,344
novel triple RSVP paradigm for the P300 BCI speller. It presented           non-target pictures in the dataset.
three single target character stimuli three times and uses the                 During a block, 100 pictures were shown in random order.
averaged signal to increase ERP detection accuracy (Lin et al.,             The ratio of target pictures was set to 4%, resulting in 100 pictures
2018). Cecotti et al. used the dual-RSVP paradigm. The sequence             with 4 target pictures and 96 non-target pictures. In every block,
was presented synchronously with a fixed lag, and the succeeding            the 100 pictures were randomly sampled from the dataset without
two signals were used to increase the ERP detection accuracy                replacement. As a result, one session contained 14 blocks. During
(Cecotti, 2016). Additionally, the triple-RSVP paradigm has also            a session, the participants were required to press a button in their
been used to acquire higher accuracy (Mijani et al., 2019). It              right hand when they were ready to start a block and press the
shows that the classifiers took the benefit from the dual sample            same button when they see a target picture as soon as possible.
combination and produced higher detection score. The new                    The aim of asking participants to press the button is to keep
RSVP paradigm designs indeed improved the performance of the                them focused on the screen, and the button-pressing events were

Frontiers in Computational Neuroscience | www.frontiersin.org           2                                   February 2021 | Volume 15 | Article 619508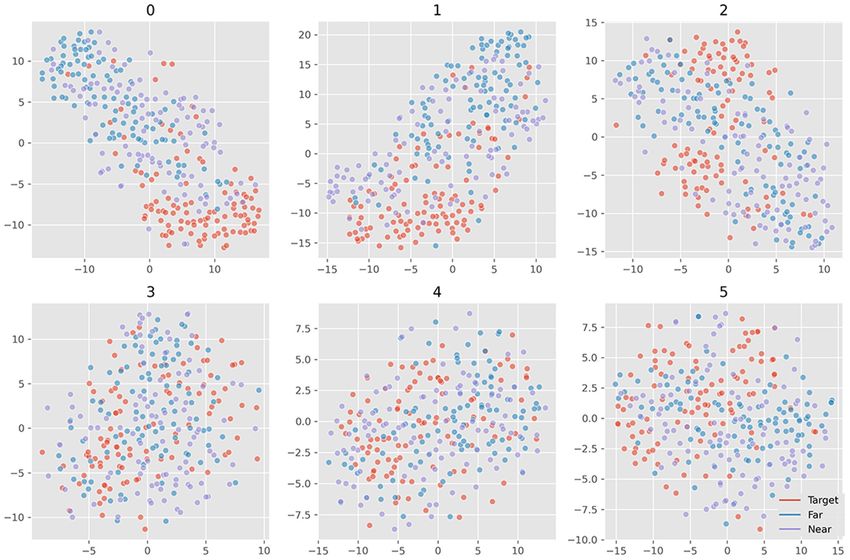
Zhang et al. Ternary-classification of RSVP Using MEG
also recorded to make sure that the participant saw the target ERP-Based Target Detection
pictures instead of missing them. All the participants finished 11 MEG Sample Labeling
consecutive sessions during the RSVP experiment. The paradigm The lag between samples was 100 ms since the presentation rate
of the RSVP experiment can be found in Figure 1. was 10 Hz. However, the length of the samples was 1,400 ms.
Thus, the samples inevitably overlapped with their neighbors.
Participants The traditional ERP detection method used dual classification,
The experiment recruited 10 college students as participants which only separated target and non-target samples, e.g., labeling
in the RSVP experiment (seven males and three females, target epochs as label 1 and non-target epochs as label 2. As
aged 23.79 ± 3.6) without previous training in the a result, they used the same label to represent the non-target
task. The participants practiced through a pseudo-RSVP block samples with or without ERP components. It forced the classifier
immediately before they entered the MEG scanner. The aim was to distinguish the ERP signals against their neighbors, which
only to make sure they had understood the rule of button pressing might contain the same ERP with a small latency. Thus, the
during the experiment. The participants exhibited normal or confusion will inevitably decrease the accuracy of ERP detection.
corrected-to-normal vision with no neurological problems and In this study, we used three classification methods to further
were financially compensated for their participation. The study separate the target signal from their neighbors. Three labels were
was approved by the local ethics committee (Institute of used in the experiment: target label (noted as 1), far-non-target
Automation Chinese Academy of Sciences). All participants label (noted as 2), and near-non-target label (noted as 3). The far-
gave a written informed consent and received payment for non-target samples refer to the epochs whose onset was far from
their participation. target stimulus, which means that there were no target stimuli
occurring within a 0.5-s range. The other non-target epochs were
MEG Acquirement and Preprocessing labeled as near-non-target labels. Simply, the target samples were
During MEG experiment, subjects performed RSVP experiment ERP samples, the near-non-target samples contained ERP but of
in a MEG scanner. MEG recordings were conducted in a incorrect latency, and the far-non-target samples did not contain
magnetically shielded room with a whole-head CTF MEG ERP activity.
system with 272 channels (MISL-CTF DSQ-3500, Vancouver,
BC, Canada) at the MEG Center of Institute of Biophysics, ERP Detection Using SVM
Chinese Academy of Sciences. Prior to data acquisition, three The SVM is a widely used statistical learning algorithm, especially
coils were attached to the left and right pre-auricular points and for large datasets with high dimensionality (Vapnik, 1998).
nasion of each participant, and a head localization procedure It has been reported that SVM outperforms other competing
was performed before and after each acquisition to locate the methods in many researches (Williams, 2003; Pohlmeyer et al.,
participant’s head relative to the coordinate system fixed to the 2011). The SVM has also been used for ERP detection in
MEG system. Participants were asked to lie in a supine position, the RSVP experiment (Huang et al., 2011). Since the SVM
and a projection screen was used to present visual stimuli was originally designed for binary classification, the trinary
during recording. classification method used the one-against-one method that was
MEG data were recorded at a sampling rate of 1, 200 Hz, proposed by Chih-Wei and Chih-Jen (2002) in the “libsvm”
filtered between 0 and 600 Hz. We preprocessed the data using software package.
MNE software (Gramfort et al., 2014). The artificial noise of The prior feature extraction was also necessary for SVM
eye moving was suppressed using ICA method (Dimigen, 2020). classifier. We used signal enhancement with xdawn algorithm
Since ICA is sensitive to low-frequency drifts, the 1-Hz high- (Rivet et al., 2009). The xdawn method was used as a supervised
pass filter was used to suppress low-frequency signal prior to feature extraction method to enhance the ERP components in
ICA fitting. Then, the sources with large skewness, kurtosis, and the MEG data by maximizing the signal-to-signal-plus-noise rate
variance scores were marked and zeroed out from raw data. Then, (Cecotti, 2016). The number of components was set to six in this
the raw data were down-sampled to the sample rate of 100 Hz. study based on prior research and visualization results. Thus, the
The down-sampled data were then filtered by a band-pass filter 272-sensor MEG data were converted into six-component feature
to fetch data in the frequency band of 0.115 Hz. data to fit the SVM classifier.
Data samples were then fetched from the filtered data. For SVM uses RBF kernel to explore more flexible classification
every picture presented in the RSVP experiment, the time strategy for high-dimensional data. In this study, we set the
window ranging from −200 to 1, 200 ms from the onset was used prior parameter gamma as “scale” to automatically calculate the
to fetch the data sample. The samples also referred to the MEG variance of the training data. Since non-target samples were
epochs in some studies. The samples were baseline-corrected by dozen times outnumbered target samples, we set the class-weight
the averaged value between −200 and 0 ms from the onset. The option as “balanced” to increase the weight of target signal in loss
linear drifts were removed from the samples. As a result, the data function to obtain a meaningful classifier.
sample could be represented by a matrix of 272 rows and 140
columns; 272 rows represented 272 channels and 140 columns ERP Detection Using EEGNet
represented 140 time points from −200 to 1,200 ms. The samples EEGNet is an outstanding CNN architecture to detect ERP signal
were then used to detect ERP activity. The averaged time series of in EEG data (Lawhern et al., 2018). In this study, we used
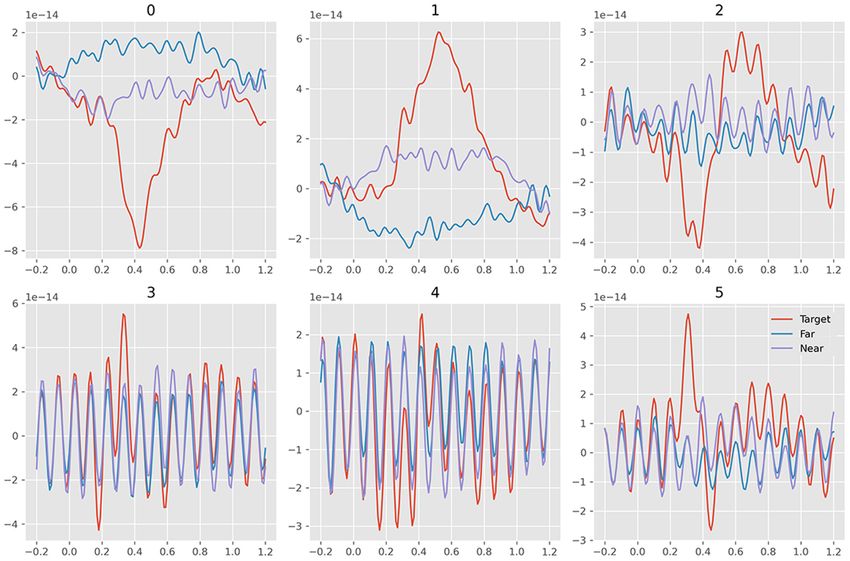
the signals are plotted in Figure 2. EEGNet to detect the ERP signal in MEG data. The EEGNet
Frontiers in Computational Neuroscience | www.frontiersin.org 3 February 2021 | Volume 15 | Article 619508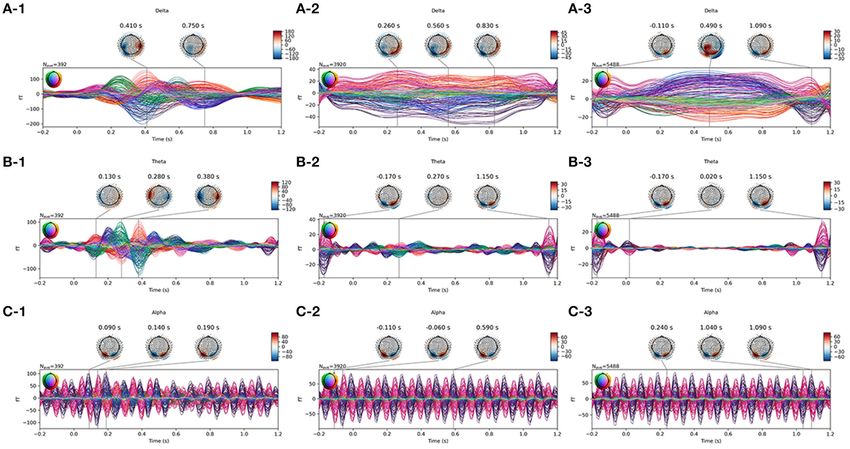
Zhang et al.                                                                                                             Ternary-classification of RSVP Using MEG

 FIGURE 1 | The paradigm and examples of pictures used in the RSVP experiment. The examples of target and non-target pictures are plotted on (A,B). The
 paradigm is plotted on (C) and the ternary classification labeling protocol is plotted on (D).

 FIGURE 2 | Average waveform visualization of MEG samples. The A/B/C row plots the average waveform of the frequency of Delta/Theta/Alpha band. The 1/2/3
 column plots the average waveform of target/near-/far-non-target samples.

classifier was built and trained using “pytorch” toolbox in the                    we used softmax function in the output to match the ternary
high-performance GPU server. Since there were 272 sensors                          classification. The loss function was calculated using the output
in the MEG data other than the 64 sensors in the EEG data,                         of EEGNet and one hot-coded sample label. The architecture
we changed the input number to 272 accordingly. Additionally,                      was the same as the “DeepConvNet” model of EEGNet (Lawhern

Frontiers in Computational Neuroscience | www.frontiersin.org                  4                                       February 2021 | Volume 15 | Article 619508
Zhang et al. Ternary-classification of RSVP Using MEG
TABLE 1 | Scoures table of ERP detection.
Recall Precision F1 score Accuracy
SVM (binary) 0.8206 ± 0.1304 0.8649 ± 0.0828 0.8364 ± 0.1027 0.9875 ± 0.0068
SVM (ternary) 0.8243 ± 0.1259 0.8610 ± 0.0823 0.8384 ± 0.1027 0.9876 ± 0.0070
Net (binary) 0.8740 ± 0.0837 0.7574 ± 0.1216 0.8085 ± 0.0987 0.9829 ± 0.0097
Net-3 (ternary) 0.8513 ± 0.0847 0.8731 ± 0.0775 0.8608 ± 0.0749 0.9890 ± 0.0059
The bold values refer the highest value of the column.
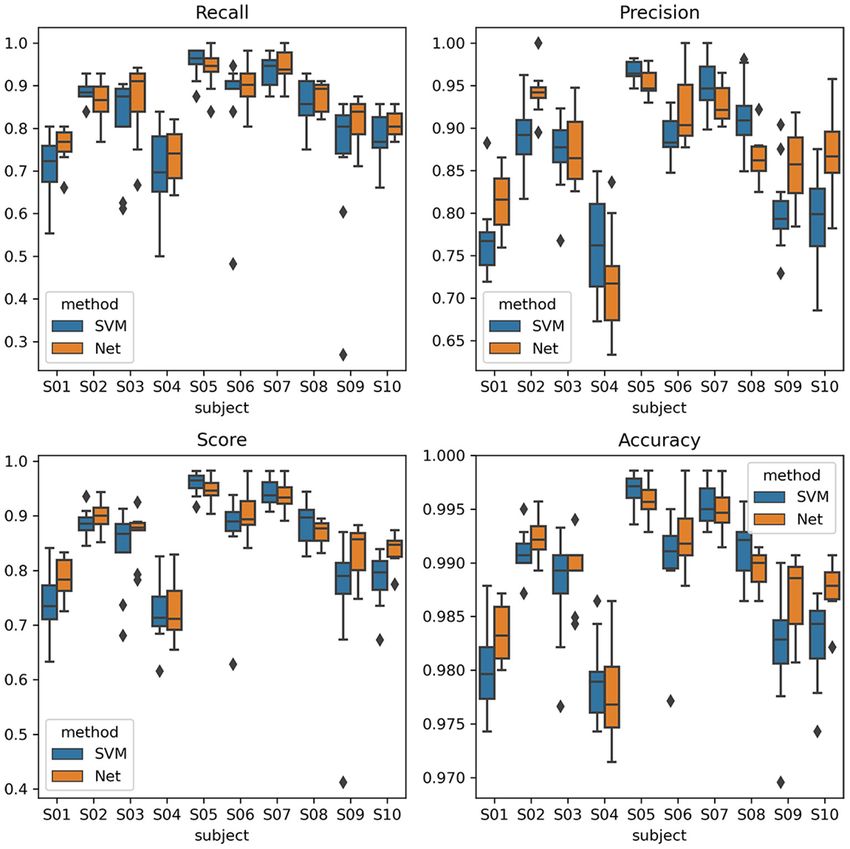
FIGURE 3 | ERP detection scores with ternary classification of all the 10 subjects in box-and-whisker plots. The SVM labels refer to the score of SVM classifier, and
the Net labels refer to the score of EEGNet classifier.
et al., 2018). The parameters in the EEGNet were upgraded using Cross-Session Validation
the Adam optimizer. The learning rate was set as 0.001 for initiate We used the SVM and CNN model in EEGNet architecture
and then the rate was set to shrink to 0.8 times every 50 epochs classifier to detect ERP for identifying the target samples. To
to avoid overfitting. The training process contained 500 epochs, evaluate the reusability of the classifiers, we applied cross folder
and 300 training samples with equal class number were randomly protocol to separate the MEG data into training and testing
selected in each epoch. Since the EEGNet classifier performed dataset recursively. The separation is based on the sessions of the
feature selection automatically using the first convolution layers, experiment to keep the independency between the training and
the band filtered MEG data were used directly without additional testing data. Since all the subjects finished 11 sessions of the RSVP
feature extraction process in prior. experiment, we applied the 11-folder protocol. In each folder, the
Frontiers in Computational Neuroscience | www.frontiersin.org 5 February 2021 | Volume 15 | Article 619508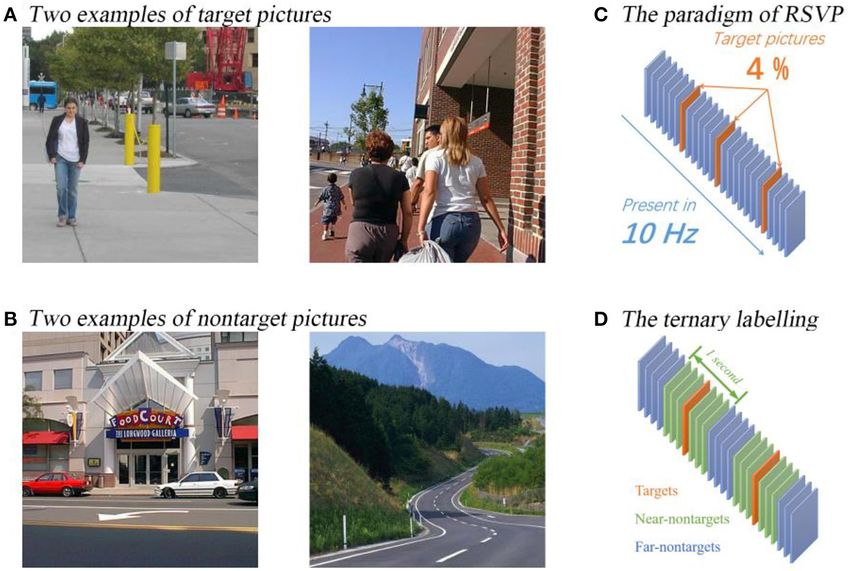
Zhang et al.                                                                                                    Ternary-classification of RSVP Using MEG

data of one session were used as testing dataset, and data of other        TABLE 2 | ANOVA tables of scores.
sessions were concatenated to generate the training data.
                                                                                          Df      sum_sq       mean_sq          F           PR (>F)
    In folders of 11 sessions, the following training and testing
procedure were repeated. In the SVM part, the training dataset             Recall
was used to train the xdawn spatial filter to perform feature              Subject        9.0      1.1160       0.1240       21.4217      4.6338e−24
extraction, and then the features were used to train an SVM                Method         1.0      0.0354       0.0354        6.1178      1.4347e−02
classifier. The testing dataset was then applied by the trained            Folder        10.0      0.0956       0.0095        1.6530      9.5467e−02
xdawn spatial filter and SVM classifier to evaluate the detection          Resibinary   173.0      1.0015       0.0057         NaN            NaN
scores. In the EEGNet part, the training dataset was used to train         Precision
the parameter of the net without prior feature extraction and then         Subject        9.0      0.8201       0.0911       42.8921      1.3668e−39
the testing dataset was used to evaluate the detection scores.
                                                                           Method         1.0      0.0071       0.0071        3.3651      6.8306e−02
    As a result, we performed cross-session validation within
                                                                           Folder        10.0      0.0409       0.0040        1.9261      4.4532e−02
subject to validate the discriminating power of the method. It was
                                                                           Resibinary   173.0      0.3675      0.002125        NaN            NaN
operated as the online experiment simulation. The model was
                                                                           F1 Score
fitted to samples in training sessions and then the test samples
                                                                           Subject        9.0      0.9869       0.1096       37.6439      2.4480e−36
were transformed one by one to obtained the labels. Although
                                                                           Method         1.0      0.0244       0.0244        8.3976      4.2433e−03
the ternary classification gave labels of three class labels, we
                                                                           Folder        10.0      0.0620       0.0062        2.1310      2.4425e−02
merged the near- and far-non-target labels as the non-target label.
                                                                           Resibinary   173.0      0.5039       0.0029         NaN            NaN
Thus, the ternary classification method was used to increase the
                                                                           Accuracy
discriminating power, and it was transparent to the experiment
                                                                           Subject        9.0      0.0058       0.0006       55.5035      1.9985e−46
since it eventually produced binary labels.
                                                                           Method         1.0      0.0000       0.0000        8.0118      5.1975e−03
    Additionally, we also visualized the features to investigate the
                                                                           Folder        10.0      0.0003       0.0000        2.7216      3.9466e−03
ERP detection underling of SVM and EEGNet classifiers. For the
SVM classifier, the features extracted by the xdawn spatial filter         Resibinary   173.0      0.0020       0.0000         NaN            NaN

were visualized. For EEGNet, the activity of the first convolution
layer was visualized. We used the TSNE projection method to
project the features into the two-dimensional manifold space. In           showed that the increase of the EEGNet was significant since
the space, we showed the distribution of the target, near-, and            the p-value was < 0.001 for recall score and F1 score, please see
far-non-target samples in a distance invariance manner.                    Table 2 for the detail values.
                                                                              Figure 4 shows the confusion matrix of the classification.
RESULTS                                                                    Firstly, it shows that the near- and far-non-target samples can
                                                                           be discriminated. The first row of the matrix had three columns,
ERP Detection Scores                                                       which showed the ratio of target samples being detected as
The ERP detection scores were recorded and compared between                target, near-non-target, and far-non-target samples. The second
SVM and EEGNet classifiers. The scores of interests are the                and third rows showed the ratio of near-non-target and far-
recall rate, precision rate, and F1 score of the target samples,           non-target samples, respectively. As a result, the diagonal values
which was also the aim of the RSVP experiment. The average                 were the ratio of the three classes of samples being correctly
scores of all the subjects were shown in Table 1. The recall               classified. The other values were the ratio of being incorrectly
score was higher for the EEGNet classifier. Additionally, the              classified. The first row was used to calculate the scores of target
ternary classification method increased the scores of the EEGNet           samples classification. The value in the first column referred to
classifier beyond the SVM. The scores of EEGNet and SVM using              the true-positive rate (TPR) (Albieri and Didelez, 2014). The
ternary classification of all the subjects were plotted in Figure 3.       value in the second and third columns referred to the false-
It showed that the scores of EEGNet was higher than SVM on                 negative rate (FNR) of target to near-non-target and far-non-
more subjects. The variance among cross-session folders of the             target, respectively. The first column was used to calculate the
EEGNet method were smaller. Moreover, the EEGNet with the                  scores of samples being classified to target samples. The false-
ternary classification method also produced the highest F1 scores.         positive rate (FPR) of near-non-target to target was the value of
    To make sure the comparison was valid, we applied analysis             the second row and first column in the matrix.
of variance (ANOVA) (Rouder et al., 2016) and paired t-test                   The results showed that the TPR of target samples was
(Xu et al., 2017) method to test the statistical level of the              higher in EEGNet, and the FNR of target to far-non-target
difference between the scores. Firstly, to settle the complicity           was lower in EEGNet. According to the first column, the FPR
of the experiment, we used ANOVA to testify if the difference              of near-non-target to target is lower in EEGNet. According to
between the scores was because of the usage of classifiers. As             the other elements in the matrixes, the discriminating power
a result, we used three-factor ANOVA; the factors were subject             between target and near-non-target was also higher in EEGNet.
factor, folder factor, and method factor. The results showed               It suggested that the higher scores of EEGNet were due to
that the method factor had main effect, which suggested that               the fact that the new three classification method could increase
the choice of classifiers affected the scores. Then, we used the           the discriminating power between target and near-non-target of
t-test method to obtain the p-value of the difference. The results         the EEGNet classifier.

Frontiers in Computational Neuroscience | www.frontiersin.org          6                                       February 2021 | Volume 15 | Article 619508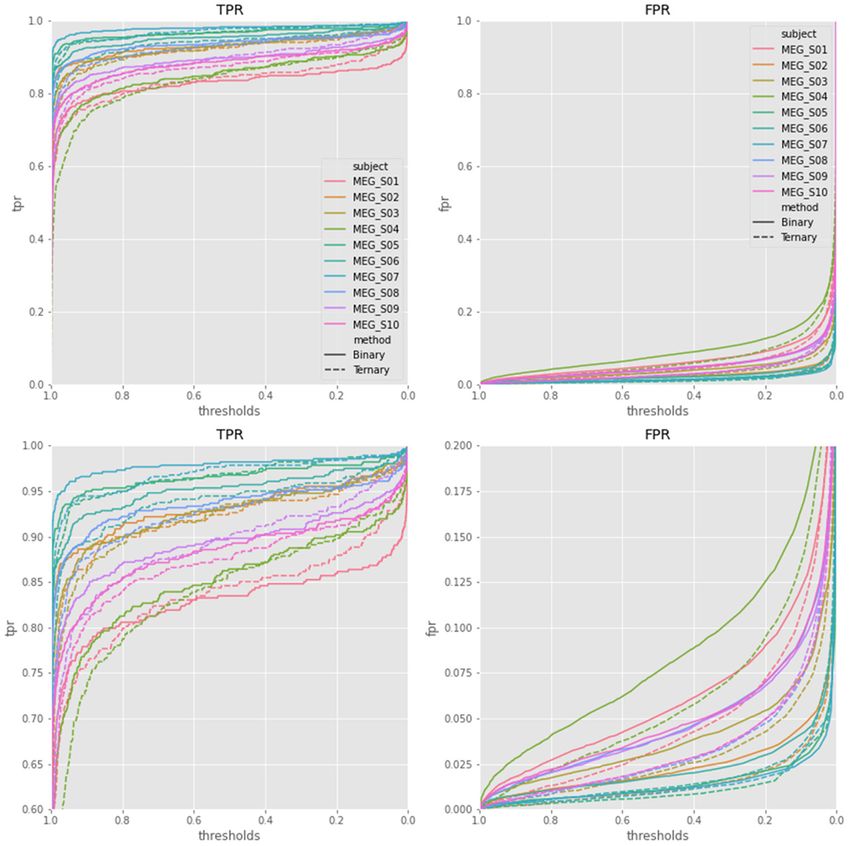
Zhang et al.                                                                                                              Ternary-classification of RSVP Using MEG

 FIGURE 4 | The average confusion matrix of the SVM and EEGNet method using ternary classification. The float numbers on the grids are the average value of
 percentage.

 FIGURE 5 | The TPR and FPR curves of EEGNet with thresholds of all the 10 subjects. The two plots on the bottom were the same as the plots on the top, other than
 using a smaller value range.

Frontiers in Computational Neuroscience | www.frontiersin.org                   7                                        February 2021 | Volume 15 | Article 619508
Zhang et al.                                                                                                                    Ternary-classification of RSVP Using MEG

 FIGURE 6 | Average waveform plots of six xdawn features. The six grids refer to the six features; the colors refer to ternary kinds of samples.

   Additionally, since we used softmax function on the output                           were both weak. It showed that the activity pattern of near-non-
layer of EEGNet, the probability of the sample as a target sample                       target samples was similar to target samples, and the far-non-
could be obtained. The TPR and FPR curves among different                               target samples did not show similarity.
thresholds (Zhang et al., 2015) of target samples were plotted                              Figure 6 plots all the six averaged components of xdawn
in Figure 5 based on the output of EEGNet. The area under                               extraction. The order was set as decreasing order of explained
curve (AUC) values of EEGNet were 0.9808 ± 0.0197 of binary                             variance. It turned out that the first three features cover the main
classification and 0.9858 ± 0.0136 of ternary classification.                           differences between target and non-target signals. There was
The results showed that the ternary classification produced                             little difference between near- and far-non-target samples. The
higher AUC values and lower FPR values than traditional                                 SSVEP components mainly existed in the latter three features,
binary classification protocol. The results suggested that the                          which suggested that they were less important to ERP detection.
ternary classification method can largely suppress the FPR of                           Figure 7 plots samples in the two-dimensional manifold space.
target samples.                                                                         It showed a similar trend with the averaged plot. The first three
                                                                                        features were more separated among the three kinds of samples.
Visualization                                                                               The visualization of EEGNet features was done in the same
Figure 2 plots the waveform and topotactical activity of averaged                       way as the SVM features. Figure 8 plots the waveform of
samples of one subject on different frequency bands. The graphs                         the averaged 25 features. Figure 9 plots the features in the
used the joint plotting visualization method of MNE software,                           two-dimensional manifold space. It showed that all the 25
and the colors represented the 272 channels of the MEG set. The                         features show difference between three kinds of samples. The
waveform of target samples on the Delta band clearly showed                             difference between near- and far-non-target samples was also
the ERP activity of the target pictures. The waveform on the                            clear. Moreover, the features containing SSVEP also showed
Alpha band showed the SSVEP activity triggered by the 10-Hz                             difference among three classes. The features of No. 11, 13, 14,
presentation, and the SSVEP occurred in all the three kinds                             15, 16, 17, 20, 22, and 24 showed a large difference between
of samples. The differences between near- and far-non-target                            target and non-target samples. The features of No. 3, 5, 20, and
samples were mainly on the Delta band, and even their activities                        19 showed moderate difference between near- and far-non-target

Frontiers in Computational Neuroscience | www.frontiersin.org                       8                                         February 2021 | Volume 15 | Article 619508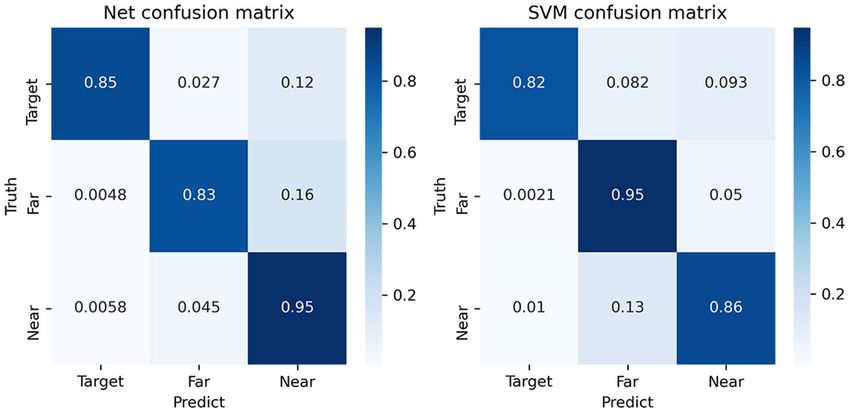
Zhang et al.                                                                                                                    Ternary-classification of RSVP Using MEG

 FIGURE 7 | Projection of samples of six xdawn features in two-dimensional manifold space. The six grids refer to the six features; the colors refer to ternary kinds of
 samples.

samples. The results were consistent with the confusion matrix                          that the target samples contained the ERP with the “correct”
of Figure 4, which showed large error rate between near- and                            latency, which was occasionally too small in some samples to
far-non-target samples.                                                                 distinguish them.
                                                                                            We separated the samples into three classes: target, near-,
DISCUSSION                                                                              and far-non-target samples. The waveforms showed that the
                                                                                        difference between them were mainly on the Delta band, and the
In this study, the MEG data were acquired during the RSVP                               near-non-target samples were more similar to the target samples
experiment; the rapid presented pictures were natural scene                             (see Figure 2). The visualization of the features showed the
pictures, and the pictures with pedestrians were used as target                         difference between them either (see Figures 6–9). Thus, the non-
pictures. We presented the new ternary classification method                            target samples should be separated into two sets, the ones near
to train the SVM and EEGNet classifiers to detect ERP signal                            a target sample (near-non-target) and others (far-non-target).
to identify the onset of target stimulus. The new method has                            The traditional methods did not separate the two kinds of non-
improved the detection scores using the EEGNet classifier.                              target samples either. As a result, the classifiers had to solve the
   The traditional machine learning method in the RSVP                                  confusion by detecting some ERP signals and discarding others,
experiment only used binary classification to discriminate the                          which was bad to ERP detection.
target and other samples. The method ignores the similarity                                 The new ternary classification method trained the classifier
of target samples and their neighbors. The speed of RSVP in                             to learn not only the difference between target and others but
the experiment was 10 Hz. The latency between two samples                               also the difference between target samples and their neighbors.
was 0.1 s. However, the latency of a classic reliable ERP was                           It actually separated the ERP detection task into two folders.
about 0.3 s, which was widely known as the P300 feature                                 The first one was to detect ERP components in the samples to
signal (Mijani et al., 2019). The length of the ERP was not                             find target and near-non-target samples. The second one was
narrow either. As a result, the near-non-target samples inevitably                      to distinguish the two classes. The confusion matrix of EEGNet
contained the ERP the same as target samples (see the average                           proved that the new method increased the TPR of target and
waveform in Figure 2). The difference between them was only                             near-target samples (see Figure 4).

Frontiers in Computational Neuroscience | www.frontiersin.org                       9                                          February 2021 | Volume 15 | Article 619508
Zhang et al. Ternary-classification of RSVP Using MEG FIGURE 8 | Average waveform plots of 25 EEGNet features. The 25 grids refer to the 25 features; the colors refer to ternary kinds of samples. Compared with the SVM classifier, the EEGNet provided methods were similar. The results explained that the ternary higher TPR for ERP component detection. Although the TPR method produced higher precision score than the binary method of far-non-target samples was lower than SVM, the incorrect (see Table 1). It was shown that the TPR only reached 0.85 in samples were more likely to be classified as the near-non-target confusion matrix (see Figure 5) and the overall accuracy reached samples. Finally, the scores of target samples using EEGNet were 0.98 (see Table 1). The reason was the non-target samples overly higher than using the SVM classifier. The ROC plots of largely outnumbered the target samples. Based on EEGNet EEGNet showed the difference between the traditional binary classifier results, the TNR was extremely high (see the second and new ternary methods in detail (see Figure 5). The FPRs and third row of the first column of the confusion matrix), of target detection of the ternary method were largely lower which made the overall accuracy higher than the TRP value of than those of the binary method, while the TPRs of the two target samples. Frontiers in Computational Neuroscience | www.frontiersin.org 10 February 2021 | Volume 15 | Article 619508
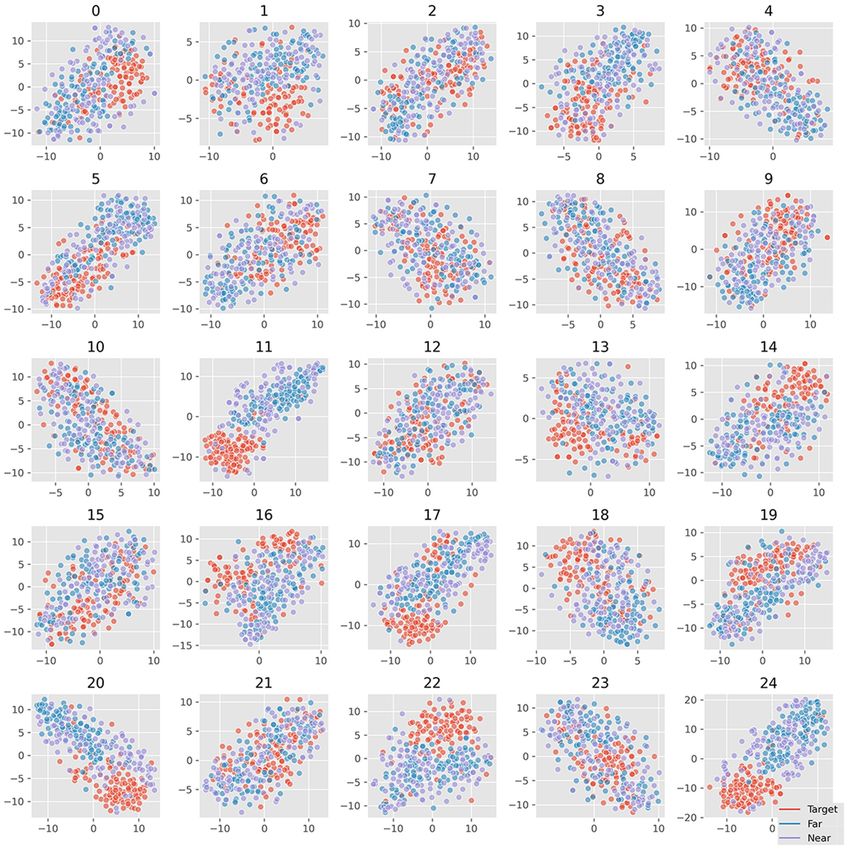
Zhang et al.                                                                                                                  Ternary-classification of RSVP Using MEG

 FIGURE 9 | Projection of samples of 25 EEGNet features in two-dimensional manifold space. The 25 grids refer to the 25 features; the colors refer to ternary kinds of
 samples.

   Based on the results of the study, the separation increased                         features automatically in the RSVP experiment (see Figure 9). As
the ERP detection scores. The results suggested that the reason                        a result, the xdawn spatial filter was not necessary for the EEGNet
EEGNet produced higher ERP detection scores was that it                                classifier. Meanwhile, it also hinted that the CNN model could
had learned the difference between the samples with ERP and                            benefit from the correct separation of the samples.
other samples without ERP signals. Furthermore, the results                               The SVM classifier did not benefit from the ternary method.
also suggested that the CNN model was better at detecting                              It might be due to the fact that SVM used time points in the
ERP components despite their variance in latency, which were                           samples as independent feature dimensions. The shifts of ERP
consistent with the translation invariance of the CNN model                            components in near-non-target samples converted the feature
(Furukawa, 2017). The visualization of 25 features of samples                          from dimensions. Thus, it was hard for the SVM classifier to
also verified that the CNN model can effectively extract the useful                    track the dependence between the time points. The reason we

Frontiers in Computational Neuroscience | www.frontiersin.org                     11                                        February 2021 | Volume 15 | Article 619508
Zhang et al.                                                                                                                       Ternary-classification of RSVP Using MEG

used xdawn in SVM classification was the lack of automatically                             ETHICS STATEMENT
extracting features of the SVM classifier (Bascil et al., 2016). The
results also suggested that the six components had fully covered                           The studies involving human participants were reviewed
the explainable variance, and the increase of the components was                           and approved by Institute of Automation Chinese Academy
not necessary.                                                                             of Sciences. The patients/participants provided their written
                                                                                           informed consent to participate in this study.
CONCLUSION
                                                                                           AUTHOR CONTRIBUTIONS
In this study, the MEG data were acquired during the RSVP
experiment; the rapid presented pictures were natural scene                                CZ operated the experiment, analyzed the data, and wrote
pictures, and the pictures with pedestrians were used as target                            the manuscript. SQ operated the experiment. SW jointed in
pictures. We also presented the new ternary classification method                          data analyzing. HH was in charge of the project. All authors
to train the SVM and EEGNet classifiers to detect ERP signal                               contributed to the article and approved the submitted version.
to identify the onset of target stimulus. We obtained a fair
ERP detection accuracy using traditional SVM and EEGNet
classifiers. The proposed ternary classification method showed                             FUNDING
the discrimination of the near- and far-non-targets in the RSVP
experiment and increased accuracy in the EEGNet classifier. The                            This work was supported in part by the National Natural
visualization of the results also uncovered the different ERP                              Science Foundation of China under Grant 61976209, Grant
detection underling between SVM and EEGNet classifiers.                                    62020106015, and Grant 61906188, in part by the Chinese
                                                                                           Academy of Sciences (CAS) International Collaboration
                                                                                           Key Project under Grant 173211KYSB20190024; and in part
DATA AVAILABILITY STATEMENT                                                                by the Strategic Priority Research Program of CAS under
The raw data supporting the conclusions of this article will be                            Grant XDA27000000, in part by the National Nature Science
made available by the authors, without undue reservation.                                  Foundation of China grant (31730039).

REFERENCES                                                                                 Jin, J., Chen, Z., Xu, R., Miao, Y., Wang, X., and Jung, T.-P. (2020a).
                                                                                               Developing a novel tactile p300 brain-computer interface with a cheeks-stim
Albieri, V., and Didelez, V. (2014). Comparison of statistical methods                         paradigm. IEEE Trans. Biomed. Eng. 67, 2585–2593. doi: 10.1109/tbme.2020.
   for finding network motifs. Stat. Appl. Genet. Mol. Biol. 13, 403–422.                      2965178
   doi: 10.1515/sagmb-2013-0017                                                            Jin, J., Li, S., Daly, I., Miao, Y., Liu, C., Wang, X., et al. (2020b). The
Barry, R. J., and De Blasio, F. M. (2018). EEG frequency PCA in EEG-ERP                        study of generic model set for reducing calibration time in P300-based
   dynamics. Psychophysiology 55:e13042. doi: 10.1111/psyp.13042                               brain–computer interface. IEEE Trans. Neural Syst. Rehabil. Eng. 28, 3–12.
Bascil, M. S., Tesneli, A. Y., and Temurtas, F. (2016). Spectral feature extraction            doi: 10.1109/tnsre.2019.2956488
   of EEG signals and pattern recognition during mental tasks of 2-D cursor                Jin, J., Xiao, R., Daly, I., Miao, Y., Wang, X., and Cichocki, A. (2020c).
   movements for BCI using SVM and ANN. Australas. Phys. Eng. Sci. Med. 39,                    Internal feature selection method of CSP based on L1-Norm and
   665–676. doi: 10.1007/s13246-016-0462-x                                                     Dempster-Shafer theory. IEEE Trans. Neural Netw. Learn. Syst. 1–12.
Cecotti, H. (2016). Single-trial detection with magnetoencephalography during                  doi: 10.1109/tnnls.2020.3015505
   a dual-rapid serial visual presentation task. IEEE Trans. Biomed. Eng. 63,              Lawhern, V. J., Solon, A. J., Waytowich, N. R., Gordon, S. M., Hung, C.
   220–227. doi: 10.1109/tbme.2015.2478695                                                     P., and Lance, B. J. (2018). EEGNet: a compact convolutional neural
Chih-Wei, H., and Chih-Jen, L. (2002). A comparison of methods for                             network for EEG-based brain-computer interfaces. J. Neural Eng. 15:056013.
   multiclass support vector machines. IEEE Trans. Neural Netw. 13, 415–425.                   doi: 10.1088/1741-2552/aace8c
   doi: 10.1109/72.991427                                                                  Lin, Z., Zeng, Y., Gao, H., Tong, L., Zhang, C., Wang, X., et al. (2017).
Creel, D. J. (2019). Visually evoked potentials. Handb. Clin. Neurol. 160, 501–522.            Multirapid serial visual presentation framework for EEG-based
   doi: 10.1016/b978-0-444-64032-1.00034-5                                                     target detection. Biomed. Res. Int. 2017:2049094. doi: 10.1155/2017/
Dimigen, O. (2020). Optimizing the ICA-based removal of ocular EEG                             2049094
   artifacts from free viewing experiments. Neuroimage 207:116117.                         Lin, Z., Zhang, C., Zeng, Y., Tong, L., and Yan, B. (2018). A novel
   doi: 10.1016/j.neuroimage.2019.116117                                                       P300 BCI speller based on the Triple RSVP paradigm. Sci. Rep. 8:3350.
Furukawa, H. (2017). Deep learning for target classification from SAR imagery:                 doi: 10.1038/s41598-018-21717-y
   data augmentation and translation invariance.                                           Mijani, A. M., Shamsollahi, M. B., and Sheikh Hassani, M. (2019). A novel dual and
Gramfort, A., Luessi, M., Larson, E., Engemann, D. A., Strohmeier, D., Brodbeck,               triple shifted RSVP paradigm for P300 speller. J. Neurosci. Methods 328:108420.
   C., et al. (2014). MNE software for processing MEG and EEG data. Neuroimage                 doi: 10.1016/j.jneumeth.2019.108420
   86, 446–460. doi: 10.1016/j.neuroimage.2013.10.027                                      Pohlmeyer, E. A., Wang, J., Jangraw, D. C., Lou, B., Chang, S. F., and Sajda,
Helfrich, R. F., and Knight, R. T. (2019). Cognitive neurophysiology:                          P. (2011). Closing the loop in cortically-coupled computer vision: a brain-
   event-related potentials. Handb. Clin. Neurol. 160, 543–558.                                computer interface for searching image databases. J. Neural Eng. 8:036025.
   doi: 10.1016/b978-0-444-64032-1.00036-9                                                     doi: 10.1088/1741-2560/8/3/036025
Huang, Y., Erdogmus, D., Pavel, M., Mathan, S., and Hild, K. E. (2011). A                  Rivet, B., Souloumiac, A., Attina, V., and Gibert, G. (2009). xDAWN
   framework for rapid visual image search using single-trial brain evoked                     algorithm to enhance evoked potentials: application to brain–computer
   responses. Neurocomputing 74, 2041–2051. doi: 10.1016/j.neucom.2010.                        interface. IEEE Trans. Biomed. Eng. 56, 2035–2043. doi: 10.1109/TBME.2009.
   12.025                                                                                      2012869

Frontiers in Computational Neuroscience | www.frontiersin.org                         12                                         February 2021 | Volume 15 | Article 619508
Zhang et al. Ternary-classification of RSVP Using MEG Rouder, J. N., Engelhardt, C. R., McCabe, S., and Morey, R. D. (2016). T-test. Shanghai Arch. Psychiatry 29, 184–188. doi: 10.11919/j.issn.1002-0829. Model comparison in ANOVA. Psychon. Bull. Rev. 23, 1779–1786. 217070 doi: 10.3758/s13423-016-1026-5 Zhang, X., Li, X., Feng, Y., and Liu, Z. (2015). The use of ROC and AUC in the Vapnik, V. N. (1998). Statistical learning theory. Encycl. Ences Learn. 41, 3185. validation of objective image fusion evaluation metrics. Signal Process. 115, Williams, C. K. I. (2003). Learning with kernels: support vector machines, 38–48. doi: 10.1016/j.sigpro.2015.03.007 regularization, optimization, and beyond. J. Am. Stat. Assoc. 98:489. https:// www.researchgate.net/deref/http%3A%2F%2Fdx.doi.org%2F10.1198%2Fjasa. Conflict of Interest: The authors declare that the research was conducted in the 2003.s269 doi: 10.1198/jasa.2003.s269 absence of any commercial or financial relationships that could be construed as a Won, K., Kwon, M., Jang, S., Ahn, M., and Jun, S. C. (2019). P300 speller potential conflict of interest. performance predictor based on RSVP multi-feature. Front. Hum. Neurosci. 13:261. doi: 10.3389/fnhum.2019.00261 Copyright © 2021 Zhang, Qiu, Wang and He. This is an open-access article Xiao, X., Xu, M., Jin, J., Wang, Y., Jung, T. P., and Ming, D. (2020). Discriminative distributed under the terms of the Creative Commons Attribution License (CC BY). canonical pattern matching for single-trial classification of ERP components. The use, distribution or reproduction in other forums is permitted, provided the IEEE Trans. Biomed. Eng. 67, 2266–2275. doi: 10.1109/TBME.2019.29 original author(s) and the copyright owner(s) are credited and that the original 58641 publication in this journal is cited, in accordance with accepted academic practice. Xu, M., Fralick, D., Zheng, J. Z., Wang, B., Tu, X. M., and Feng, C. (2017). No use, distribution or reproduction is permitted which does not comply with these The differences and similarities between two-sample T-test and paired terms. Frontiers in Computational Neuroscience | www.frontiersin.org 13 February 2021 | Volume 15 | Article 619508
You can also read