The characteristics of steamed bread from reconstituted whole wheat flour (WWF) of different U.S. hard wheat classes with different bran particle ...
←
→
Page content transcription
If your browser does not render page correctly, please read the page content below
The characteristics of steamed bread from

  reconstituted whole wheat flour (WWF) of

different U.S. hard wheat classes with different

        bran particle size distributions

                YU CHING HUANG

     Visiting Scholar, Wheat Marketing Center

          Associate Researcher, CGPRDI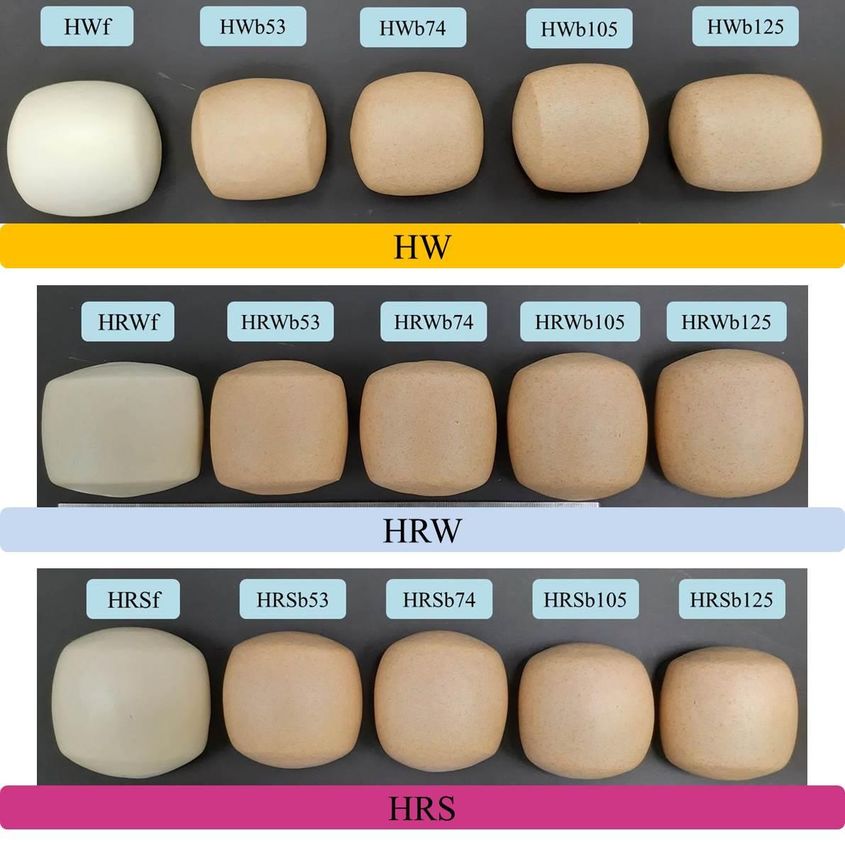
Table of Contents

Executive summary ................................................................................................. 3
Introduction ............................................................................................................ 4
Materials and methods ........................................................................................... 5
       Materials ..................................................................................................... 5
       Preparation of reconstituted whole wheat flours (WWF) .......................... 5
       Flour compositional and quality analyses................................................... 5
       Steamed bread preparation ........................................................................ 6
       Quality evaluation of steamed bread ......................................................... 7
       Statistical analysis ....................................................................................... 7
Results ..................................................................................................................... 8
        Compositional analysis................................................................................ 8
        Damaged starch content ............................................................................. 9
           Solvent retention capacity (SRC) profiles .................................................. 10
           Farinograph characteristics ....................................................................... 12
           Mixolab characteristics ............................................................................. 13
           Extensibility of steamed bread doughs ..................................................... 16
           Steamed bread specific volume ................................................................ 18
           Steamed bread color ................................................................................. 22
           Steamed bread texture profile analysis .................................................... 22
Conclusions ........................................................................................................... 24
Future work ........................................................................................................... 24
References ............................................................................................................. 25

                                                                                                                                  2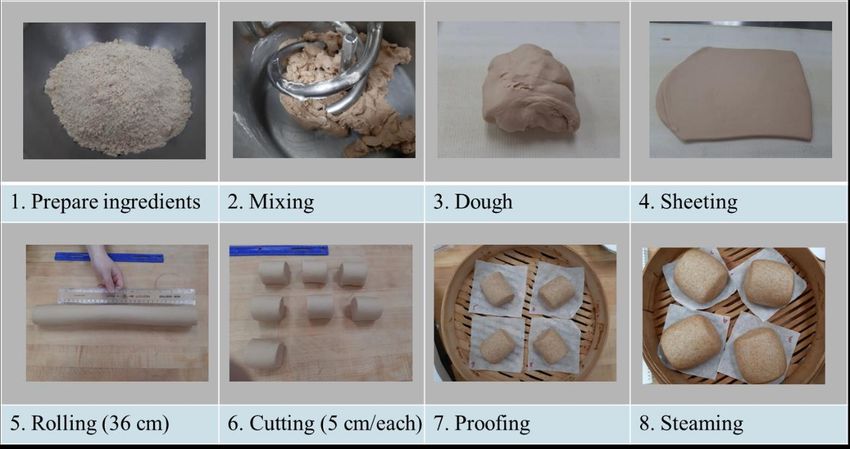
Executive Summary
In this study we compared three US wheat classes, hard white (HW), hard red winter
(HRW) and hard red spring (HRS), along with different particle size distributions of
bran (53μm, 74μm, 105μm and 125μm), and assessed their potential in steamed
bread. Refined flour was prepared from all 3 classes and reconstituted with its
respective bran fraction at different particle size distributions to make a model WWF.

   •   Results showed that the damaged starch content of refined HW flour and
       reconstituted HW WWF was 3.23%~3.70%; refined HRW flour and
       reconstituted HRW WWF was 5.45%~5.92%; and refined HRS flour and
       reconstituted HRS WWF was 4.04%~4.35%. These are low values for hard
       wheat flours, both refined and whole wheat.
   •   Farinograph and SRC results showed that the water absorptions of all
       reconstituted WWF were increased compared to control flours, as expected.
   •   Farinograph and Mixolab tests both showed the peak time and stability of the
       HRW WWF increased compared to refined HRW. The opposite trend was
       observed for HW WWF and HRS WWF, and may be related to differences in
       wheat class gluten characteristics.
   •   For reconstituted WWF steamed bread quality, the specific volumes of all
       three groups decreased with the addition of bran, and WWF flour with
       smaller bran particle sizes exhibited the lowest specific volumes (HWb74:
       2.16 cc/g; HRWb53: 2.22 cc/g; HRSb53: 2.13 cc/g).
   •   The L value and whiteness index both decreased with smaller bran particle
       size distributions, meaning the color was less white and bright.
   •   From texture profile analysis, adding bran increased both the firmness and
       chewiness.

Based on this study, a bran particle size distribution of 105μm - 125μm is
recommended for HW, HRW and HRS to achieve larger specific volume coupled with
softer, less chewy texture.

Key words: hard white wheat, hard red spring wheat, hard red winter wheat, bran,
bran particle size distribution, reconstituted whole wheat flour, steamed bread

                                                                                     3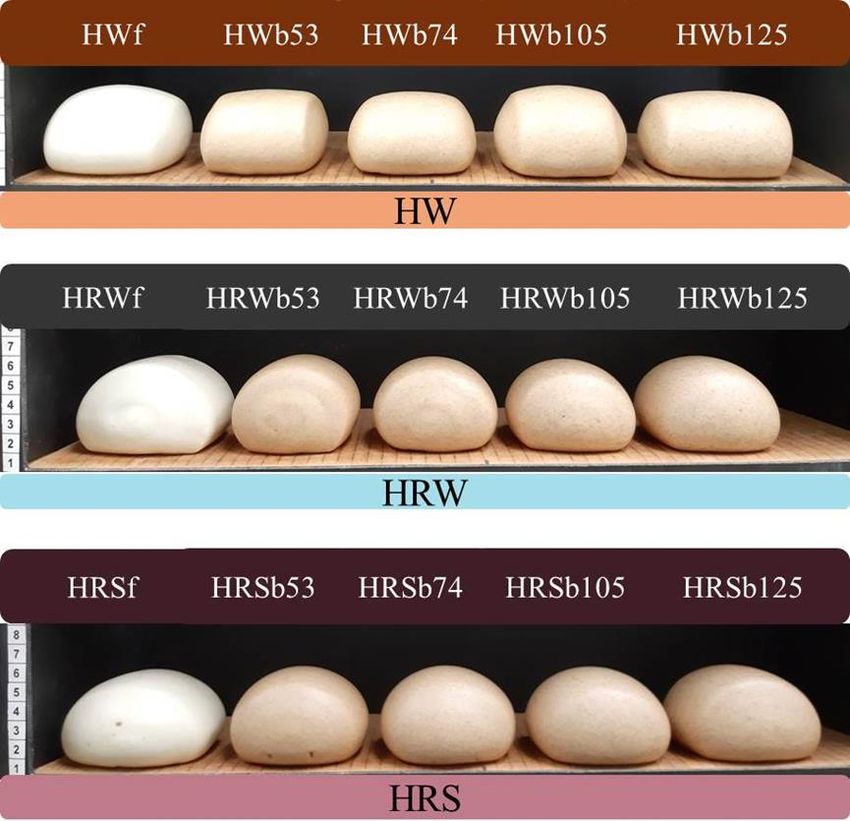
Introduction
Steamed bread is one of the most popular breakfast foods in Taiwan. Taiwan’s
Department of Statistics points out that the annual output value of baked and
steamed food is about 6.2 billion NT dollars (Yang, 2020). In China, steamed bread is
divided into two styles, northern and southern, and most steamed bread in Taiwan is
of the northern style. Northern style steamed bread is larger and has less sugar and
fat than the southern style. Because of its simple formula, changing the type of flour
may change the quality of northern style steamed bread.

Whole grain foods are good for health, and whole wheat flour is commonly used in
baked and steamed wheat-based products to meet whole grain requirements. Whole
wheat flour refers to a flour that uses 100% of the wheat kernel, including all bran,
germ and endosperm materials. Although most consumers know that using whole
wheat flour to make baked or steamed products is beneficial for health, changes in
taste and texture brought about by whole wheat flour affect consumer purchasing
decisions. Finding a balance between health benefits and desirable flavor/texture is
one of the current aims of designing a healthy diet.

Using whole wheat flour to replace refined flour is not always straightforward. The
presence of the bran and germ results in changes in product color, texture, and
flavor, to name a few. Bran particle size plays a role in some of these changes, and
some can be negative while others can be positive. Some studies showed that
smaller bran particle sizes had a beneficial effect on Asian noodles and some baked
products (Chen et al., 2011; Wang et al., 2016). Other studies indicated that the
presence of bran in dough not only affects gluten structure (Bock and Damodaran,
2013), but also affects gas cells in the dough (Gan et al., 1989; Chen, 2018), which
affects the appearance and quality of the bread. Therefore, the bran is also
considered to be an important factor affecting the structure and properties of bread
(Bock et al., 2013; Chen, 2018; Bock, 2019).

In this study, three different classes of wheat (HW, HRW and HRS) and four different
particle size distributions of bran (53μm, 74μm, 105μm and 125μm) were blended at
a ratio of 85% refined flour + 15% bran to create reconstituted whole wheat flour
(WWF) and make reconstituted WWF northern steamed bread. The purpose of this
study was to investigate the effects of reconstituted WWF particle size on flour
characteristics and northern steamed bread quality.

                                                                                        4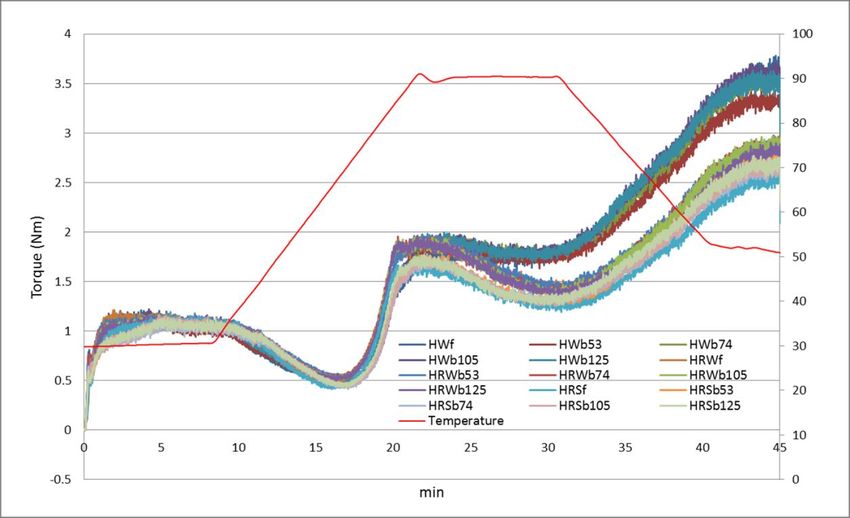
Materials and methods
Materials
Wheat from three U.S. wheat classes [hard white (HW), hard red winter (HRW) and
hard red spring (HRS)] were used in this study. Their protein contents (14% mb) were
12.7% (HW), 11.6% (HRW) and 14.4% (HRS). The three wheat samples were
tempered in plastic buckets at room temperature to a final moisture of 14.5% and
milled on a Miag Multomat experimental mill (Bühler Inc., Plymouth, MN). The
refined flours (HWf, HRWf and HRSf) were the controls in this study. Bran from each
respective wheat sample was milled by Prater Industries (Bolingbrook, IL) on a
laboratory scale air classifier mill to four particle size distribution targets with D(50)
values of 53 μm, 74 μm, 105 μm and 125 μm. Other materials included instant dry
yeast (Lesaffre Yeast Corp., Milwaukee, WI), sugar, salt and shortening (Crisco, J.M.
Smucker Co., Orrville, OH).

Preparation of reconstituted whole wheat flours (WWF)
After milling, control flours (HWf, HRWf and HRSf) were mixed with bran from each
particle size distribution target at a ratio of 85% refined control flour to 15% bran (w/w)
to create reconstituted whole wheat flour (WWF). The final sample set included: HW
(HWb53, HWb74, HWb105 and HWb125), HRW (HRWb53, HRWb74, HRWb105 and
HRWb125), and HRS (HRSb53, HRSb74, HRSb105 and HRSb125).

Flour composition and quality analyses
All samples were analyzed for moisture, protein, ash and damaged starch contents
according to AACC Approved Methods (44-15A; 08-01; 46-30; 76-33.01, respectively).
Because the SD-matic (Chopin Technologies, France), an amperometric method, has
not been evaluated for measurement of starch damage in WWF, an enzyme-based
starch damage assay kit (Megazyme, Chicago, IL) was also used to quantify starch
damage using AACC Method 76-31.01.

To evaluate the flour quality characteristics (polymer swelling, water absorption,
stability, starch gelatinization, retrogradation and extensibility), Solvent Retention
Capacity (SRC) (AACC Method 56-11.02), Farinograph (AACC Method 54-21.01) (C.W.
Brabender, South Hackensack, NJ), Mixolab (AACC Method 54-60.01) (Chopin
Technologies, France) and Kieffer rig extensibility (Texture Technologies, Hamilton,
MA) tests were conducted. The Kieffer rig extensibility test was partially modified
according to the method described by Londono et al., (2014). Dough samples were
prepared as appropriate for full formula steamed bread production. After dough
sheeting, the dough was flattened with a rolling pin and placed on a grooved base

                                                                                         5
with a Teflon coating. A flat top piece was applied to the dough on the grooved base
and pushed down firmly by tightening a clamp until the two pieces come together to
separate the dough into strips. The mold and clamp apparatus was then placed in a
closed plastic bag to relax for 45 minutes (30°C, 85% RH). After the relaxation period,
the clamp and flat top piece were removed and the dough strips removed one for
extensibility measurement on the TA.XTPlus (Texture Technologies, Hamilton, MA).
The test parameters were pretest speed, 2.0 mm/s; test speed, 3.3 mm/s; post-test
speed, 10 mm/ s; trigger force, 5 g; and data acquisition rate, 200 PPS.

Steamed bread preparation
Fig. 1 outlines the steamed bread making process. The formula included:

     400 g flour
     8 g instant dry yeast
     180 – 200 g water
     32 g sugar
     1.2 g salt
     16 g shortening

The yeast, sugar and salt were each dissolved separately in water. The mixtures were
then added to the flour and mixed in a Hobart mixer (Model A-120, Hobart
Manufacturing Co., Troy, OH) equipped with a special double spiral head at speed 1 for
1 minute. The shortening was then added and mixed into the dough at speed 1 for
another 1.5 minutes. The final dough was rested in plastic bag for 10 minutes before
sheeting until the surface was smooth (10-12 passes) using an Oshikiri sheeter/molder
(Model WFS, Oshikiri Machinery Ltd., Japan). The dough sheet was rolled into a
cylinder by hand to 36 cm and cut into 6 equal parts (5 cm/ piece). One piece of dough
(25 g) was placed in a 45 mL plastic centrifuge tube before proofing. Initial dough
volume was 21-22 mL. The dough pieces were then proofed (30°C, 85% RH) in a
proofing cabinet (Model LRPR-2, LBC Bakery Equipment, Everett, WA) until the volume
of dough in the centrifuge tube reached 40-45 mL. The remaining 5 pieces of dough
were steamed for 15 min using a convection oven (Model SCCWE 62G, Rational AG,
Germany).

                                                                                       6
Fig. 1. Steamed bread making steps

Quality evaluation of steamed bread
All steamed bread samples were evaluated for specific volume, exterior color and
texture. The specific volume of steamed bread was determined using a laser volume
analyzer (BVM-L370, TexVol Instruments Inc., Sweden) and dividing the measured
volume by the weight of the bread piece. The exterior L, a, b color was determined
using a chroma meter (CR-410, Konica Minolta Sensing Inc., Japan). The texture profile
analysis (TPA) of the steamed bread was determined using the TA.XTPlus Texture
Analyzer equipped with a 35 mm acrylic cylindrical probe. Steamed bread was sliced
horizontally, and a flat piece of 15 mm thickness was compressed to 50% of its original
height. The test conditions were: pretest speed, 2 mm/s; test speed, 1 mm/s; post-test
speed, 1 mm/s; and trigger force, 5 g.

Statistical analysis
All measurements were performed at least in triplicate. The results of the study were
presented as the average ± standard deviation. Significant differences were analyzed
by the Duncan’s multiple-range test (P < 0.05) using SAS statistical analysis software
for analysis of variance (ANOVA).

                                                                                     7
Results
Compositional analysis
Table 1 shows the moisture, protein, ash and damaged starch contents of the bran,
refined flours and reconstituted WWF used in this study. The moisture content of the
control flours (HWf, HRWf and HRSf) was 13.00 – 13.75% and consistently greater
than that of the reconstituted WWF (12.25 – 12.74%). This is reasonable as the bran
had a moisture content of 6.69% and would naturally reduce the average moisture
content of the reconstituted WWF. Ash content was greater for the reconstituted
WWF, as expected, due to the presence of bran. However, there were few significant
differences in protein content on the addition of bran.
Damaged starch content of the control flours varied depending on wheat class, likely
due to differences in kernel texture and milling characteristics. Starch damage, in
order from greatest to least, was as follows: HRWf (5.92%) > HRSf (4.35%) > HWf
(3.23%). Surprisingly, adding 15% bran only had a small effect on the damaged starch
content within the same class of wheat. Regrinding of bran normally increases starch
damage in the residual endosperm removed with the bran fraction. It is possible that
the air classification strategy used to regrind the bran for this study may have
improved bran passage through the screen, thereby minimizing excessive grinding
and subsequent starch damage.
Table 1. Composition and damaged starch content of refined flour and reconstituted
WWF
Damaged Starch
Sample Moisture Protein Ash
(SD-matic)
% 0% moisture basis %
Bran(125μm) 6.69±0.20 15.79±0.02 6.00±0.01 --
HWf 13.75±0.01a 13.77±0.04c 0.55±0.01c 3.23±0.12e
HWb53 12.49±0.01ef 13.65±0.03bc 1.46±0.05a 3.70±0.12d
HWb74 12.56±0.02e 13.85±0.05bc 1.40±0.01ab 3.59±0.04d
HWb105 12.71±0.04d 13.95±0.04b 1.43±0.02ab 3.39±0.11de
HWb125 12.74±0.04d 13.81±0.09bc 1.43±0.01ab 3.49±0.17de
HRWf 13.00±0.04c 12.36±0.32e 0.61±0.01c 5.92±0.07a
HRWb53 12.25±0.11h 12.77±0.01d 1.36±0.04b 5.45±0.17b
HRWb74 12.37±0.04g 12.63±0.15d 1.36±0.05b 5.74±0.14b
HRWb105 12.50±0.05ef 12.80±0.04d 1.36±0.03b 5.92±0.26ab
HRWb125 12.42±0.02fg 12.66±0.10d 1.41±0.03ab 5.65±0.25b
8HRSf 13.17±0.08b 15.66±0.02a 0.59±0.09c 4.35±0.12c
HRSb53 12.44±0.01fg 15.67±0.06a 1.36±0.00b 4.23±0.11c
HRSb74 12.52±0.04ef 15.81±0.22a 1.40±0.02ab 4.23±0.13c
HRSb105 12.59±0.01e 15.74±0.16a 1.41±0.03ab 4.27±0.05c
HRSb125 12.57±0.02e 15.77±0.04a 1.39±0.00ab 4.04±0.10c
n=3
Values followed by the different letters in the same column are significantly different
(P < 0.05).
Damaged starch content
Damaged starch is one of the most important factors affecting quality characteristics
of flour (Keskin et al., 2012). There two approved methods for determining damaged
starch as distinguished by their measurement principle: amperometric (SD-matic)
and enzymatic hydrolysis (Megazyme) methods.
The amperometric method (AACC 76-33) uses the absorption kinetics of iodine, as
measured by an amperometric probe, to express the damaged starch content. The
other method is based on enzymatic hydrolysis under given temperature, pH and
enzyme conditions. In that method, α-amylase acts on the flour sample to break
down the starch into reducing sugars, and starch damage is calculated according to
the amount of reducing sugars produced.
A comparison of the starch damage results obtained from each method are
presented in Table 2. Looking at the refined flours, all samples exhibited greater
starch damage using the SD-matic compared to the Megazyme method. It is
apparent that the results are influenced by the measurement method, and this holds
for refined as well as WWF. What is interesting, though, is that general ranking of
samples did not change between the two methods. That is, the order of starch
damage from greatest to least within a wheat class was generally similar for both
methods.
Whereas the Megazyme method is considered a direct method for damaged starch
measurement, the amperometric method utilized by the SD-matic is indirect. Thus, a
slight algorithm correction to the SD-matic may be necessary to pull these results
into better alignment. Given the advantages of the SD-matic (shorter test time, fewer
reagents, less technical skill required), it is an acceptable means of differentiating
damaged starch content of WWF in industrially relevant settings.
9There are two points to pull from this methodological comparison:
1) The damaged starch values measured by each method do not agree in terms
of absolute value. However, the ranking of samples within a wheat class
remain generally consistent, showing that the results are correlated.
2) The addition of bran, regardless of particle size, results in a generally
consistent level of starch damage that is not necessarily greater than that of
the refined flour when an air classified grinding process is used to reduce
bran particle size.
Table 2. Damaged starch content of refined flour and reconstituted WWF
as measured by the SD-matic and Megazyme methods
SD-matic Megazyme
%
HWf 3.23±0.12e 4.04±1.06f
HWb53 3.70±0.12d 5.17±0.10de
HWb74 3.59±0.04d 5.08±0.04e
HWb105 3.39±0.11de 4.99±0.28e
HWb125 3.49±0.17de 4.98±0.16e
HRWf 5.92±0.07a 7.20±0.47a
HRWb53 5.45±0.17b 6.55±0.20b
HRWb74 5.74±0.14b 6.62±0.08b
HRWb105 5.92±0.26ab 6.73±0.15b
HRWb125 5.65±0.25b 6.58±0.15b
HRSf 4.35±0.12c 5.71±0.09c
HRSb53 4.23±0.11c 5.62±0.09cd
HRSb74 4.23±0.13c 5.61±0.10cd
HRSb105 4.27±0.05c 5.65±0.04c
HRSb125 4.04±0.10c 5.57±0.22cd
n=3 to 5
Values followed by the different letters in the same column are significantly
different (P < 0.05).
SRC profiles
SRC tests, including water SRC (W-SRC), lactic acid SRC (LA-SRC), sodium carbonate
SRC (SC-SRC), and sucrose SRC (Su-SRC), are shown in Table 3.
Water SRC (W-SRC) is influenced by the swelling of gluten, damaged starch, and
10pentosans (Kweon et al., 2011b), and it provides an overall picture of flour water
requirements. The W-SRC values increased with the addition of bran, but the values
were greater with smaller particle sizes. It is likely that the larger surface area to
volume ratio of smaller bran particles allowed for increased water uptake.
Lactic acid SRC (LA-SRC) is specific for swelling of gluten polymers, specifically
glutenins, with greater values indicating stronger gluten and/or greater protein
content. The protein contents of HWf, HRWf and HRSf were 13.77%, 12.36% and
15.66%, respectively, and the LA-SRC values were on the order of HRSf > HRWf >
HWf, indicating that although HWf has a higher protein content than HRWf, the
gluten strength is lower than HRWf. After adding bran, the LA-SRC values of all
classes decreased compared with their control groups. This indicates bran dilution of
gluten properties, and this may be exacerbated by bran interference with gluten
polymer swelling. Bran particle size did not greatly impact overall LA-SRC or gluten
performance index (GPI) values. It therefore appears that the effect of bran on LA-
SRC is more dependent on its presence rather than its particle size.
Sucrose SRC (Su-SRC) shows the characteristics of pentosans and, to a lesser extent,
gliadins. Su-SRC tracks with pentosans such that the lower the Su-SRC value, the
lower the pentosan content of the flour. The bran contains more pentosans than the
endosperm, and hence the reconstituted WWF have greater values than the control
flours. Different bran particle sizes did affect the value of Su-SRC, with smaller bran
particles showing increased Su-SRC values. The pentosans in smaller bran particles,
by virtue of the greater surface area to volume ratio, would be more accessible to
the solvent than those in larger bran particles. However, the exception was the HRW
WWF, where nearly all samples had similar Su-SRC values to the control.
Sodium carbonate SRC (SC-SRC) is related to the level of damaged starch, as only
damaged starch is accessible to the solvent relative to an intact starch granule. The
SC-SRC values of the control groups (HWf, HRWf and HRSf) show that the content of
damaged starch from low to high was HWf< HRSf< HRWf. This aligns with the starch
damage values reported in Tables 1 and 2. The reconstituted WWF SC-SRC values for
HW, HRW and HRS were greater than the control groups, in contradiction to the
damaged starch values reported in Tables 1 and 2. This indicates that both the SD-
matic and Megazyme methods may not be as accurate in measuring starch damage
in samples where bran is present, or that another component is also swelling in the
presence of SC.
11Table 3. SRC profiles of refined flour and reconstituted WWF
Sodium
Water Lactic acid Sucrose GPI*
carbonate
%, as-is
HWf 58.6±0.7f 155.3±8.9c 102.2±2.4g 71.7±0.7f 0.89±0.05c
HWb53 70.1±0.9b-d 116.0±2.0h 111.6±1.7e 80.6±1.0de 0.60±0.01i
HWb74 69.5±2.8b-d 116.0±2.1h 112.2±2.1e 79.4±0.6e 0.61±0.01hi
HWb105 68.6±0.4d 118.2±1.0h 111.4±1.6e 80.2±1.3e 0.62±0.01hi
HWb125 68.7±1.4d 118.2±2.3h 107.5±1.5f 79.8±0.9e 0.63±0.01hg
HRWf 62.0±0.7e 199.9±1.7b 116.2±1.5d 84.6±0.6c 1.00±0.01b
HRWb53 72.7±1.8a 138.3±1.5e-g 120.2±1.9ab 88.7±1.0b 0.66±0.01ef
HRWb74 71.4±1.3a-c 134.6±2.3fg 116.6±0.8d 90.5±1.0a 0.65±0.01fg
HRWb105 71.3±1.3a-c 136.3±1.9e-g 117.9±1.6b-d 88.7±0.5b 0.66±0.01ef
HRWb125 69.4±0.8cd 133.8±3.4g 117.0±2.0d 87.9±0.9b 0.65±0.01fg
HRSf 61.1±0.9e 208.5±3.2a 110.5±1.6e 81.9±1.3d 1.09±0.01a
HRSb53 71.5±1.6ab 142.4±3.5d 121.5±2.1a 87.4±1.7b 0.68±0.02de
HRSb74 70.4±1.0ab 139.7±3.6d-f 119.9±1.5a-c 87.5±0.4b 0.68±0.02d-f
HRSb105 70.4±0.8b-d 140.5±1.6de 117.5±1.3cd 88.7±1.2b 0.68±0.01de
HRSb125 69.3±0.9cd 141.5±2.6de 116.7±1.5d 87.8±0.7b 0.69±0.02d
n=3
Values followed by the different letters in the same column are significantly different
(P < 0.05).
* Gluten performance index (GPI)= Lactic acid SRC/(Sodium carbonate SRC + Sucrose
SRC)
Farinograph characteristics
Table 4 shows the Farinograph results for the refined flours and reconstituted WWF.
The water absorption (WA) of HW and HRS increased when 15% bran was added
compared with controls, but the both development time (DT) and stability (ST) for
the WWF were shorter. The HRW group proved the be the exception to this trend.
The WA of HRWf was 58.1% with a DT of only 2.2 minutes and a ST of 8.1 min. After
adding 15% bran, the water absorption increased, but DT and ST also tended to
increase with the size of the bran particles. It may be that HRW bran provided
structural reinforcement, thereby increasing dough resistance against the mixing
blades and delaying curve departure from 500 BU as observed by other researchers
(Marti et al., 2015; Peressini and Sensidoni, 2009).
12Table 4. Farinograph mixing properties for refined flour and reconstituted WWF
WA DT ST
%, as-is min min
HWf 56.2±0.0k 5.9±0.1b 9.7±1.0c-e
HWb53 64.3±0.1d 4.5±0.3de 5.7±0.1e
HWb74 63.5±0.0g 4.4±0.1de 8.4±1.2b-e
HWb105 63.2±0.0h 4.7±0.0de 8.3±1.9b-e
HWb125 63.2±0.0h 4.2±0.5e 6.0±1.3de
HRWf 58.1±0.2g 2.2±0.2f 8.1±0.5c-e
HRWb53 64.6±0.1c 4.3±0.6e 9.5±1.3a-c
HRWb74 64.2±0.0de 5.2±0.0b-d 11.5±2.0ab
HRWb105 63.8±0.0f 6.0±0.3b 12.2±0.4a
HRWb125 64.0±0.0ef 4.7±0.2de 11.0±0.6a-c
HRSf 61.0±0.0i 7.4±0.2a 11.0±1.5a-c
HRSb53 67.4±0.0a 5.6±0.6bc 8.9±1.9a-e
HRSb74 67.5±0.0a 5.0±0.8c-e 9.2±0.6b-e
HRSb105 67.1±0.4b 5.3±0.1b-d 8.1±2.8b-e
HRSb125 67.0±0.0b 5.2±0.4b-d 9.1±1.1a-e
n=3
Values followed by the different letters in the same column are significantly
different (P < 0.05).
Mixolab characteristics
Mixolab results for the refined and reconstituted WWF are shown in Table 5. C1
represents the time required for flour to reach peak development while stability
indicates how long the dough is stable during mixing at 30°C. These parameters are
somewhat analogous to DT and S in the Farinograph, although there are significant
differences between the tests (i.e. mixing geometry, mixing speed, total dough mass,
etc.) (Collar and Rosell, 2013). Similar to the results from the Farinograph, the
addition of bran to HRW resulted in an increase in C1 as well as the stability. HRS also
followed Farinograph trends, with the addition of bran resulting in slight decreases in
C1 and stability. HW broke from this pattern and exhibited slight increases in C1 and
stability with bran addition. In all cases, bran particle size distribution did not appear
to affect the overall results. What this indicates is that bran may have a reinforcing
effect on HRW doughs, whereas it is likely more destabilizing in HRS and HW doughs,
13likely as a result of different protein quantity and quality among the classes.
C2 is a low viscosity point in the curve that occurs when heating is initiated. It
typically occurs around ~50°C before starch begins to gelatinize, and it provides
information on gluten strength through thermally-induced restructuring of low
energy interactions (i.e. hydrogen bonds and/or hydrophobic interactions) (Dubat,
2013). The three refined flours grouped closely in terms of C2 values, revealing that
there are few differences among the classes in terms of gluten softening on heating.
However, the introduction of bran affected each class differently. HRS showed little
change on the addition of bran, which is in line with the gluten from HRS being
among the strongest among all U.S. wheat classes. HW showed small changes as
well, and although the changes appeared to be minimal as in the case of HRS, the
slightly larger average changes of C2 for HW on the whole indicate a weaker gluten
than that of HRS. HRW exhibited the greatest change in C2 values on the addition of
bran, suggesting that HRW has the weakest gluten of the three classes. It is worth
reiterating that the differences in C2 values among the classes is small, and that all of
them exhibit gluten quality that is appropriate and acceptable for hard wheat.
Points C3, C4 and C5 are related to starch pasting properties. C3 is the peak of the
viscosity curve during heating and is related to starch gelatinization and pasting
properties. Again, all three wheat classes clustered between 1.63 – 1.93 Nm. HRW
starch appeared to be the least affected by the presence of bran. Indeed, the C3
value was almost constant across the whole HRW sample set. HRS and HW showed
small increases in C3 values when bran was present, although the differences were
not practically significant.
C4 is the lowest viscosity point after the C3 peak, and it generally coincides with the
cooling phase of the test. In many cases, it is regarded as an indication of amylolytic
activity. However, as the grain samples all exhibited Falling Number values in excess
of the 300 sec threshold and no exogenous amylase was added after milling, the C4
value in this study is related to shear thinning of the dough after starch
gelatinization. HRS and HRW both showed more substantial drops in C4 values
relative to their respective C3 values compared to HW. Although bran particle size did
not affect C4 values, the wheat class differences show HW to be slightly more
resistant to shear thinning than HRW and HRS.
Retrogradation potential is indicated by the C5 value, also called setback in starch
pasting terminology. This is the final viscosity at the end of the test after a full
14heating and cooling cycle. HW exhibited the greatest setback value, meaning that its
amylose more quickly reassociates after gelatinization. This has implications for
texture and shelf-life of products, with greater setbacks generally leading to firmer
textures and greater rates of staling (i.e. shorter shelf-life). It might be expected,
then, that HW products will potentially stale faster than HRS or HRW products.
Table 5. Mixolab characteristics of refined flours and reconstituted WWF
C1 Stability C2 C3 C4 C5
Min Nm
HWf 3.88 8.00 0.46 1.79 1.72 3.47
HWb53 4.32 8.70 0.48 1.88 1.72 3.13
HWb74 4.90 8.60 0.52 1.91 1.78 3.34
HWb105 4.28 8.70 0.49 1.93 1.78 3.40
HWb125 4.98 8.70 0.48 1.93 1.77 3.30
HRWf 1.93 9.20 0.49 1.89 1.44 2.74
HRWb53 4.30 10.60 0.54 1.90 1.44 2.74
HRWb74 5.87 10.40 0.53 1.89 1.39 2.72
HRWb105 5.32 10.20 0.53 1.89 1.39 2.75
HRWb125 5.42 10.10 0.52 1.89 1.38 2.65
HRSf 5.75 8.80 0.43 1.63 1.24 2.40
HRSb53 5.05 8.00 0.46 1.71 1.31 2.53
HRSb74 5.22 7.90 0.44 1.69 1.30 2.49
HRSb105 5.20 8.00 0.45 1.70 1.29 2.51
HRSb125 5.00 8.70 0.46 1.71 1.31 2.53
n=3
15Fig. 2. Mixolab curves of refined flours and reconstituted WWF
Extensibility of steamed bread doughs
Table 6 displays the extensibility results of full formula steamed bread dough from
refined flours and reconstituted WWF. HRSf showed the greatest extensibility value
among the control flours. Although HWf and HRWf displayed less extensibility than
HRSf, they were more statistically similar to one other and in the same general range
as HRSf. The addition of bran reduced extensibility across all wheat classes. Bran is
known to physically interrupt the gluten network, introducing localized weak spots;
this results in premature rupturing of the dough during extensibility testing. In the
cases of HRW and HW, the bran particle size did not appear to play a large role in the
extent of extensibility loss. However, HRS showed a trend of greater extensibility loss
as bran particle size increased, likely as a result of larger bran particle introducing
larger localized disruptions of the gluten network. The general lack of response to
bran particle size in the HW and HRW samples may be a function of protein content
and/or gluten relaxation kinetics in the presence of bran.
The resistance to extension is generally used as a proxy for gluten strength in flour +
water doughs, although it is not as straightforward in full formula doughs. HWf stood
out among the control flours for displaying the least resistance to extension. This is
interesting given its apparent strength in Farinograph and Mixolab tests. HRSf was
expected to exhibit the greatest resistance to extension through a combination of
having the greatest protein content and strength. However, in this dough formula, it
falls between HWf and HRWf. Being the weakest of the control flour samples in
16Farinograph and Mixolab testing, it was surprising to see HRWf provide the greatest
resistance to extension. The departure of the three wheat classes from expected
trends is likely a result of ingredient interactions in the full formula dough.
Interestingly, HRW samples still stand out from HRS and HW samples in terms of bran
particle size trends. Increasing bran particle size resulted in a decrease in HRW
resistance to extension. HW and HRS exhibited the opposite trend, in this case
exhibiting greater resistance to extension with increasing bran particle size. In
general, it may be that smaller bran particles create multiple small points of
weakness in the gluten network, and these may add up to a greater decrease in
overall resistance. It is unclear why the classes exhibited different trends with bran
particle size, although HRW samples also deviated from HRS and HW samples in
Farinograph and Mixolab characteristics. Thus, it seems likely to be related to gluten
protein characteristics based on overall class genetics.
The resistance to extension (R/E) value shows the balance of elastic to viscous
properties of the dough after relaxation. The larger the R/E value, the stronger the
gluten and/or less the extensibility (Preston and Hoseney, 1991). The HRW samples
showed the greatest R/E values compared to the HRS and HW samples. This shows
that HRS and HW maintain slightly more extensibility relative to a similar amount of
strength compared to HRW. Although we have not identified an optimal R/E value for
whole wheat steamed bread, it seems likely that HRS and HW might produce
steamed bread of greater specific volume based on their respective extensibilities
while the resistance exhibited by HRW may limit expansion.
Table 6. Extensibility of steamed bread dough made from refined flour and
reconstituted WWF
Resistance to
Extensibility
Extension R/E
g mm
HWf 19.61±2.11g 41.83±10.03b 0.51±0.24g
HWb53 20.76±1.81g 19.76±2.64gh 1.06±0.13de
HWb74 20.54±1.46g 19.88±3.64gh 1.07±0.22de
HWb105 23.85±2.64f 21.83±10.41gf 1.18±0.26d
HWb125 25.70±1.56de 19.45±3.12gh 1.35±0.18c
HRWf 30.66±4.00b 38.17±6.95c 0.85±0.30g
HRWb53 33.22±1.69a 17.59±1.40h 1.90±0.19a
HRWb74 26.17±3.76de 17.40±2.25h 1.54±0.37b
HRWb105 25.83±2.21de 17.65±3.43h 1.53±0.43b
17HRWb125 25.85±2.16de 17.95±3.64gh 1.48±0.23bc
HRSf 28.37±3.76c 47.22±5.81a 0.61±0.14g
HRSb53 25.27±1.38d-f 29.74±4.15d 0.86±0.11f
HRSb74 25.14±2.18ef 28.07±4.71de 0.92±0.18ef
HRSb105 27.06±0.93cd 26.32±2.74de 1.04±0.11de
HRSb125 34.74±3.19a 24.53±2.07ef 1.43±0.18bc
n=3
Values followed by the different letters in the same column are significantly
different (P < 0.05).
Steamed bread specific volume
Table 7 displays the specific volume data for steamed breads made from refined
flours and reconstituted WWF. The order of specific volumes for steamed breads
from the control flours was HWf > HRSf > HRWf (2.92, 2.61 and 2.48 cc/g,
respectively), although these differences are not statistically significant within this
data set. The addition of bran universally resulted in decreased specific volume
across all classes. A clear trend was also observed for bran particle size, with smaller
bran particle sizes exhibiting a smaller specific volume. When compared with the
specific volume of their respective control flours, HWb125 decreased by 16.4%,
HRWb125 decreased by 6.0%, and HRSb125 decreased by 11.9%, respectively.
Therefore, combined with the results in Tables 4 – 6, it can be understood that bran
with a smaller particle size may be more likely to affect the formation of the network
structure during dough mixing and thereby decrease extensibility and gas retention
of the dough to the extent that the specific volume of the end product is affected.
Steamed bread made with a bran particle size distribution mean of 125μm is able to
achieve larger specific volumes across all wheat classes.
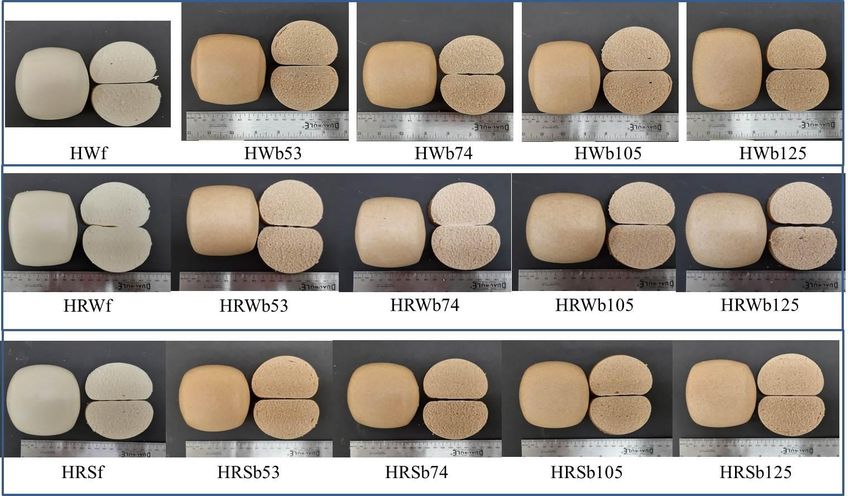
Fig 3-5 show the exterior and interior of the northern steamed breads from each
refined flour and reconstituted WWF.
Table 7. Specific volume of steamed breads made from
refined flours and reconstituted WWF
Relative change in
Specific Volume
specific volume
cc/g
%
HWf 2.92 ± 0.04a ─
HWb53 2.28 ± 0.07c -21.9
HWb74 2.16 ± 0.09d -26.0
18HWb105 2.38 ± 0.06b -18.5
HWb125 2.44 ± 0.02b -16.4
HRWf 2.48 ± 0.04a ─
HRWb53 2.22 ± 0.05c -10.5
HRWb74 2.31 ± 0.06b -6.9
HRWb105 2.27 ± 0.04b -8.5
HRWb125 2.33 ± 0.08b -6.0
HRSf 2.61 ± 0.04a ─
HRSb53 2.13 ± 0.06d -18.4
HRSb74 2.14 ± 0.07d -18.0
HRSb105 2.21 ± 0.05c -15.3
HRSb125 2.30 ± 0.08b -11.9
n=3
Values followed by the same letter in the same column and wheat class
are not significantly different (P < 0.05)
Fig. 3. Steamed breads made from refined flours and reconstituted WWF
19Fig. 4. Steamed breads made from refined flours and reconstituted WWF
20Fig. 5. Steamed breads made from refined flours and reconstituted WWF
21Steamed bread color
Table 8 shows the L, a, b, and whiteness index (WI) for the steamed breads. In all
cases, the reconstituted WWF L and WI were lower than those of the control flours.
Smaller bran particle sizes resulted in lower L and WI values than those from larger
bran particle sizes. This may be related to differences in specific volume as larger
volumes tend to result in brighter, whiter color.
Table 8. Color of steamed bread made from refined flour and reconstitution WWF
L a B WI*
HWf 91.55±0.65a -2.03±0.05g 17.55±0.10i 80.41±0.32a
HWb53 70.11±0.64d 6.45±0.10cd 24.13±0.21e 61.05±0.57e
HWb74 70.97±0.86cd 6.75±0.24b 24.58±0.47cd 61.36±0.97de
HWb105 71.75±0.24bc 6.05±0.08e 23.37±0.12f 62.84±0.25c
HWb125 68.65±1.93e 6.53±0.10c 23.50±0.31f 60.26±1.38ef
HRWf 91.12±0.47a -2.19±0.03g 19.00±0.50g 78.91±0.60b
HRWb53 69.90±0.71d 7.13±0.06a 25.61±0.23a 59.84±0.41f
HRWb74 69.97±0.79d 6.84±0.15b 25.00±0.12b 60.33±0.68ef
HRWb105 72.06±0.87bc 6.38±0.11cd 24.37±0.19de 62.38±0.67cd
HRWb125 71.86±0.59bc 6.44±0.12cd 24.23±0.22de 62.31±0.54cd
HRSf 90.48±0.29a -1.76±0.04f 18.59±0.33h 79.04±0.39b
HRSb53 70.77±0.79cd 6.83±0.16b 24.90±0.23bc 61.00±0.72e
HRSb74 70.27±0.59d 6.74±0.12b 24.61±0.16b-d 60.82±0.53ef
HRSb105 72.54±0.54b 6.32±0.13d 24.15±0.22e 62.89±0.53c
HRSb125 71.75±1.20bc 6.45±0.15cd 24.15±0.16e 62.27±0.97cd
n=5
Values followed by the different letters in the same column are significantly different
(P < 0.05)
*Whiteness index (WI) = 100 – ((100 – L)2 + a2 + b2)0.5
Values followed by the same letter in the same row are not significantly different (P <
0.05)
Steamed bread texture profile analysis
The textural characteristics of steamed breads as determined by texture profile
22analysis (TPA) analysis are shown in Table 9. All steamed breads from reconstituted
WWF showed greater firmness and chewiness than their respective refined flours.
The HRW samples displayed a trend towards increasing firmness and chewiness as
bran particle size decreased and loosely aligns with specific volume trends. However,
neither the HW nor the HRS groups demonstrated such a consistent trend in terms of
bran particle size and texture. And while HWb125, HRWb125 and HRSb125 all
showed larger specific volumes among the reconstituted WWF steamed breads,
there was no significant correlation to the texture values.
Looking through a different lens, the greatest firmness was observed in HW and HRW
samples. The protein content of HRSf was 15.66%. Adding bran or other materials in
refined flour affects the formation of the gluten network during the dough mixing.
For refined flour with lower protein content, bran has a more negative effect on the
end product. It can therefore be speculated that HRS, with its naturally greater
protein content and strong, extensible gluten characteristics, is more capable of
overcoming the deleterious impact of brain in whole wheat steamed bread than
either HW or HRW.
Table 9. Texture profile analysis of steamed breads made from refined flours and
reconstituted WWF
Firmness (g) Springiness Cohesiveness Chewiness Resilience
HWf 825.4 ± 34.5d 0.8 ± 0.03a 0.7 ± 0.01a 457.6 ± 21.7d 0.3 ± 0.01a
HWb53 1694.3 ± 81.8b 0.8 ± 0.02a 0.6 ± 0.01a 847.4 ± 35.9b 0.2 ± 0.01a
HWb74 1843.9 ± 85.5a 0.8 ± 0.01a 0.6 ± 0.03a 930.9 ± 20.0a 0.2 ± 0.01a
HWb105 1461.3 ± 66.5c 0.8 ± 0.02a 0.6 ± 0.01a 743.8 ± 34.3c 0.2 ± 0.01a
HWb125 1696.1 ± 78.8b 0.8 ± 0.01a 0.6 ± 0.01a 851.2 ± 35.3b 0.2 ± 0.01a
HRWf 1138.9 ± 54.4d 0.8 ± 0.03a 0.7 ± 0.02a 602.7 ± 30.2c 0.3 ± 0.01a
HRWb53 1869.9 ± 85.0a 0.8 ± 0.02a 0.6 ± 0.01a 786.4 ± 38.3a 0.2 ± 0.01a
HRWb74 1626.5 ± 59.4b 0.8 ± 0.02a 0.6 ± 0.01a 753.9 ± 19.1ab 0.2 ± 0.01a
HRWb105 1590.6 ± 79.0b 0.8 ± 0.03a 0.6 ± 0.01a 731.2 ± 33.9b 0.2 ± 0.01a
HRWb125 1487.2 ± 62.0c 0.8 ± 0.02a 0.6 ± 0.01a 734.6 ± 39.2b 0.2 ± 0.01a
HRSf 795.9 ± 39.1d 0.9 ± 0.02a 0.7 ± 0.01a 480.7 ± 18.7c 0.3 ± 0.01a
HRSb53 1485.6 ± 67.0ab 0.8 ± 0.02a 0.6 ± 0.01a 757.1 ± 26.3b 0.2 ± 0.02a
HRSb74 1310.3 ± 40.0c 0.8 ± 0.04a 0.6 ± 0.01a 701.7 ± 30.2b 0.2 ± 0.01a
23HRSb105 1541.5 ± 70.6a 0.8 ± 0.01a 0.6 ± 0.01a 794.1 ± 20.9a 0.2 ± 0.01a
HRSb125 1412.2 ± 57.1b 0.8 ± 0.01a 0.6 ± 0.01a 725.6 ± 27.0b 0.2 ± 0.01a
n=5 to 8
Values followed by the same letter in the same column and wheat class are not significantly
different (P < 0.05)
Conclusions
In the same class of wheat, adding 15% bran with bran particle size distributions
between 53μm to 125μm increased the water absorption and decreased DT and ST
for HW and HRS samples. HRW did not follow the same trends as HW and HRS, likely
due to differences in gluten characteristics.
The TPA test showed that adding 15% bran affects the firmness and chewiness of
steamed bread, but a clear trend was not discernable across all classes. This may be
related to a number of factors including wheat class, protein content and quality, and
ingredient interactions in the full formula dough.
Other research has shown that smaller bran particle sizes can adversely affect bread
quality. In this study, larger bran particle size distributions (105 μm and 125 μm) are
recommended for whole wheat steamed bread production in order to obtain
steamed breads with a larger specific volume and softer texture.
Future work
This study utilized reconstituted whole wheat flours to control variability stemming
from attempting to combine different ratios of bran and shorts from the wheat
classes studied. Future work should attempt to investigate whole wheat flours that
contain all the bran and shorts.
Additionally, the conditions of steamed bread production were optimized and held
constant throughout the study. Because there are many ways of producing steamed
bread, it is recommended to optimize and study different production conditions
according to their popularity in the commercial baking industry.
Acknowledgements
Ms. Huang would like to acknowledge the Idaho Wheat Commission and the
Montana Wheat and Barley Committee for sponsoring her visiting scholar program;
the CGPRDI for allowing her to participate in the program; and WMC staff for their
assistance with her project and report.
24References
AACC International. (1999). Method 44-15A: Moisture air oven methods. In
Approved methods of the American Association of Cereal Chemists. 11th ed.
Am. Assoc. Cereal Chem., St. Paul, MN.
AACC International. (1999). Method 08-01: Ash—basic method. In Approved
methods of the American Association of Cereal Chemists. 11th ed. Am. Assoc.
Cereal Chem., St. Paul, MN
AACC International. (1999). Method 46-30: Crude protein—combustion method. In
Approved methods of the American Association of Cereal Chemists. 11th ed.
Am. Assoc. Cereal Chem., St. Paul, MN.
AACC International. (1999). Method 08-01: Ash—basic method. In Approved
methods of the American Association of Cereal Chemists. 11th ed. Am. Assoc.
Cereal Chem., St. Paul, MN.
AACC International. (2000). Approved Methods of the American Association of Cereal
Chemists. 10. ed. Saint Paul: Approved Methods Committee.
AACC International. (2009). Method 56-11.02: Solvent retention capacity profile. In
Approved methods of the American Association of Cereal Chemists. 11th ed.
Am. Assoc. Cereal Chem., St. Paul, MN.
AACC International. (2011b). Method 54-21.01: Farinograph method for flour. In
Approved methods of the American Association of Cereal Chemists. 11th ed.
Am. Assoc. Cereal Chem., St. Paul, MN.
Bi, N., Xie, Y, Zhoa, W. (2014). Effect of wheat bran addition On rheological properties
of dough and steamed bread quality. Journal of Cereal and Feed Industry, 2, 28-
30.
Bock, J.E. (2019). The structural evolution of water and gluten in refined and whole
grain breads: a study of soft and hard wheat breads from postmixing to final
product. Cereal Chemistry, 96, 520-531.
Bock, J.E., Connelly, R.K., Damodaran, S. (2013). Impact of bran addition on water
properties and gluten secondary structure in wheat flour doughs studied by
attenuated total reflectance Fourier transform infrared spectroscopy. Cereal
Chemistry, 90, 377-386.
Bock, J.E., Damodaran, S. (2013). Bran-induced changes in water structure and gluten
conformation in model gluten dough studied by Fourier transform infrared
spectroscopy. Food Hydrocolloids, 31, 146-155.
Chen, J. S., Fei, M. J., Shi, C. L., Tian, J. C., Sun, C. L., Zhang, H., et al. (2011). Effect of
particle size and addition level of wheat bran on quality of dry white Chinese
noodles. Journal of Cereal Science, 53, 217-224.
25Chen, R. (2018). Value-added Nutrition for Wheat Bran. Journal of Food Industry,
50(1):66-74.
Collar, C., Rosell, C. (2013). Relationship between the Mixolab and other devices. In:
Mixolab: a new approach to rheology. Eds: Dubat, A., Rosell, C.M., Gallagher, E.
AACC International, St. Paul, MN. pp 23-30.
Dubat, A. (2013). The Mixolab. In: Mixolab: a new approach to rheology. Eds: Dubat,
A., Rosell, C.M., Gallagher, E. AACC International, St. Paul, MN. pp 3-13.
Gan, Z., Ellis, P.R., Vaughan, J.G., Galliard, T. (1989). Some effects of non-endosperm
components of wheat and added gluten on whole-meal bread microstructure.
Journal of Cereal Science, 10, 81-91.
Liu, C., Liu, L., Li, L., Hao, C., Zheng, X., Bian, K., et al. (2015). Effects of different
milling processes on whole wheat flour quality and performance in steamed
bread making. LWT-Food Science and Technology, 62, 310-318.
Londono, D. M., Smulders, M. J. M., Visser, R. G. F., Gilissen, L. J. W. J., Hamer, R. J.
(2014). Development of a standard test for dough-making properties of oat
cultivars. Journal of Cereal Science, 59, 56-61.
Keskin, S., Ozkaya, H. & Turksoy, S. (2012). Effects of damaged starch on
physicochemical properties of wheat flour and its bread making potential.
Akademik Gıda, 10, 14–18.
Kweon, M., Slade, L., Levine, H. (2011). Solvent retention capacity (SRC) testing of
wheat flour: principles and value in predicting flour functionality in different
wheat-based food processes and in wheat breeding: a review. Cereal Chemistry,
88, 537-552.
Marti, A., Qiu, X., Schoenfuss, T.C., Seetharaman, K. (2015). Characteristics of
perennial wheatgrass (Thinopyrum intermedium) and refined wheat flour
blends: impact on rheological properties. Cereal Chemistry, 92, 434-440.
Peressini, D., Sensidoni, A. (2009). Effect of soluble dietary fibre addition on
rheological and breadmaking properties of wheat doughs. Journal of Cereal
Science, 49, 190-201.
Preston, K. R. and Hoseney, R. C. (1991). Application of the extensigraph. In: The
extensograph handbook. Eds: Rasper, V.F., Preston, K.R. AACC International, St.
Paul, MN. pp 13-19.
Shen, R., Dong, J., Cheng, S., He, J. (2009). Farinogragh and extensigraph of bran flour
dough. Journal of Transactions of the Chinese Society of Agricultural
Engineering, Z1:237-240.
Wang, N., Hou, G. G., Kweon, M., Lee, B. (2016). Effects of particle size on the
properties of whole-grain soft wheat flour and its cracker baking performance.
Journal of Cereal Science, 69, 187-193.
26Yang, C., (2020, June 5). Message posted to
https://www.moea.gov.tw/Mns/dos/bulletin/Bulletin.aspx?kind=9&html=1&me
nu_id=18808&bull_id=7365
27You can also read