How we forecast income tax - May 2021 fiscalcommission.scot - Scottish Fiscal Commission
←
→
Page content transcription
If your browser does not render page correctly, please read the page content below
How we forecast income tax
May 2021               fiscalcommission.scot
© Crown copyright 2021

This publication is licensed under the terms of the Open Government Licence v3.0 except where otherwise
stated. To view this licence, visit: http://www.nationalarchives.gov.uk/doc/open-government-
licence/version/3/ or write to the Information Policy Team, The National Archives, Kew, London TW9 4DU,
or email: psi@nationalarchives.gsi.gov.uk

Where we have identified any third party copyright information you will need to obtain permission from the
copyright holders concerned.

This publication is available at www.fiscalcommission.scot

Any enquiries regarding this publication should be sent to us at: Scottish Fiscal Commission, Governor’s
House, Regent Road, Edinburgh EH1 3DE or info@fiscalcommission.scot

ISBN: 978-1-911637-33-2

Published by the Scottish Fiscal Commission, May 2021
Foreword
As Scotland’s independent forecaster, the Commission is committed to openness and transparency in all of
our work. We regularly produce reports to inform users of our forecasts about the approaches used to
develop them. This report sets out our approach to forecasting income tax.

The report is intended for a general audience, so we have endeavoured to capture the most important
aspects of each forecast model, alongside the most important assumptions we have to make during the
creation of our forecasts. Readers who are interested in additional details of our models can get in touch
with us directly by e-mailing info@fiscalcommission.scot.

By being transparent in our forecasting, we aim to help people interested in our forecasts understand how
they are constructed, and we welcome any feedback to help us improve them.

                 Dame Susan Rice DBE                            Professor Francis Breedon

                Professor Alasdair Smith                         Professor David Ulph

26 May 2021

                                                                                                       1
Contents
Foreword............................................................................................................................................ 1
Chapter 1 Overview of methodology.................................................................................................... 3
Chapter 2 Economic determinants forecast ......................................................................................... 5
Chapter 3 Scottish income tax micro-simulation model ........................................................................ 7
Chapter 4 RTI alignment and other adjustments ................................................................................ 10
Chapter 5 Policy costings and behaviour ........................................................................................... 13
Additional information ....................................................................................................................... 22
2Chapter 1
Overview of methodology
Background to income tax
1.1 Income tax is partially devolved. Non-savings and non-dividend (NSND) income tax rates and bands
are controlled and determined by the Scottish Parliament. These powers were transferred to the
Scottish Parliament via the Scotland Act 2016. The UK Government is responsible for setting or
changing income tax reliefs, defining the income tax base and setting the personal allowance.
1.2 The main sources of NSND income are pension income, employment income, profits for the self-
employed and income from property.
1.3 Her Majesty’s Revenue and Customs (HMRC) is responsible for the collection and management of
Scottish income tax. The Scotland Act 2012 defines a Scottish taxpayer as someone who is a UK
taxpayer and has their main place of residence in Scotland. We expect income tax in Scotland will
raise around £12 billion in 2021-22.
1.4 This paper will set out our approach to forecasting income tax. In the remainder of this chapter we
provide an overview of the key steps involved in producing a forecast. Subsequent chapters will
explain each of these steps in greater detail.
Modelling approach
1.5 Figure 1.1 provides an overview of our income tax forecasting process. The process centres on our
Scottish Income Tax Micro-Simulation Model (SITM). There are four main inputs to the SITM model:
• Forecasts of growth in earnings, employment and the population from our main economy forecasts
(see Chapter 2).
• Detailed micro-data on Scottish taxpayers from the Survey of Personal Incomes (SPI), adjusted for
the latest outturn data (see Chapter 3).
• Scottish income tax policy parameters, including the income tax rates and bands (see Chapter 3).
• Additional information on expected changes in incomes from the OBR, for example on savings,
dividends and pensions (see Chapter 3).
1.6 SITM takes the latest data on Scottish taxpayers from the SPI and grows the forecast earnings and
number of taxpayers in line with our economic determinants and those from the OBR. This gives us
a forecast of the distribution of taxpayers by income. We then apply Scottish income tax policy
parameters to forecast the amount of NSND income tax paid on this income. This is covered in
detail in Chapter 3.
1.7 There are other factors which affect Scottish income tax revenues that we cannot capture directly in
SITM. These factors include certain reserved UK tax policies, information on tax induced
3incorporations, gift aid and real time information from HMRC. Once we have our income tax revenue
estimate from SITM we make some further adjustments for these factors. This is covered in further
detail in Chapter 4.
1.8 We also take account of any announced changes in Scottish Government income tax policy. We do
this in two stages. In the first stage we assume that any change in policy has no effect on the
number of Scottish taxpayers or their incomes and hence on the distribution of these incomes
across the proposed new tax bands. We can then mechanically calculate the amount of tax revenue
raised and compare it to the baseline revenue calculated. This gives us what we call a static costing
of the policy change. In the second stage we allow for the possibility that the changes in tax policy
might cause some behavioural changes – for example tax migration, tax planning or changes in
work incentives, which may alter the distribution of income across tax bands. Taking these into
account enables us to produce the full costing of the policy changes. This process is covered in
detail in Chapter 5.
Figure 1.1: Schematic of the income tax forecast model
SFC Economic
determinants
(earnings, Behavioural
employment, effects
population) model
Outturn aligned
SPI data Scottish
Final
Income NSND
adjustments
Tax Micro- income tax
simulation (Gift aid,
Policy forecast
Model RTI data)
parameters
Additional OBR
determinants
(savings,
dividends,
pensions)
Source: Scottish Fiscal Commission
4Chapter 2
Economic determinants forecast
Introduction
2.1 The three main economic determinants used to produce the income tax forecast are population,
employment and income. This chapter describes where our forecasts of population, employment
and incomes come from. Chapter 3 explains how these forecasts are used in our income tax
forecasts.
Forecast of income by type
2.2 Each of these types of incomes can grow differently over time, and so we use different
methodologies to forecast each type. Figure 2.1 highlights the different types of income in our
model, and where they are sourced from.
Figure 2.1: Type and source of income streams
Type of income Source of income stream
Income from employment – private sector (including SFC economy earnings private sector
self-employment) forecast
Income from employment – public sector SFC economy earnings public sector
forecast
Calculated from the OBR Triple Lock state
State pension income
pension forecast
Calculated from historic SPI growth of
Occupational, personal or other pension income
pension income
SFC economy earnings private sector
All other income excluding savings and dividends
forecast
Source: Scottish Fiscal Commission
2.3 Income from employment (including Self-Employment) is by far the largest source of income,
accounting for around 77 per cent of all income. Forecasts of employment and earnings come from
our economy forecast model. Alongside this paper, we have published an updated guide to how we
forecast the Scottish economy, which provides further information on how we forecast employment
and earnings. 1
2.4 For growth in income from employment, we can use forecasts directly from the economy team.
Income from employment is further split by private and public sector, both in our economy forecasts
and in our income tax model. We also use growth in private sector earnings as a proxy for growth in
other income types otherwise not covered, including income from property rental. This is a feature of
our modelling that we may revise if adequate data becomes available.
1
Scottish Fiscal Commission (2021) How w e forecast the Scottish economy – May 2021 (link)
52.5 The UK state pension is a reserved policy area, and the state pension is set at the UK level.
Therefore, to forecast growth in income from the state pension in Scotland we use the OBR’s state
pension forecast.
2.6 Occupational, personal and other pensions will be affected by factors such as annuity rates and
stock market performance at the UK level. We do not produce separate Scottish forecasts of these
factors. When calculating occupation, personal or other pension income we use the historic growth
from the SPI.
Forecast of the number of taxpayers
2.7 Our forecast of the number of Scottish taxpayers includes a breakdown by age allowing our forecast
to take into account Scotland’s changing demographics and labour market trends. This is important
as average incomes and therefore income tax paid can vary significantly across age groups. In
recent years the working age population has been shrinking in Scotland, and this trend is expected
to continue, exacerbated by COVID-19. We capture this change in the Scottish population in our
income tax forecasts.
2.8 The inputs which are used to develop the number of taxpayers forecast are:
• Population projections by year of age
• Unemployment rate by year of age
• Participation rate by year of age
• Economy employment forecast
2.9 We combine these to produce a forecast of employment levels for the 16-64 age groups. This is
used as a proxy to forecast the number of taxpayers by age. For the over 65 age group the
population is only grown in line with our population projections. The growth rate in the number of
taxpayers by age is calculated and used in the model described in the next chapter.
2.10 Prior to our January 2021 forecast our Scottish population projections were based on the available
Office for National Statistics (ONS) population variants. From January 2021 we have been using our
own bespoke population projections made in-house. At each forecast we make assumptions about
mortality, fertility and migration. These assumptions will be guided in-part by the available ONS
population projection variants, but we’ll also make additional assumptions to reflect recent events or
changes in trends, such as the effect of COVID-19.
6Chapter 3
Scottish income tax micro-
simulation model
Introduction
3.1 We use our Scottish income tax micro-simulation model (SITM) to produce a detailed baseline
forecast of the distribution of taxpayers, their incomes and their tax liabilities.
3.2 There are four main inputs into SITM:
• Detailed Survey of Personal Incomes (SPI) data, adjusted for outturn
• The growth rate of income by type (discussed in Chapter 2)
• The growth rate of the number of taxpayers by age (discussed in Chapter 2)
• Scottish income tax baseline and policy parameters
The Survey of Personal Incomes
3.3 The SPI is a single consistent source of income tax data created by HMRC. The SPI is a one per
cent to two per cent sample of all HMRC income tax taxpayer records for each tax year. It contains
over 40,000 individual taxpayer records for Scotland. The SPI provides details at the individual
taxpayer level, of income by source and allowances, deductions and reliefs. These individual
taxpayer records are then grossed up to get values for the whole of Scotland.
3.4 The Commission uses a publicly available version of the SPI called the Public Use Tape (PUT). The
PUT is an anonymised version of the SPI with some records grouped together to prevent any
private information being disclosed. This is the primary resource for income tax analysis and is used
by the OBR for income tax forecasts and policy costings. We always use the PUT data for the most
recently available tax year, though there is a lag in the availability of the data of around 13 months
after the end of the tax year. In our January 2021 forecast the most recently available PUT data
were from tax year 2017-18.
3.5 HMRC NSND income tax outturn data is the definitive value of income tax in Scotland, and the
outturn data is what the Scottish Budget is based on. Although the outturn data provide the correct
value of total income tax in Scotland, they do not contain the detailed taxpayer distribution
information we need to run SITM, which instead comes from the PUT. As the PUT is based on a
sample, there are differences between the total income tax liabilities in Scotland implied by the PUT
and the official outturn estimate. We therefore align the latest available PUT to the latest available
outturn data. To align the PUT we use a ‘bottom-up’ method that:
• aligns the number of taxpayers by tax band in the PUT to the number of taxpayers in the outturn
data
• adjusts the remaining difference in tax revenues between the two data sources through scaling
taxpayer earnings in the PUT
73.6 For our February 2021 forecast we aligned the 2017-18 PUT with 2018-19 outturn income tax data.
SITM: Applying earnings and taxpayer
growth forecasts
3.7 For each taxpayer record in the PUT, SITM grows each type of income in line with the growth
forecast described in Chapter 2.
3.8 As described above the PUT includes a sample of all Scottish taxpayers, with each record being
representative of a number of taxpayers. Each record has a grossing factor which can be used to
scale the PUT up to whole population values. To reflect changes in the number of taxpayers over
time, we apply the projected population and employment growth rates from chapter 2 to the grossing
factor for each record, depending on the age group of the record. For example, a single record in
age group 25-34 in the PUT might have a grossing factor of 12, meaning it represents 12 taxpayers
aged 25-34. If we think the cohort of taxpayers aged 25-34 is going to grow by 1 per cent, we’d
increase the grossing factor by 1 per cent to 12.12. Applied across all records, this results in
changes in the total population of taxpayers, and also changes in the distribution of taxpayers by
different age groups.
3.9 By applying growth in earnings and taxpayer population forecasts to each PUT record, SITM creates
a new version of the PUT for each forecast year.
SITM: tax calculation
3.10 Once we have a new PUT within SITM for each forecast year detailing individual taxpayer incomes,
we can then apply separate tax parameters for each year of the forecast to create an estimate of
total income tax revenues. The SITM tax calculator has several stages:
Reliefs and deductions: We first allocate total income into NSND, savings income and
dividend income. Reliefs and deductions are then taken from total income. Pension
contributions, Gift Aid and various investments are some of the reliefs and deductions which
are removed.
Personal Allowance: The Personal Allowance is the amount of income an individual is
allowed to receive without paying income tax. For 2021-22 the personal allowance is set at
£12,570. The Personal Allowance reduces by £1 for every £2 that the gross income is above
£100,000. After a gross income of £125,140 the Personal Allowance is zero. The income tax
calculator accounts for the personal allowance and tapering.
Liabilities: Different liabilities are calculated including gross NSND tax liability, savings tax
liability, gross dividend liability and net tax liability. Income sources must be allocated into
their respective types, with NSND processed first followed by savings income and finally
dividend income.
Non-savings and non-dividend income: Taxable NSND income tax in Scotland is split
into rates and bands. The rates and bands for each year of the forecast are used by the tax
calculator to calculate the amount of income tax from an individual’s tax liabilities.
8 Tax credits: While reliefs and deductions are reductions of the tax base, tax credits are a
reduction in total income tax liabilities. Examples of tax credits include Venture Capital
Trusts, Community Investment tax relief and Enterprise Investment Schemes. The PUT data
provides individual taxpayer tax credit data. The tax calculator uses this tax credit data and
reduces the gross tax liabilities, producing net tax liabilities. The tax credit allocation is
apportioned across NSND income tax, savings and dividends. As a result of this
apportionment, our model also calculates a taxpayers savings and dividends liabilities.
3.11 The tax calculator repeats these calculations to estimate NSND income tax liabilities for each
PUT taxpayer for each forecast year. These individual tax liability estimates can then be scaled
up to whole population values using the forecast grossing factors.
9Chapter 4
RTI alignment and other
adjustments
Introduction
4.1 SITM provides a baseline forecast of income tax liabilities and the number of taxpayers. However,
there are additional factors that cannot be easily captured in SITM, which include:
• Real-time Information (RTI) data alignment
• Tax Motivated Incorporations (TMI)
• Gift Aid
• Self-Assessment settlements
• UK reserved policies
4.2 This chapter explains why and how we adjust our baseline SITM forecast for each of these factors.
Real Time Information (RTI) tax alignment
4.3 HMRC publish RTI income tax revenue data, RTI earnings data, and Scottish outturn income tax
data.2 All of the RTI data are full administrative data, and not a survey-based estimate such as the
SPI. But in contrast to the SPI, these data are aggregated and so can’t be directly applied to our
SITM. We are particularly interested in the RTI tax revenue data which are a much more timely
source of information. For example, at the time of developing our January 2021 forecast, th e latest
Scottish outturn tax data were for the year 2018-19, in comparison to RTI tax data that were
available up to October 2020.
4.4 Our January 2021 forecast was the first time that we directly aligned to the RTI tax data. Our
economy forecasts have always considered RTI earnings data in relation to assumptions on
average earnings. As discussed in our January 2021 SEFF report we now align to RTI tax data for
two main reasons:
• The RTI data from 2018-19 showed a stronger correlation to Scottish income tax outturn data.
Previously there had been only a weak correlation between the two but with additional data points
we now have increased confidence in the RTI data as a guide to overall Scottish income tax data.
• RTI tax data are available more frequently than SPI data and outturn data. This gives us a more
timely picture of the income tax landscape. With Scotland’s economic and income tax situation
continually changing we have placed greater weight on RTI as a source of information.
2
HMRC (2020) Scottish Income Tax Outturn Statistics: 2018 to 2019 ( link)
104.5 The RTI tax data are a snapshot from the HMRC PAYE administration system, and do not represent
the final tax position of individuals, particularly those who also or only file a Self-Assessment (SA)
tax return.
4.6 In addition to RTI tax not fully reflecting final tax liabilities for a year, they also only reflect the tax
regime each individual is liable for – such as Scottish, Welsh or English – when the data are
compiled. Taxpayers may become, or cease to be, a Scottish taxpayer due to address changes by
the time their liability is determined after the end of the tax year. RTI provides us with data on PAYE
only. We are assuming that the Self-Employment liabilities will broadly match the RTI PAYE tax
data.
4.7 The process of alignment with RTI involves growing the RTI forecast after first taking into account
historic trends in the data and adjusting for seasonality. We then apply these growth rates to the
income tax liabilities forecast from the SPI model, giving a post RTI income tax liabilities forecast.
The adjustment for the January 2021 forecast was a one to three per cent downward revision.
Other adjustments
4.8 We make further adjustments to our SITM baseline forecast to account for TMI, Gift Aid, self-
assessment settlements and UK reserved policies. We cannot model the effects of these factors
directly in SITM as SITM does not include the requisite data on these factors, and so instead we use
other available information to make adjustments to our aggregate forecast.
Tax Motivated Incorporations
4.9 Throughout the last decade in the UK there has been a steady rise in the proportion of people
working for themselves, rather than as an employee. Individuals who choose to work for themselves
may be self-employed or have the option to incorporate and manage their business as directors of a
limited company. In their 2019 Fiscal Risk Report, the OBR outlined how three people doing very
similar work can face differing tax treatment depending on their employment classification.
Employed individuals generally experience a higher tax burden.3
4.10 This rise in people working for themselves places a downward pressure on the Scottish NSND
forecast. A particular risk concerns those individuals who choose to incorporate. Depending on how
the individual then structures their income within and out with the company, they may pay
corporation taxes on profits, income taxes on dividends taken out of the company, or income taxes
and National Insurance Contributions on income taken out of the company as an employee. As
corporation tax and income tax on dividends flows to the UK exchequer, the Scottish Government
loses taxes through these channels that might otherwise have been taxed through NSND income
tax.4
4.11 We have been liaising with the OBR and HMRC on their incorporations modelling work. The HMRC
model aims to forecast the rising trend in incorporated owner-managers. HMRC has been providing
us with modelling and projections of incorporations behaviour in Scotland. We use these figures to
adjust our forecast to capture the impact of a changing incorporations behaviour response. In
previous forecasts it has resulted in a downward reduction of around £50 million in the first forecast
year by the end of the forecast this downward reduction has increased to around £700 million.
3OBR (2019) Fiscal Risks Report – July 2019 (link)
4Additional UK revenue on dividends and corporation tax may partially flow back to Scotland through the Barnett funding
arrangements, if the underlying driver behind Scottish incorporations also increase rUK incorporations.
11Gift Aid
4.12 Gift Aid is a way for charities to claim back the basic rate tax already paid on donations by the donor
through HMRC. Gift aid isn’t fully captured in the SPI so we rely on information from HMRC to apply
an ad-hoc adjustment to our forecast. It reduces our forecast by around £100 million in each year.
Self-Assessment settlements
4.13 The Self-Assessment (SA) settlement adjustment takes into account HMRC’s compliance activities.
HMRC conducts compliance activity to make sure individuals and businesses pay the cor rect
amount of tax. As part of the compliance process if an individual is found to have underpaid tax an
assessment can be raised by HMRC to collect the outstanding balance. One of the ways HMRC
collects these balances from taxpayers is to raise a settlement agreement; this means that the
outstanding debt is settled via a contract between HMRC and the taxpayer.
4.14 Our income tax forecasting model takes into account SA settlements by looking at the amount of UK
SA settlements. We take account of the historic trends and growth rates of the UK SA settlements.
We use these growth rates to build a forecast of SA settlements and apply this adjustment to our
income tax liabilities forecast. The adjustment results in a small upward revision of around £15
million in earlier years rising to around £50 million at the end of the forecast period.
UK reserved policies
4.15 We undertake additional modelling for certain policy measures introduced by the UK Government
which affect Scottish NSND income tax liabilities. One example of this are changes to the UK
Personal Allowance. The policy is part of the UK Government’s income tax powers, but policy
changes directly affect Scottish tax liabilities.
4.16 We calculate the necessary adjustment by using information from the following three sources:
• OBR’s policy measure database
• OBR’s devolved taxes forecast
• Internal information shared between SFC and OBR
4.17 We provide commentary in our SEFF publications about UK reserved policies that significantly
change our forecast.
12Chapter 5
Policy costings and behaviour
Overview
5.1 Modelling income tax policy is a crucial part of our income tax forecast. Since these new powers
have been devolved there has been a policy change in every year apart from 2021-22. Figure 5.1
below summarises all the income tax policies that have been implemented, and the effect it had on
our 2021-22 forecast. No policies were introduced for the 2021-22 year.
Figure 5.1: Post-behavioural policy costings for 2021-22 year
Forecast last Costing in
£ million Policy description
costed 2021-22
Higher rate threshold frozen at £43,000
2017-18 policy May 2019 85
compared to inflationary increase
Introduction of new five band income tax
2018-19 policy system. Higher rate threshold increases by 1% February 2020 212
in comparison to inflation
Higher rate threshold set at £43,430 compared
2019-20 policy January 2021 69
to inflationary increase
Higher rate threshold set at £43,430 compared
2020-21 policy January 2021 49
to inflationary increase
Source: Scottish Fiscal Commission
5.2 As shown in Figure 5.1, the most significant policy costing was in 2018-19 when the five band
income tax system was introduced. On 4 September 2019, we published our ‘Approach to policy
costings’ paper that explains how the Commission cost Government policies.5 This section will add
an income tax specific viewpoint on policy costings, and explain our methodology behind our
behavioural assumptions.
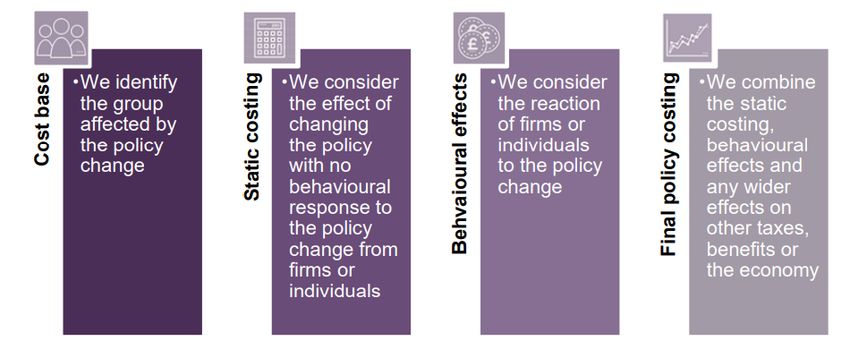
5.3 We approach every policy costing in four stages, as shown in Figure 5.2. This section will discuss
each policy costing step in turn.
5
Scottish Fiscal Commission (2019) Approach to Policy Costings – September 2019 (link)
13Figure 5.2: Overview of Commission’s approach to policy costings
Source: Scottish Fiscal Commission
Cost base
5.4 The cost base is our estimate of the population that will be affected by the policy change. For
income tax we are fortunate to have access to a valuable data source in the PUT. As explained in
Chapter 3, this provides income and tax details of Scottish taxpayers.
5.5 As part of our main forecast methodology the cost base is projected forward in the future using
economic determinants on earnings, employment and population changes. We directly use this
dataset for policy costings since it is already tailored to forecasting needs.
Static costing
5.6 A static costing involves calculating the immediate fiscal effect of a policy change without
considering any behavioural responses from those affected by the change or any knock-on effects
to the wider economy.
5.7 For income tax we calculate the static costing by using the policy rates and bands feeding these
through into our SITM model. We have the same level of confidence of our static costings as we do
with our general forecasting model. However, these static costings assume that taxpayers do not
respond in any way to the policy changes. For a full understanding of the potential revenue
consequences of policy changes we need to allow for possible behavioural responses.
Behavioural responses to tax policy
changes
Overview
5.8 In March 2018 we published an occasional paper setting out in detail what we mean by behavioural
responses to policy changes, the challenges of quantifying them, the available evidence and our
approach to handling behavioural responses in our income tax forecasts at the time.6 The material in
our March 2018 occasional paper remains relevant reading on this subject and we direct readers to
6
Scottish Fiscal Commission (2018) How w e forecast behavioural responses to income tax policy ( link)
14this paper for detailed background material. This chapter provides a brief overview of how we
forecast behavioural responses to policy change and an update on the latest developments in this
area.
5.9 Taxpayer behavioural responses are uncertain and therefore hard to quantify, even when good
historic data are available. However, there is strong international evidence that taxpayers do
respond to changes in tax policy and that this affects tax revenues. Because of the difficulty of
identifying and quantifying taxpayer behavioural change, our approach is necessarily broad-brush.
Although quantifying the impacts of behavioural change is not easy, it is important to account for it in
our forecast.
5.10 Behavioural change covers a wide range of responses of taxpayers to tax policy. These may
include:
• greater use of tax planning
• avoidance, artificially reducing one’s tax liability, often through complex and convoluted but legal
schemes
• evasion, which illegally reduces tax liabilities - for example, failing to declare income to HMRC
• economic responses, such as individuals choosing to seek a job, increase their hours worked or
reduce their hours worked
• migration, both into and out of Scotland
5.11 It is generally expected that the majority of taxpayers would not change their behaviour in response
to small tax changes. A basic rate or even a higher rate taxpayer who primarily has earnings from
employment and pays tax through PAYE would have limited scope to avoid or evade tax. There
may however be some impact on their incentives to work affecting the number of hours worked, as
compared to hours spent, for example, studying, travelling or caring for the family and home.
5.12 The response of the highest earners is of greatest interest as they have the largest incentives to
change their behaviour. They also have greater means to change their behaviour, for example the
money and connections to access avoidance schemes. While significant changes in behaviour may
be limited to a small number of high income individuals, these individuals are liable for large
amounts of tax, and so can have a disproportionate impact on tax revenues.
5.13 We cover behavioural responses in four areas:
• Intensive margin responses to changes in marginal tax rates
• Extensive margin responses to changes in average effective tax rates
• Additional intra-UK migration responses
• Short-term forestalling responses
5.14 Our modelling approach to intensive margin responses, extensive margin responses and forestalling
responses is largely unchanged since our March 2018 occasional paper, and so we only provide a
brief summary here. Our modelling of intra-UK migration responses has developed more since
2018, and so we go into more detail on this particular aspect of modelling behavioural responses in
this chapter.
15Marginal effective tax rate (METR) response
5.15 The METR measures how much a £1 rise in gross earnings is lost to payments of tax. A basic rate
taxpayer who earns £20,000, and pays 20p in income tax on the next pound earned, has an METR
of 20 per cent. The marginal response is a type of behavioural response where taxpayers may
change their effort either to earn more or pay less tax. For example, working more hours, or
increasing use of tax avoidance schemes. This type of behaviour is usually in response to a change
in METR.
5.16 We account for behavioural responses to changes in a taxpayer’s marginal rate of tax primarily
through the use of Taxable Income Elasticities (TIEs). TIEs estimate the percentage change in total
taxable incomes in response to a one per cent change in the net-of-tax rate. Box 5.1 describes how
we use TIEs to adjust our policy costings. We developed our TIEs by reviewing the existing literature
and through discussions with external experts. Our approach draws on studies by HMRC and
estimates by the Institute for Fiscal Studies (IFS) for the UK.
Box 5.1: Illustrative TIE calculation
The calculation below provides an illustrative example of how we used TIEs to estimate the behavioural response
of a taxpayer to a change in their top marginal rate of tax. The TIE is multiplied by the percentage change in the
taxpayers marginal retention rate – one less their marginal tax rate – to give the expected change in the taxpayers
taxable income. This change in taxable income is multiplied by the taxpayers marginal tax rate to capture the
impact on tax revenues of the change in behaviour. The illustrative example is based on a taxpayer with income
of £200,000 whose marginal tax rate is increased by five percentage points, from 40 per cent to 45 per cent.
Example
Formula
Calculation
(A) Original marginal tax rate 40%
(B) Initial marginal retention rate 1– A 60%
(C) Marginal tax rate after policy change 45%
(D) Marginal retention rate after policy change 1– C 55%
(E) % change in marginal retention rate (D – B) / B -8%
(F) TIE 0.5
(G) % change in taxable income ExF -4%
(H) Taxable income £200,000
(I) Change in taxable income G xH - £8,000
(J) Change in tax revenue I xC - £3,600
The TIEs we used in our forecast
5.17 We gathered TIEs from a range of international studies. These are discussed in detail in our March
2018 occasional paper. From the available range of TIEs, the Commission considered how the
context in Scotland may differ to other countries, particularly the UK as a whole. Three of the key
considerations were:
16• Income tax policy in Scotland applies to NSND income only. Opportunities for behavioural change
may be greater for dividend income than for NSND income. This may reduce TIEs in Scotland
relative to the UK.
• The opportunities for migration from Scotland, particularly to the rest of the UK, are greater than
opportunities for migration from the UK to other countries. This would tend to increase TIEs in
Scotland.
• In the UK, some of the loss of tax revenues in NSND income tax due to income shifting behaviour
change will be recouped elsewhere, for example through taxes on dividends, Corporate Taxes and
Capital Gains tax.
5.18 In Scotland, behaviour that shifts income from NSND income to another form will mean a total loss
of tax revenue in Scotland. This would mean implicitly greater TIEs in Scotland.
5.19 On balance, our judgement is that the opportunity for migration, particularly for the highest income
taxpayers, and the risk of income shifting leading to a total loss of revenues in Scotland, outweighs
the impact of the policy applying to NSND income only. This means for changes specifically in
Scotland, we judge TIEs for those with the very highest incomes to be greater in Scotland than in
the UK.
5.20 Figure 5.3 shows the TIEs used by the Commission in its Budget 2020-21 forecasts.
Figure 5.3: SFC’s taxable income elasticities
Taxable income Taxable income Taxable income
start (£) end elasticity
Low Basic rate limit 0.015
Basic rate limit 80,000 0.1
80,001 150,000 0.2
150,001 300,000 0.35
300,001 500,000 0.55
500,001 High 0.75
Source: Scottish Fiscal Commission
Average effective tax rate (AETR) response
5.21 This section provides detail on the second type of behavioural change, changes in behaviour in
response to changes in average tax rates. The AETR is the proportion of a taxpayers income which
is paid in tax, which can be changed even if their marginal rate doesn’t change. A taxpayer who
earns £60,000 and pays £15,000 in tax, will have an AETR of 25 per cent. The extensive margin
behaviour response is where taxpayers choose between earning money in a particular tax
jurisdiction against other options. Other options may include studying, caring for the family or home,
retirement, or migration to another tax jurisdiction.
5.22 Gathering evidence on responses to changes in AETR, excluding changes in a taxpayer’s marginal
tax rate, faces the same challenges discussed in the section above for METR. The available
evidence for this particular type of behavioural response is more limited. However, it is important to
take account of the extensive margin response to changes in AETR. The Commission took a
simpler approach for this particular type of behavioural response based on analysis and discussions
with experts. As with the TIEs, we assume that the size of behavioural response increases with
17taxpayer income. These AETR factors are not directly comparable to our TIEs as the calculation
works in a different way.
5.23 Figure 5.4 below shows the AETR factors used in our February 2021 forecast.
Figure 5.4: SFC’s extensive AETR factors
Taxable income Taxable income Extensive AETR
start (£) end (£) factors
Low Basic rate limit 0
Basic rate limit 80,000 0.06
80,001 150,000 0.06
150,001 300,000 0.25
300,001 500,000 0.25
500,001 High 0.25
Source: Scottish Fiscal Commission
5.24 The factors apply directly to the change in liabilities of the taxpayer. While a change in METR will
also affect AETR, the factors in Figure 5.4 strictly applies to changes in liabilities from changes in
AETR.
5.25 For example, for a top rate taxpayer, an increase in the top rate of one percentage point from 45 per
cent to 46 per cent will affect the taxpayer’s METR and AETR. However, in this case, we would only
apply the METR TIE behavioural costing described in Section 3. For a top rate taxpayer, we would
apply the AETR factor approach only for changes in thresholds or changes to tax rates below the
top rate, for example a change in the higher rate of tax.
5.26 Because of the limited changes in policy for those taxpayers at the lower part of the income
distribution, we assumed a low behavioural response for this group. Labour market incentives at the
extensive margin can be particularly important for this group, and so the Commission may consider
additional modelling or higher behavioural factors for any future more significant changes in policy
affecting this group.
5.27 Box 5.2 sets out an example calculation for applying the Commission’s AETR elasticity.
Box 5.2: Illustrative average effective tax factor calculation
The extensive effect factor applies directly to the change in liabilities for a taxpayer as a result of changes in the
taxpayers AETR excluding changes in their marginal tax rate.
Example
Formula
Calculation
(A) Change in tax liabilities below marginal band £300
(B) Extensive effect factor 0.06
(C) Change in tax liability A*B £18
18Policy divergence and intra-UK migration
5.28 Figure 5.5 shows the difference in income tax liabilities by gross income in Scotland and the rest of
the UK (rUK), showing how this has changed over the last few years. While taxpayers in Scotland
earning less than £27,393 in 2021-22 will pay less tax than in the UK, taxpayers earning over this
will pay more. The differences increase rapidly in the £40,000 region as taxpayers move into higher
rate tax.
Figure 5.5: Scottish policy position relative to the rest of the UK in 2021-22
Position
relative to the As proportion of
Gross Income rest of the UK income (per cent)
in 2021-22
£15,000 + £20.97 0.1
£20,000 + £20.97 0.1
£30,000 - £26.07 -0.1
£40,000 - £126.07 -0.3
£45,000 - £443.67 -1.0
£50,000 - £1,493.67 -3.0
£60,000 - £1,647.67 -2.7
£100,000 - £2,047.67 -2.0
£120,000 - £2,347.67 -2.0
£150,000 - £2,673.37 -1.8
Source: Scottish Fiscal Commission
5.29 All else equal, significantly lower income tax in the UK for gross incomes above the £43,662 Scottish
higher rate threshold will affect incentives to locate in Scotland. We consider three different types of
behaviour change in response to this difference in taxation:
Migration from Scotland to rUK: Taxpayers currently resident in Scotland who move to rUK as a
result of tax differences. We estimate that there are currently 250,000 taxpayers earning over
£50,000 in Scotland who could pay less income tax in the rest of the UK.
Migration from rUK to Scotland: Taxpayers currently in rUK who would have moved to Scotland
in the future, but now decide not to as a result of higher income tax. There are around 4.9 million
higher rate and additional rate taxpayers in the UK, of whom a small minority will relocate to
Scotland each year.
Tax residency change: Taxpayers who have flexibility about where they report their location to
HMRC within the UK, and for whom reporting a rUK rather than Scottish address may need only a
small change in behaviour, notably taxpayers who already own properties in both Scotl and and rUK.
5.30 In the short term, we expect tax residency responses to have the greatest impact on liabilities. For
those individuals who already split their lives between Scotland and the rest of the UK, swift, small
changes in behaviour may allow them to pay less tax. This could include elements of tax planning,
avoidance or evasion.
195.31 In the longer run, small changes in migration patterns will also start to affect liabilities. In 2018-19
around 47,000 individuals moved to Scotland from the rest of the UK, with around 37,000 individuals
moving the other way. Even very small changes in these flows could have an effect on tax liabilities.
5.32 To account for the policy divergence and intra-UK migration behaviour, we developed a framework
which captures the effect on Scottish tax revenues of additional migration responses on top of those
already captured in our METR and AETR behaviour framework.
5.33 The framework applies to any divergence between Scottish and UK income tax, and so we use it
even when there is only a change in UK income tax policy. We start by calculating for each taxpayer
the percentage difference between what that taxpayer pays in Scotland and what they would pay if
they were resident in the rest of the UK. We then apply an elasticity to the Scottish-UK percentage
tax differential. This elasticity varies by income level – from 0.06 for higher rate taxpayers to 0.25 for
top rate taxpayers. The elasticity represents the loss of tax revenue for a particular divergence in
Scottish and rUK income tax policy. We also apply a time profile that allows the behavioural
response to build over time.
5.34 We expect the impact of changes in migration behaviour to build up over time, increasing from
around £30 million in 2021-22 to around £60 million by the end of the forecast. We will continue to
keep our modelling approach for capturing this type of behaviour under review.
Box 5.3: Other policy divergences that we cost behaviour for
There are times that other UK Government reserved income tax powers results in changes to Scottish income
taxpayers behaviour. Examples include the increase of the Personal Allowance to £12,500, and the UK higher
rate threshold to £50,000 for the 2019-20 tax year. Although the rUK higher rate threshold does not have a direct
effect on Scottish taxpayers, it does affect the rate of NICs for employees. In recent years the UK Government
aligned the 12 per cent NICs UEL with the income tax higher rate threshold, which for 2019-20 was £50,000. So
in 2019-20 there was a portion of income between the Scottish higher rate of £43,430 and £50,000 for which
taxpayers pay 53 per cent marginal tax on both IT and NICs.
In these sorts of examples we apply our standard behavioural framework to measure the effect it has on our
income tax forecast. We provide updates in our SEFF publication when we do apply our framework in such cases.
Forestalling
5.35 The previous sections on METR and AETR behavioural responses dealt with how taxpayers may
change their behaviour over the full five year forecast. Forestalling is an additional type of behaviour
that is a one-off response to an expected change in policy.
5.36 When taxes change between one year and another, given sufficient notice, taxpayers may try to
artificially shift the timing of their income from one tax year to another, either backwards or forwards
in time.
5.37 For example, if an individual is expecting to receive a bonus from their employer in May 2022, but
finds that, due to a change in tax policy, their marginal tax rate will increase between tax year 2021-
22 and 2022-23, they may be able to negotiate with their employer to bring their bonus forward to
March 2022. This would mean they pay a lower tax rate on that bonus, because of it appearing in
tax year 2021-22, rather than in tax year 2022-23. This behaviour is known as forestalling.
205.38 We expect most forestalling responses to occur in the top rate population and the self-employed.
There are a number of factors underpinning this judgement:
• top rate taxpayers have the most money at stake in absolute terms
• top rate taxpayers are more likely to have access to the relevant mechanisms to take advantage of
forestalling
• evidence from previous UK tax policy changes shows the greatest response in the additional/top
rate group
5.39 Top rate taxpayers have the greatest ability and access to mechanisms that allow NSND income
shifting. Some examples of these mechanisms include:
• negotiating the timing of bonuses
• company owners/directors moving their income received as an employee
• company share schemes
5.40 Although some higher rate taxpayers may be in a position to use some of these methods, it is likely
that the majority of this group will be more constrained.
5.41 For the 2018-19 Scottish income tax policy, where a new five band income tax regime was
introduced including an increase to the top rate of tax from 45 to 46 per cent, we assessed the
forestalling response. At the time of assessing the response, we considered the forestalling effects
of a one per cent increase to be negligible. We developed a framework for assessing forestalling
behaviour for increases to the top rate of between two and five per cent.
5.42 Using evidence on the changes to the UK’s top rate of tax from 45 per cent to 50 per cent in 2010-
11, we extrapolated what that could mean for changes to Scottish tax policy. This accounted for
Scotland having a lower relative share of top rate taxpayers in comparison to rUK. Figure 5.6
highlights the conclusions of this work and what was used for the 2018-19 Scottish Budget. For
future policies that affect the top rate of tax we may choose to adopt a different forestalling
framework.
Figure 5.6: Commission’s forestalling framework used for 2018-19 Scottish Budget
Taxable Gain of tax Loss of tax
Increase in top Relative degree Net loss
income liabilities in liabilities in
rate (percentage of forestalling (£
shifted (£ 2017-18 (£ 2018-19 (£
points) (per cent) million)
million) million) million)
1 0 0 0 0 0
2 25 114 51 54 2
3 50 229 103 110 7
4 75 343 154 168 14
5 80 366 165 183 18
Source: Scottish Fiscal Commission
21Additional information
Abbreviations
HMRC Her Majesty’s Revenue and Customs
NSND Non-Savings and Non-Dividends
OBR Office for Budget Responsibility
PAYE Pay As You Earn
PUT Public Use Tape
RTI Real Time Information
SEFF Scotland’s Economic and Fiscal Forecasts
SFC Scottish Fiscal Commission
SG The Scottish Government
SPI Survey of Personal Incomes
TMI Tax Motivated Incorporations
A full glossary of terms is available on our website:
https://www.fiscalcommission.scot/explainers/glossary/
Professional Standards
The Commission is committed to fulfilling our role as an Independent Fiscal Institution, in line with the
principles set out by the Organisation for Economic Cooperation and Development (OECD).7
The Commission also seeks to adhere to the highest possible standards for analysis. While we do not
produce official statistics, we voluntarily comply as far as possible with the UK Statistic Authority's Code of
Practice for Statistics. Further details and our statement of voluntary compliance can be found on our
website.8
Correspondence and enquiries
We welcome comments from users about the content and format of our publications. If you have any
feedback or general enquiries about this publication or the commission, please contact
info@fiscalcommission.scot. Press enquiries should be sent to press@fiscalcommission.scot.
All charts and tables in this publication have also been made available in spreadsheet form on our website.
For technical enquiries about the analysis and data presented in this paper please contact the responsible
analyst:
Income tax and public funding Chris Dunlop Chris.dunlop@fiscalcommission.scot
7 OECD (2014) Recommendation on Principles for Independent Fiscal Institutions ( link)
8
Scottish Fiscal Commission (2018) Compliance w ith the Code of Practice for Official Statistics ( link)
22For general enquiries about this publication or the commission and how we work please contact
info@fiscalcommission.scot
23© Crown copyright 2021
This publication is available at www.fiscalcommission.scot
ISBN: 978-1-911637-33-2
Published by the Scottish Fiscal Commission, May 2021
24You can also read