Empirical studies of escape behavior find mixed support for the race for life model
←
→
Page content transcription
If your browser does not render page correctly, please read the page content below
Wrensford et al.: Distance and direction to refuge affect marmot escape

Accepted Article

Empirical studies of escape behavior find mixed support for
the race for life model
Kwasi Wrensforda,b*, Jahaziel Gutierrezb, William E. Cooper, Jr.c, Daniel T. Blumsteinb,d
a
    Museum of Vertebrate Zoology and Department of Integrative Biology, University of California, Berkeley, CA 94720,

                                                                                                                                       Downloaded from https://academic.oup.com/cz/advance-article/doi/10.1093/cz/zoab062/6330617 by UCLA user on 31 August 2021
USA; bThe Rocky Mountain Biological Laboratory, Box 519, Crested Butte, CO 81224, USA; cDepartment of Biology,
Indiana University Purdue University Fort Wayne, Fort Wayne, IN 46805, USA; dDepartment of Ecology and
Evolutionary Biology, University of California, 6121 Young Drive South, Los Angeles, CA 90095-1606, USA

*Address correspondence to Kwasi Wrensford, E-mail: kwasi_wrensford@berkeley.edu

Handling editor: Zhi-Yun Jia (贾志云)

Received on 14 May 2021; accepted on 26 July 2021

Abstract
Escape theory has been exceptionally successful in conceptualizing and accurately predicting effects of numerous
factors that affect predation risk and explaining variation in flight initiation distance (FID, predator-prey distance when
escape begins). Less explored is the relative orientation of an approaching predator, prey, and its eventual refuge. The
relationship between an approaching threat and its refuge can be expressed as an angle we call the “interpath angle” or
“Φ”, which describes the angle between the paths of predator and prey to the prey’s refuge and thus expresses the
degree to which prey must run towards an approaching predator. In general, we might expect that prey would escape at
greater distances if they must flee toward a predator to reach its burrow. The ‘race for life’ model makes formal
predictions about how interpath angle should affect FID. We evaluated the model by studying escape decisions in
yellow-bellied marmots Marmota flaviventer, a species which flees to burrows. We found support for some of the
model’s predictions, yet the relationship between interpath angle and FID was less clear. Marmots may not assess
interpath angle in a continuous fashion; but we found that binning angle into four 45° bins explained a similar amount
of variation as models that analyzed angle continuously. Future studies of interpath angle, especially those that focus on
how different species perceive relative orientation, will likely enhance our understanding of its importance in flight
decisions.
Key words: escape behavior, escape trajectory, escape theory, antipredator behavior, race for life model

When a prey is confronted by an approaching predator, one of the most basic decisions it must make is how close to
allow the predator to approach before beginning to flee (Ydenberg and Dill 1986). The distance between predator and
prey when escape begins is referred to as the flight initiation distance (FID). Much of the increased interest in escape
behavior results from theoretical models that permit predictions about the effects of many factors on FID (Stankowich

                                                                   1
        © The Author (2021). Published by Oxford University Press on behalf of Editorial Office, Current Zoology.
        This is an Open Access article distributed under the terms of the Creative Commons Attribution Non-Commercial License
        (http://creativecommons.org/licenses/by-nc/4.0/), which permits non-commercial re-use, distribution, and reproduction in any
        medium, provided the original work is properly cited. For commercial re-use, please contact journals.permissions@oup.com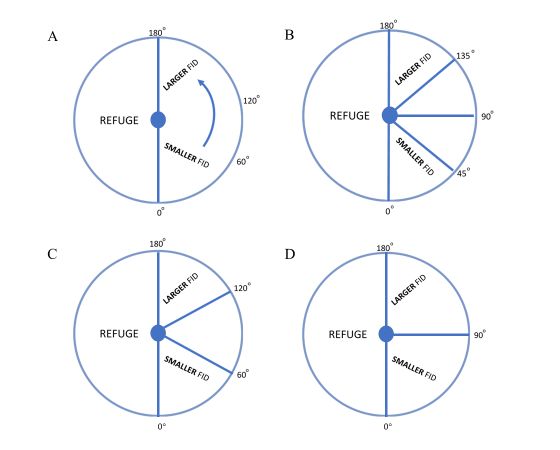
Wrensford et al.: Distance and direction to refuge affect marmot escape
and Blumstein 2005; Cooper and Blumstein 2015a, b), and a variety of cost-benefit models have been extremely
successful in predicting effects of single factors on FID (Cooper 2015; Samia et al. 2015; Blumstein et al. 2016).
All escape models assume that a prey detects a predator, monitors its approach, and then flees when some criterion
is met. Economic models predict that FID is longer when the costs of remaining (not fleeing) are larger and is shorter
when the costs of fleeing are greater. The major costs of fleeing include lost opportunities to feed, engage in social
behavior or conduct other activities that increase fitness. The Ydenberg and Dill (1986) model predicts that prey initiate
escape when the expected fitness costs of staying and fleeing are equal. If the prey were to allow the predators to
approach closer, the risk would outweigh the lost opportunity costs. However, it is possible for a prey to increase its
Downloaded from https://academic.oup.com/cz/advance-article/doi/10.1093/cz/zoab062/6330617 by UCLA user on 31 August 2021
lifetime fitness after an encounter even if it allows the predator to kill it. This can happen, for example, if the prey can
fertilize many eggs while the predator approaches. The Cooper and Frederick (2007) model, sometimes called optimal
escape theory, addressed this issue by developing a formal optimality model that allows the prey to select the FID that
maximizes its expected fitness after the encounter with the predator. These models have had great heuristic value, but
make no predictions about the effects of multiple, simultaneously acting predation risk factors.
The first model to consider multiple risk factors was developed by Kramer and Bonenfant (1997). The model
predicted FID when a prey was on a line between the predator and the prey’s refuge and allowed the prey to flee
straight away from the predator to its refuge. The model also predicted FID when the refuge was between the predator
and the prey, assuming the prey would flee straight toward the predator to its refuge. Ultimately, the model predicted
longer FIDs when the prey must flee toward the predator. The prediction was not explicitly economic but was based on
the relative speeds of predator and prey, their distances from the refuge and the locations of predator, prey and refuge
when all were aligned. Field data for woodchucks Marmota monax strongly supported the model (Kramer and Bonefant
1997), and has informed subsequent models of escape behavior that integrate multiple risk factors. Recent work by
Eason et al. (2019) demonstrates the importance of relative orientation of predator, prey and to a potential refuge on
flight initiation distance. When presented with multiple refuge options, Eastern grey squirrels Sciuris carolinensis
choose the refuge option that optimized the tradeoff between distance fled to a burrow and how directly prey must run
towards an approaching predator.
The ‘race for life model’ (Cooper 2016) generalizes Kramer and Bonenfant’s (1997) findings so that prey and
predator can approach the refuge from any direction. The race for life model predicts FID based on the combined
effects of predator and prey speeds, their distances and directions to refuge, and a margin of safety that ensures a prey’s
safe arrival at the refuge. When the prey decides to flee, its location and those of the predator and refuge form the
vertices of a triangle (Figure 1). The lengths of the two sides of the triangle that meet at the refuge are the distance of
the prey from refuge (DRprey) and the predator’s distance from refuge (DRpred). The angle between these sides is the
interpath angle (Φ) to refuge, and the side opposite Φ is the FID. The square of the predicted FID is given by the law of
cosines:
FID2 = DRprey2 + DRpred2 -2(DRprey + DRpred)cos(Φ).
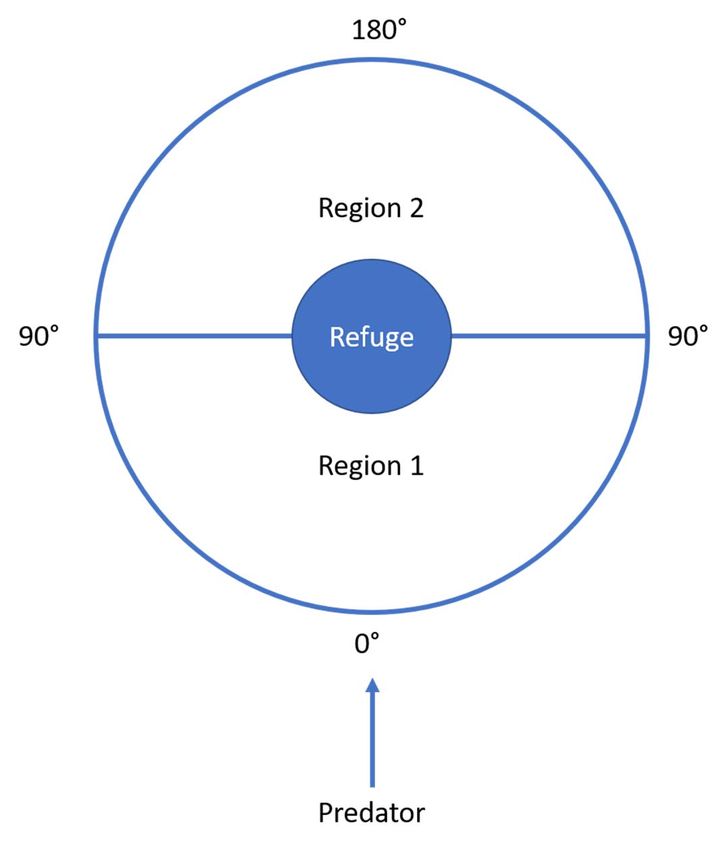
The model’s predictions are based, in part, on the relationships between interpath angle, Φ, and FID. At its essence
is the expectation that as Φ increases, prey must flee more directly towards an approaching predator. This scenario
constitutes a higher perceived risk for the prey, causing it to flee sooner, leading to a longer FID (Figure 2). The
relationship between interpath angle and an animal’s choice FID is a critical assumption of these models, but until
recently, little work has been done to empirically test this assumption.
2Wrensford et al.: Distance and direction to refuge affect marmot escape
We simulated predatory approaches with free living yellow-bellied marmots Marmota flaviventer to evaluate the
predictions of models of escape behavior in a natural system. We first asked if Cooper’s race for life model could
effectively predict FID in yellow-bellied marmots with parameters measured in the field. We then estimated the relative
contribution of angle to explaining variation in FID when compared to other parameters in Cooper’s race for life model,
as well as explained by extrinsic environmental factors known to influence FID. If the predictions of the model were
supported, simulated predatory approaches with a larger interpath angle would result in refuging prey fleeing more
directly toward a predator, indicating a greater cost of fleeing, and thus leading to a larger FID.
Downloaded from https://academic.oup.com/cz/advance-article/doi/10.1093/cz/zoab062/6330617 by UCLA user on 31 August 2021
Materials and Methods
Animals and study site
We studied yellow-bellied marmots, which use burrows constructed by themselves or conspecifics as refuges. The study
was conducted in and around the Rocky Mountain Biological Laboratory (RMBL) in Gothic Colorado (38.96° N,
106.99° W). At this site, marmots are abundant and have been individually marked during the course of a long-term
study of their behavior and ecology (Blumstein 2013; Armitage 2014). Animals live in discrete colony locations
throughout the East River Valley where the RMBL is located. The colonies of River, Bench, and Gothic Town are
located in the southern portion of the valley that encompasses the RMBL field station and seasonally used cabins which
are subject to relatively heavier human use. The colonies Marmot Meadow, Picnic, Boulder, North Picnic, and
Stonefield are in the northern portion of the valley and human use is limited to a mountain pass road, hikers, and
cyclists, resulting in much comparatively less direct human disturbance. All subjects were live trapped and marked with
numerically unique metal tags to their ears for permanent identification and their dorsal pelage was marked with black
Nyanzol dye to permit identification from afar. Data were collected between June and August of 2015 and 2016.
Because yellow-bellied marmots have a readily detectable alerting response (they orient their heads towards an
approaching human or predator), alert distance, the predator-prey distance when the alerting response is given, is easily
measured. It is important to measure alert distance because FID generally increases as both starting distance (Blumstein
2003; Cooper 2005; Samia et al. 2013) and as alert distance increases (Blumstein 2010; Samia et al. 2013; Samia and
Blumstein 2014, 2015). To explain the relationship between FID and alert distance or starting distance, Blumstein (2010)
proposed the flush early and avoid the rush hypothesis, which predicts that FID increases as alert distance increases due
to increased costs of monitoring the predator for a longer distance. Cooper and Blumstein (2014) identified several such
costs. When alert distance is measured, its effect can be statistically accounted when determining the relationship of
FID to other variables. We included alert distance in our analyses to avoid any false increases in apparent FID at long
starting distances due to spontaneous movement by prey that have not detected the predator (but see Williams et al.
2014).
The race for life model includes a predator-to-prey speed ratio and a margin of safety that we did not measure.
These variables help to determine the predator’s distance from the refuge when flight begins, but do not appear in the
final equation we used to calculate FID from the race for life model. We measured the distances to refuge of predator
and prey and the interpath angle and used the law of cosines to calculate the predicted FID. Using this calculated value
of FID, we can assess if our field-measured data support the race for life model.
3Wrensford et al.: Distance and direction to refuge affect marmot escape
Data collection
Prior to collecting data, two researchers practiced their walking pace used for approaches until they perfected a fixed
approach speed of 0.5 m/s. We chose a slow, consistent approach speed to standardize the simulated predator stimulus,
and to minimize eliciting variable stress responses. Practice continued during the study to ensure that approach speed
did not drift. We located marmots with binoculars by scanning occupied colony sites and once sighted, we used its fur
mark to identify the subject. We conducted experimental approaches only on individuals that were in non-agitated states,
i.e., those that were standing and looking at the surroundings, lying down and looking, or foraging. All subjects were
Downloaded from https://academic.oup.com/cz/advance-article/doi/10.1093/cz/zoab062/6330617 by UCLA user on 31 August 2021
within 31 m of their burrows, and on average stayed within 5±5.7 SD m of their burrows (range = 0.5 – 31 m).
Once we had an identified, relaxed subject, a solitary researcher approached the marmot directly at the practiced
speed of 0.5 m/s. When the marmot turned its head toward him, the researcher dropped a marker. When the marmot
began to flee, the researcher dropped another marker. The researcher continued to approach the marmot until it fled into
its burrow and then walked to the marmot’s initial location. A critical assumption of Cooper’s model is that predators
approach directly towards a refuge when flight begins. Since marmots are usually near their burrows and flee directly
towards their refuge, an approaching researcher’s pursuit trajectory is effectively angled towards its refuge. From this
location, a laser rangefinder was used to measure alert distance (distance from the first marker to the point where the
marmot began to flee), and flight initiation distance (distance between the second marker and the marmot’s initial
location). The prey’s distance to refuge was the distance from the point where escape was initiated and the burrow’s
entrance. The predator’s distance from refuge was the distance from the second marker to the burrow’s entrance. The
interpath angle (φ), measured with a compass, was the angle between the lines leading from the burrow’s entrance to
the prey’s location when it began to escape and the second marker (i.e., the researcher’s position when escape began).
While we collected multiple observations on some subjects, we elected to use a single observation (the first) from each
individual in the study. Since all marmots in this study population were individually marked, we knew each subject’s
age and sex. Individuals of different sexes and of different life stages can vary in their boldness, and hence FID (Petelle
et al. 2013).
Analysis
All statistical analyses were performed using R v.3.6.0 with the RStudio v1.2.1335 interface. Prior to analysis involving
FID predicted by the race for life model, we calculated predicted FID based on the measurements for each observation
as the square root of the solution of the equation based on the law of cosines. In preliminary analyses, we established
that FID did not substantially differ between the sexes (ANOVA using log10(FID) as dependent variable: F1,79 = 0.30, P
= 0.58). We recorded age in three categories, pups, yearlings and adults. An ANOVA showed that log10(FID) differed
significantly among age groups (F2,78 = 9.96, P < 0.001, η2 = 0.20; log10(FID) ± 1 SE was 1.34 ± 0.22 for pups (N = 38),
1.42 ± 0.105 for yearlings (N = 16), and 1.54 ± 0.06 for adults (N = 27 for juveniles)). Variances were homogeneous
(Levene’s F2,78 =1.80, P = 0.17). Using Tukey’s HSD tests, FID was significantly shorter for pups than yearlings (P =
0.034) and adults (P < 0.001) but did not differ significantly between yearlings and adults (P = 0.54). We eliminated sex
from the remaining analyses and included age.
Preliminary analyses also revealed highly significant effects of colony location and alert distance on FID. Alert
distance explains considerable variation in FID (Blumstein et al. 2005; Samia et al. 2013; Samia and Blumstein 2014).
4Wrensford et al.: Distance and direction to refuge affect marmot escape
Prior work has shown that marmots in our population that are differentially exposed to humans differ significantly in
FID as well. By observing and quantifying the degree of human activity, Li et al. (2011) quantified the level of human
disturbance for most colony sites in our study population. For our study, we used these scores to categorize each of our
seven colony sites into either a “high disturbance” or “low disturbance” category (Table 1). After finding a significant
effect of location on FID (Figure 3), we fitted a multiple regression to analyze the effect of alert distance and
disturbance on FID. While mean FID was smaller in more disturbed locations, the directionality of statistical effects,
and the degree of support for model predictions remained consistent. The significant effects of disturbance level (P =
0.013), and a marginally significant interaction between disturbance level and alert distance (P = 0.050) led us to
Downloaded from https://academic.oup.com/cz/advance-article/doi/10.1093/cz/zoab062/6330617 by UCLA user on 31 August 2021
include disturbance level, as well as alert distance in subsequent analyses.
To examine the predictive ability of the race for life model and that of the primary variables of that model (DRprey,
DRpred, and the cosine of Φ), we fitted a series of general linear models (GLM). We first conducted simple correlation
tests to determine the relationship between individual model variables and observed FID2. The primary test of model
predictions was a GLM with FID2 as the dependent variable and DRprey, DRpred, and the cosine of Φ as independent
variables. We included an interaction term between DRprey, DRpred, and cos(Φ) to test for interactive effects on a
marmot’s escape decision between escape trajectory and a marmot’s proximity to its eventual refuge.
Variables with non-normal distributions were log10 transformed prior to analysis to improve distributions. Despite
recent recommendation that regressions of FID on alert distance should be forced through the origin (Blumstein et al.
2015) because an alert distance of zero cannot have an FID longer than zero, we included intercepts in our statistical
models. We did this because alert distance must be longer than FID to be meaningful, and because the relationship
between FID and alert distance occurs in a range of distances at which the prey can detect the approaching predator and
dynamically assess risk prior to fleeing and presumably optimize escape decisions (this is referred to as zone II in
Blumstein 2003; Cooper 2015). Predators first detected closer than zone II should lead to immediate flight. The
regression line of FID on alert distances in zone II may have a positive or negative intercept depending on the prey’s
risk assessment process. Including the intercept in analyses permits the confirmation of a zero intercept. Effect sizes are
reported as partial R2 for the GLMs. Our two-tailed alpha was set at 0.05.
To assess the influence of interpath (φ) angle on observed FID when compared to extrinsic factors, we fitted a GLM
to explain variation in FID. Our independent variables included: alert distance, disturbance level, and interpath angle.
Alert distance, FID, and DRprey were log10 transformed before analysis.
The race for life model implies that FID will vary continuously with angle, and therefore we treated angle as a
continuous variable in our general linear model. However, animals may not make as fine distinctions in angle when
making escape decisions, and may use coarser assessments of predator risk due to orientation. Therefore, we
parameterized a series of general linear models in which we binned our data into different categories comprising
different angles (Figure 4) which were based on the predictions of the models of Kramer and Bonenfant (1997), and
Cooper (2016) and empirical results reported by Eason et al. (2019). Using AIC to compare model fits, we then
assessed which angle categorization scheme most effectively explained variation in our data.
Results
We conducted trials on 81 unique marmots from seven different colony locations. We collected observations with a
variety of values of Φ, representing a wide range of escape scenarios, but with a bias towards low values of Φ (Figure 5).
5Wrensford et al.: Distance and direction to refuge affect marmot escape
Using the law of cosines, we calculated a predicted measure of FID from values of the cosine of Φ, DRPrey, and DRPred
to verify that our field-measured data met the assumptions of Cooper’s race for life model. In a simple regression
analysis, nearly all of the variation in observed FID was explained by predicted FID (Figure 6; F1,79 = 589.88, P = 0.001,
R2 = 0.94). The statistical relationships between our measured independent variables were much less definitive. In
simple correlation tests, DRpred had a highly significant positive relationship with observed FID2 (R = 0.989, P < 0.001),
and DRprey also had a significant positive effect (R = 0.698, P = 0.016). Cos(Φ) however had no significant statistical
relationship with FID2 (R = 0.063, P = 0.167) (Figure 7). When all variables are compared in a linear model, DRpred
explained a significant portion of the variation (R2 = 0.709, P < 0.001), as well as a significant effect of cos(Φ) (Partial
Downloaded from https://academic.oup.com/cz/advance-article/doi/10.1093/cz/zoab062/6330617 by UCLA user on 31 August 2021
R2 = 0.002, P = 0.011). However there was little effect of DRprey (Partial R2 = 0.030, P = 0.680) or the interaction
between DRprey, DRpred, and cos(Φ) (Partial R2 = 0.002, P = 0.136) on explaining variation in FID.
We suspected the disproportionate effect of DRpred may be due to a bias in our data towards small values of DRprey.
This bias may be due to marmots’ tendency to forage quite close to their burrows, which would mathematically result in
very similar values for FID and DRpred, regardless of Φ. We then analyzed a smaller subset of the data, where
observations with a DRprey < 3 m were excluded. When analyzing the effect of our independent variables on FID in this
reduced dataset, we again found a highly significant effects of DRpred (P < 0.001) as well as DRprey (P < 0.001), but no
significant effect of cos(Φ) (P = 0.451) or the interaction term (P = 0.529) (Table 3).
Interpath angle, φ, consistently explained significant variation in observed FID when compared to external variables
such as alert distance and disturbance level (Table 4). By comparing AIC values for each of our models, we found that
the linear model in which inter-path angle was continuous, and when binned into four categories of 0-45°, 46-90°, 91-
135, and 136-180° had greater predictive ability relative to the other two models tested. In our best categorical model,
interpath angle explained significant variation (P = 0.039) after controlling for variation explained by alert distance (P <
0.001) and disturbance level (P < 0.001).
Discussion
While we were able to use Cooper’s model (Cooper 2016) to effectively predict FID, we did not observe the
hypothesized statistical relationships between all model parameters and observed FID. The tight relationship between
FID and DRpred, while consistent with Cooper’s predictions, seems to reflect a bias in our data towards smaller values of
DRprey. However, when excluding observations with small values of DRprey, there is a marginal effect of DRprey and no
effect of interpath angle, but we did detect a significant effect of the interaction between DRprey and cos(phi) (Table 2).
This effect could indicate the potential of a contextual effect of interpath angle on FID. In biological terms, an animal
further away from refuge may assess risk differently in fleeing towards an approaching predator than if it were closer to
its burrow. Our analyses imply that animals farther away from their eventual refuge may place less importance on
interpath angle than other factors when deciding when to initiate flight.
Our results demonstrated that when compared to other variables typically reported to explain variation in FID, such
as alert distance and level of human disturbance, inter-path angle explained significant variation in FID. Our results are
consistent with Kramer and Bonenfant’s (1997) original findings, as well as those in Cooper’s (2016) race for life
model, and recent empirical findings reported by Eason et al. (2019). In all cases, as interpath angle decreased, FID
decreased. However, we were unable to observe the corresponding relative increase in FID at larger interpath angle bins
6Wrensford et al.: Distance and direction to refuge affect marmot escape
that approached 180o. This may suggest that marmots may not be assessing escape trajectories uniformly, but rather bin
them into higher-level categories with varying levels of risk assigned to them.
Cooper’s race for life model hypothesizes that FID increases with interpath angle in a sigmoid fashion, rather than
linearly. However, models that treated angle as a binary variable by binning angle into categories of 0-90 o and 90-180 o,
did not outperform models that treated angle as having multiple states. While marmots may perceive running directly
away from a predator to reach a refuge as reflecting relatively low risk, as interpath angle increases, perceptions of risk
may not increase much as they flee towards a predator. For instance, in fish and lizards, the most common escapes are
often very close to straight away from the predator, but sometimes individuals escape at angles that are somewhat less
Downloaded from https://academic.oup.com/cz/advance-article/doi/10.1093/cz/zoab062/6330617 by UCLA user on 31 August 2021
directly away from the predator or even at right angles to the predator’s path. Such an escape trajectory permits the prey
to monitor the predator while fleeing (Domenici and Ruxton 2015; Cooper 2016; Cooper and Sherbrooke 2016).
Fleeing towards a predator may offer other benefits. Prey that flee towards approaching aerial predators are much more
likely to survive than those that fled away from a predator (Shifferman and Eilan 2004; Ilany and Eilam 2007). By
fleeing towards a predator, the relative speeds of the predator and prey are increased, decreasing the window of
opportunity for a successful capture (Howland 1974).
Far less is known about the effect of direction of escape on FID, although Kramer and Bonenfant (1997) showed
FID is longer in woodchucks fleeing straight toward than straight away from a predator. In broad-headed skinks
Plestiodon laticeps, FID increased as the escape direction was directed more toward a predator (Cooper 1997). In
eastern grey squirrels, escape trajectory significantly influences their choice of refuge, with squirrels more likely to
select a refuge further away if the relative angle of escape was more obtuse than a closer refuge, which would result in
fleeing more away from a predator (Eason et al. 2019). Our results add to this accumulated knowledge and show that
the direction marmots escape to a refuge with respect to the predator’s path strongly affects FID.
Variation in land use, and in turn, degree of human disturbance had significant impacts on resulting FID in our study.
Our results are consistent with previous findings for yellow-bellied marmots (Li et al. 2011; Petelle et al. 2013), and
other species that reported smaller FIDs at sites where prey have frequent benign contacts with humans (Cooper 2015b;
Samia et al. 2015). However, despite this variation in magnitude of FID across sites, the direction of relationship
between angle and FID remains constant between levels of human disturbance.
Taken together, we found some support for the assumptions of Cooper’s race for life model. More work remains to
be conducted to evaluate the model. For instance, we did not vary predator approach velocity or quantify prey escape
velocity. Studies have found that prey can dynamically alter their FID in response to variation in predator approach
speed (Cooper 2006). Environmental structure and topography may also interact with an animal’s orientation to a
potential refuge, affecting escape speed and probability of evading capture. Not all escape routes are equal in a realistic,
complex environment, and future studies must take this into account. And while Cooper’s race for life model provides a
mechanistic framework for how the effect of angle may change with predator approach speed, a comprehensive
empirical test of this relationship remains to be done. Our findings suggest that it may be worthwhile to develop new
theoretical models predicting how other combinations of risk factors, cost of fleeing factors, or both may affect escape
decisions.
Although the race for life model is mechanistic rather than economic, future studies should consider how it might be
incorporated into cost-benefit models. The currency of the Ydenberg and Dill (1986) and Cooper and Fredrick (2007,
2010) models is expected fitness at the end of the predator-prey encounter. A link between these models and the race for
7Wrensford et al.: Distance and direction to refuge affect marmot escape
life model is the probability of being killed and losing all fitness if the predator captures the prey before it reaches
refuge. The question is how this relates to predator-prey distance before the prey flees.
Our results raise important questions regarding how prey use information in the environment to assess risk, and in
turn to make escape decisions. While contemporary models of escape behavior seek to capture the continuous variation
in quantitative risk factors influencing FID, prey animals themselves may not perceive these risk factors in a continuous
way. To that end, there is extensive research into the cognitive mechanisms by which animals categorize complex
information to enhance memory and make more efficient decisions. Much of this work has focused on animal’s ability
to generalize stimuli in regards to predator recognition (Ferrari et al. 2016), as well as the mechanisms underlying
Downloaded from https://academic.oup.com/cz/advance-article/doi/10.1093/cz/zoab062/6330617 by UCLA user on 31 August 2021
spatial reasoning (Shettleworth 2009). Studies of escape behavior at the individual level must reconcile risk assessment
and spatial reasoning to determine how animals assess complex and competing stimuli to determine optimal escape
strategies. Much remains to be learned about decision-making processes by prey even for the relatively simple decision
about when to flee, much less during the more complex interactions between predators and their fleeing prey that occur
in nature.
Acknowledgements
We thank the 2015 and 2016 members of Team Marmot for help keeping individuals marked and 2 anonymous
reviewers for constructive comments on a previous version. K. W. was supported by the National Science Foundation’s
Research Experience for Undergraduates grant program (DBI 126713 to the Rocky Mountain Biological Laboratory), as
well as the University of Connecticut Department of Ecology and Evolutionary Biology Katie Bu Undergraduate
Research Award. J. G. was supported by the Rocky Mountain Biological Laboratory. D. T. B. was supported by the
National Science Foundation (DEB-1119660 and 1557130 to D. T. B. as well as DBI-126713 to the Rocky Mountain
Biological Laboratory).
References
Armitage KB, 2014. Marmot Biology: Sociality, Individual Fitness, and Population Dynamics. Cambridge, U.K.:
Cambridge University Press.
Blumstein DT, 2003. Flight-initiation distance in birds is dependent on intruder starting distance. J Wildlife Manage 67:
852-857.
Blumstein DT, Anthony LL, Harcourt R, Ross G, 2003. Testing a key assumption of wildlife buffer zones: is flight
initiation distance a species-specific trait? Biol Conserv 110: 97-100.
Blumstein DT, Fernandez-Jurcic E, Zollner PA, Garity SC, 2005. Inter-specific variation in avian responses to human
disturbance. J Appl Ecol 42: 943-953.
Blumstein DT, 2010. Flush early and avoid the rush: a general rule of antipredator behavior? Behav Ecol 21: 440-442
Blumstein DT, 2013. Yellow-bellied marmots: insights from an emergent view of sociality. Philos. Trans. Royal Soc B
368: 20120349.
Blumstein DT, Flores G, Munoz NE, 2015. Does locomotor ability influence flight initiation distance in yellow-bellied
marmots? Ethology 121: 434-441.
Blumstein DT, Samia DS, Cooper Jr WE, 2016. Escape behavior: dynamic decisions and a growing consensus. Curr
Opin Behav Sci 12: 24-29.
8Wrensford et al.: Distance and direction to refuge affect marmot escape
Cooper Jr WE, 1997. Factors affecting risk and cost of escape by the broad-headed skink Eumeces laticeps: predator
speed, directness of approach, and female presence. Herpetologica 53: 464-474.
Cooper WE, 2003a. Effect of risk on aspects of escape behavior by a lizard Holbrookia propinqua in relation to optimal
escape theory. Ethology 109: 617-626.
Cooper Jr WE, 2003b. Risk factors affecting escape behavior by the desert iguana, Dipsosaurus dorsalis: speed and
directness of predator approach, degree of cover, direction of turning by a predator, and temperature. Can J Zool.
81: 979-984.
Cooper WE, Jr., Pérez-Mellado V, Baird T, Baird TA, Caldwell JP et al., 2003. Effects of risk, cost, and their
Downloaded from https://academic.oup.com/cz/advance-article/doi/10.1093/cz/zoab062/6330617 by UCLA user on 31 August 2021
interaction on optimal escape by nonrefuging Bonaire whiptail lizards Cnemidophorus murinus. Behav Ecol. 14:
288-293.
Cooper Jr WE, 2005. When and how do predator starting distances affect flight initiation distances? Can J Zool.
83:1045-1050.
Cooper Jr WE, 2006. Dynamic risk assessment: prey rapidly adjust flight initiation distance to changes in predator
approach speed. Ethology 112: 858-864.
Cooper WE, Frederick WG, 2007. Optimal flight initiation distance. J Theor Biol. 244: 59-67.
Cooper Jr WE, 2009. Escape tactics and effects of perch height and habituation on flight initiation distance in two
Jamaican anoles (Squamata: Polychrotidae). Int J Trop Biol Conserv. 58: 1199-1209.
Frederick WG and Cooper Jr. WE, 2010. Predator lethality, optimal escape behavior, and autotomy. Behav Ecol. 21:
91-96.
Cooper Jr, WE, Blumstein DT, 2014. Novel effects of monitoring predators on costs of fleeing and not fleeing explain
flushing early in economic escape theory. Behav Ecol 25: 44-52.
Cooper WE, Jr. 2015, Reptiles. In: Cooper WE, Jr., Blumstein DT eds. Escaping from Predators: An Integrative view of
Escape Decisions. Cambridge, U.K.: Cambridge University Press, 113-151.
Cooper WE, Jr., Blumstein DT, 2015a. Escaping from Predators: An Integrative view of Escape Decisions. Cambridge:
Cambridge University Press.
Cooper WE, Jr., Blumstein DT, 2015b. Escape behaviour: importance, scope, and variables. In: Cooper WE, Jr., Blumstein DT
eds. Escaping from Predators: An Integrative view of Escape Decisions. Cambridge: Cambridge University Press, 3-14.
Cooper WE, 2016. Fleeing to refuge: Escape decisions in the race for life. J Theor Biol. 406: 129-36.
Cooper WE, Sherbrooke WC, 2016. Strategic escape direction: orientation, turning, and escape trajectories of zebra-tailed lizards
Callisaurus draconoides. Ethology. 122: 542-551.
Domenici P, Blagburn JM, Bacon JP, 2011. Animal escapology I: theoretical issues and emerging trends in escape trajectories. J
Exp Biol. 214: 2463-2473.
Domenici P, Ruxton GD, 2015. Prey behaviors during fleeing: escape trajectories, signaling and sensory defenses. In: Cooper
WE, Jr., Blumstein DT eds. Escaping from Predators: An Integrative View of Escape Decisions by Prey. Cambridge, U.K.:
Cambridge University Press, 199-224.
Eason PK, Nason LD, Alexander JE Jr., 2019. Squirrels do the math: flight trajectories in eastern gray squirrels Sciurus
carolinensis. Ecol Evol 7, 66
Ferrari MC, Crane AL, Chivers DP, 2016. Certainty and the cognitive ecology of generalization of predator recognition. Anim
Behav 111: 207-211.
Howland HC, 1974. Optimal strategies for predator avoidance: the relative importance of speed and manoeuvrability. J Exp Biol,
9Wrensford et al.: Distance and direction to refuge affect marmot escape
47: 333-350.
Kramer DL, Bonenfant M, 1997. Direction of predator approach and the decision to flee to a refuge. Anim Behav. 54:
289-295.
Li C, Monclús R, Maul TL, Jiang Z, Blumstein DT, 2011. Quantifying human disturbance on antipredator behavior and
flush initiation distance in yellow-bellied marmots. Appl Anim Behav Sci. 129: 146-152.
Petelle MB, McCoy DE, Alejandro V, Martin JG, Blumstein DT,2013. Development of boldness and docility in yellow-
bellied marmots." Anim Behav 86: 1147-1154.
Samia DS, Nomura F, Blumstein DT, 2013. Do animals generally flush early and avoid the rush? A meta-analysis. Biol
Downloaded from https://academic.oup.com/cz/advance-article/doi/10.1093/cz/zoab062/6330617 by UCLA user on 31 August 2021
Lett. 9: 20130016.
Samia DS, Blumstein DT, 2014. Phi index: a new metric to test the flush early and avoid the rush hypothesis. PLoS
ONE 9: e113134.
Samia DS, Blumstein DT, 2015. Birds flush early and avoid the rush: an interspecific study. PLoS ONE. 10, e0119906.
Samia DS, Blumstein DT, Stankowich T, Cooper WE, 2015. Fifty years of chasing lizards: new insights advance
optimal escape theory. Biol Rev. 91: 349-366.
Shettleworth SJ, 2010. Cognition, Evolution and Behavior. New York: Oxford University Press.
Stankowich T, Blumstein DT, 2005. Fear in animals: a meta-analysis and review of risk assessment. Proc Biol Sci. 272:
2627-2634.
Shifferman E, Eilam D, 2004. Movement and direction of movement of a simulated prey affect the success rate in barn
owl Tyto alba attack. J Avian Biol. 35: 111-116.
Williams DM, Samia DS, Cooper WE, Blumstein DT, 2014. The flush early and avoid the rush hypothesis holds after
accounting for spontaneous behavior. Behav Ecol. 25: 1136–1147.
Ydenberg RC, Dill LM, 1986. The economics of fleeing from predators. Adv Study Behav. 16: 229-249.
10Wrensford et al.: Distance and direction to refuge affect marmot escape
Table 1. Number of individuals sampled at each colony location as part of this study. Colonies in areas of high human
activity were categorized as “High Disturbance”, while areas of low human activity were categorized as “Low
Disturbance”.
High Disturbance Low Disturbance
Gothic Bench/River Town Marmot Picnic Boulder Meadow North Picnic Stonefield
N 16 27 12 11 4 5 6
Downloaded from https://academic.oup.com/cz/advance-article/doi/10.1093/cz/zoab062/6330617 by UCLA user on 31 August 2021
11Wrensford et al.: Distance and direction to refuge affect marmot escape
Table 2. Results of simple linear regressions explaining variation in FID as a function of Alert Distance and
Disturbance Level, as well as the interaction between Alert Distance and Disturbance Level.
Variable Estimate SE P
Intercept -0.532 0.190 0.007
Alert Distance 1.083 0.121 < 0.001
Low Disturbance 0.793 0.312 0.013
Alert Distance * Disturbance -0.367 0.184 0.050
Downloaded from https://academic.oup.com/cz/advance-article/doi/10.1093/cz/zoab062/6330617 by UCLA user on 31 August 2021
12Wrensford et al.: Distance and direction to refuge affect marmot escape
Table 3. Summary of results of linear models testing the statistical effect of the race for life model parameters on
observed FID2. The full model reports model results for the complete dataset, the reduced model reports results from a
model where observations with a DRprey < 3 m are excluded, but with the same parameters. Bold illustrates significant
(P < 0.05) terms in the model .
Variable Estimate SE Partial R2 P
Full Model Intercept 1.751 0.094 0.850 < 0.001
(N = 81) DRprey 0.005 0.013 0.002 0.6795
Downloaded from https://academic.oup.com/cz/advance-article/doi/10.1093/cz/zoab062/6330617 by UCLA user on 31 August 2021
DRpred 0.032 0.002 0.709 < 0.001
cos(Φ) -0.326 0.125 0.085 0.011
DRprey x DRpred x cos(Φ) 0.001 0.001 0.030 0.136
Reduced Model: Intercept 2.420 0.166 0.894 < 0.001
DRprey > 3m (N = 36) DRprey -0.051 0.007 0.255 < 0.01
DRpred 0.019 0.003 0.482 < 0.001
cos(Φ) -0.215 0.282 0.021 0.451
DRprey x DRpred x cos(Φ) -0.0004 0.001 0.014 0.529
13Wrensford et al.: Distance and direction to refuge affect marmot escape
Table 4. Results of linear models explaining variation in observed flight initiation distance. Each model treats interpath
angle as a different class of variable, either as a continuous numeric variable, or as a factor where angle is binned into
categories. Categories were determined based on the predictions of Kramer and Bonenfant, namely that as the interpath
angle increases, prey must flee more directly towards an approaching predator, will assess a greater risk, and flee sooner
(i.e., FID will increase
Model Variable Estimate SE Partial R2 P
N = 81
Downloaded from https://academic.oup.com/cz/advance-article/doi/10.1093/cz/zoab062/6330617 by UCLA user on 31 August 2021
1. Continuous Intercept -0.397 0.151 0.011
R2 = 0.97 Alert Distance 0.936 0.090 0.583Wrensford et al.: Distance and direction to refuge affect marmot escape
Downloaded from https://academic.oup.com/cz/advance-article/doi/10.1093/cz/zoab062/6330617 by UCLA user on 31 August 2021
Figure 1. In the race for life model (Coper 2016) FID is identical to that predicted by Kramer and Bonenfant (1997)
predictions are made for the general case in which the prey, predator and refuge are unaligned, permits the refuge to be
located any direction from the prey. Except in the two linear cases of the Kramer and Bonenfant (1997) model, the
locations of prey, predator and refuge form the vertices of a triangle with distance or predator and prey to the refuge
(DRpredator and DRprey) and are represented by the length of two sides, and the interpath angle to the refuge (Φ) lying
between these two sides. FID is the length of the side opposite the interpath angle.
15Wrensford et al.: Distance and direction to refuge affect marmot escape
Figure 2. The race for life model predicts that flight initiation distance decreases as the interpath angle decreases, the Downloaded from https://academic.oup.com/cz/advance-article/doi/10.1093/cz/zoab062/6330617 by UCLA user on 31 August 2021
interpath angle ranging from 0° (prey fleeing straight away for the predator to 180° (prey fleeing straight toward the
predator. A simplified prediction of the race for life model is that FID is shorter in region 1 than region 2 of the figure
because the prey flees somewhat away from the predator at all angles in region 1, but flees somewhat toward the
predator at all directions in region 2.
16Wrensford et al.: Distance and direction to refuge affect marmot escape
Downloaded from https://academic.oup.com/cz/advance-article/doi/10.1093/cz/zoab062/6330617 by UCLA user on 31 August 2021
Figure 3. The log10-transformed alert distance, flight initiation distance (FID) and predicted FID all were longer in
relatively isolated up valley locations (low disturbance) than in down valley locations where marmots are more
frequently exposed to human presence (high disturbance). Mann Whitney U tests reveal that there are significant
17Wrensford et al.: Distance and direction to refuge affect marmot escape
differences in the mean of each of these variables for low and high disturbance areas. Sample sizes were 39 at up valley
locations and 42 at down valley locations.
Downloaded from https://academic.oup.com/cz/advance-article/doi/10.1093/cz/zoab062/6330617 by UCLA user on 31 August 2021
Figure 4. The four different schemes used to categorize angle in our linear model analyses. These figures represent a
refuge as the small central circle, and a predator’s potential relative path somewhere along the outer circle. A. Interpath
angle is treated as a continuous variable. B. Interpath angle is binned into four categories (0-45, 45-90, 91-135, and 136-
180). C. Interpath angle is binned into three categories (0-60, 60-120, 121 – 180). D. Interpath angle is binned into two
categories (0-90, 91-180).
18Wrensford et al.: Distance and direction to refuge affect marmot escape
Downloaded from https://academic.oup.com/cz/advance-article/doi/10.1093/cz/zoab062/6330617 by UCLA user on 31 August 2021
Figure 5. Frequency histogram of values of interpath angle (Φ) observed in the field.
Figure 6. Observed FID is highly correlated with predicted FID. Although this simple correlation does not account for
effects of alert distance or location on FID, the association remains very high when these factors are also considered.
19Wrensford et al.: Distance and direction to refuge affect marmot escape
Downloaded from https://academic.oup.com/cz/advance-article/doi/10.1093/cz/zoab062/6330617 by UCLA user on 31 August 2021
Figure 7. A. Predator distance to refuge (DRpred) is highly correlated with FID, this relationship. B. DRprey is
significantly correlated with FID, with FID increasing as prey distance to refuge increases. This relationship is
consistent with the central hypotheses in escape theory, that being farther away from potential refuge constitutes a
greater risk and should result in larger FID. C. However, there is no significant relationship between interpath angle
(phi) and FID.
20You can also read