The Global Climate Action Summit (GCAS), San Francisco, 12-14 September, 2018
←
→
Page content transcription
If your browser does not render page correctly, please read the page content below
BRIEFING
Requested by the ENVI committee

The Global Climate Action Summit (GCAS),
San Francisco, 12-14 September, 2018
 KEY FINDINGS

 Despite the Trump administration’s decision to withdraw from the Paris Agreement and support for coal
 power, environmental progress continues in the U.S. with energy-related CO2 emissions declining by
 14% from 2005 to 2017.
 The abundance of cheap natural gas following a sharp increase in domestic production, as a result of
 horizontal drilling and hydraulic fracturing techniques, has resulted in a significant change in the energy
 mix. The share of electricity generation from natural gas–fired power plants increased from around 23%
 in 2010 to 30% in 2017. In contrast, the share of electricity generation from coal-fired power plants
 declined from 46% in 2010 to 31% in 2017. This market trend is something that a pro-coal Trump
 administration is unlikely to reverse, indeed a further 6.3 GW of coal-fired capacity shut down in 2017.
 Renewables accounted for 17% of the total electricity generation in the U.S. in 2017 with wind and solar
 reaching record shares. The deployment of renewables in the U.S. has benefited from federal financial
 subsidies (i.e. production/investment tax credits), renewable portfolio standards at the state level and
 from declining technology costs. Attempts by the Trump administration to weaken federal financial
 support for renewables in a tax reform bill was met with strong bi-partisan resistance in Congress –
 demonstrating that checks and balances exist on the Trump administration’s energy agenda.
 An increasing number of U.S. states are moving ahead with more ambitious policies than the Trump
 administration. For example; the United States Climate Alliance consists of 17 governors (representing
 40% of the U.S. population) that are all still committed to reducing GHG emissions in line with the goals
 of the Paris Agreement regardless of the federal policy. Actions by non-state actors are also being
 encouraged in the U.S. and beyond through coalitions such as We Mean Business and C40 Cities.
 The GCAS will build upon the efforts of previous summits such as COP 23 and the One Planet Summit by
 providing a platform for state and non-state actors to showcase their climate actions, ahead of COP 24,
 to demonstrate to national governments that more ambitious climate action is “necessary, desirable and
 achievable” (GCAS 2018b).

Introduction
The 2018 GCAS, which will take place in San Francisco from the 12th until the 14th of September, will enable
a range of state and non-state actors to publicize the climate actions currently being implemented ‘on the
ground’ to help inspire further efforts to support and build upon the commitments pledged in the Paris
Agreement (GCAS 2018a). Following the inauguration of President Trump, climate change policy in the U.S.
has become increasingly fragmented between developments at the federal and state level. For example,
the decision of the Trump administration to withdraw from the Paris Agreement has led to the rise of state
and non-state actors stepping-up in order to fill the void in leadership on climate change through various

                     Policy Department for Economic, Scientific and Quality of Life Policies
                                   Directorate-General for Internal Policies
                               Authors: Sean Healy, Martin Cames (Öko-Institut)
                                          PE 626.058– August, 2018                                        EN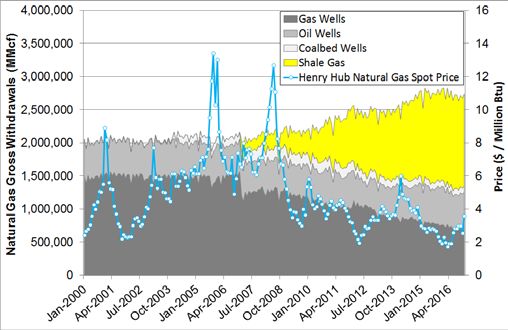
IPOL | Policy Department for Economic, Scientific and Quality of Life Policies
initiatives and coalitions. The extent to which such actions will offset the detrimental impact of the Trump
administration’s energy policies remains, as yet, unclear. However, it is certainly clear that the ambition of
U.S. climate change policy should not be defined by the actions of the Trump administration alone.
Overview of U.S. climate change policy
Federal level
According to the EPA (2018), total gross U.S. greenhouse gas (GHG) emissions were 6,511.3 million metric
tons (MMT) of CO2-eq in 2016. 1 The transport and electricity generation sectors, both accounted for the
largest share in GHG emissions in 2016 (28%), followed by industrial (22%), agricultural (9%), commercial
(6%) and residential (5%) sectors. CO2 accounted for the majority of the GHG emissions in 2016 (82%)
followed by methane (10%), nitrous oxide (6%) and fluorinated gases (3%). 2 Total gross GHG emissions were
1.9% lower in 2016 than the previous year. This decline was driven by a decrease in CO2 emissions from fossil
fuel combustion as coal was substituted for natural gas and other non-fossil energy sources in the electricity
power sector (EPA 2018).
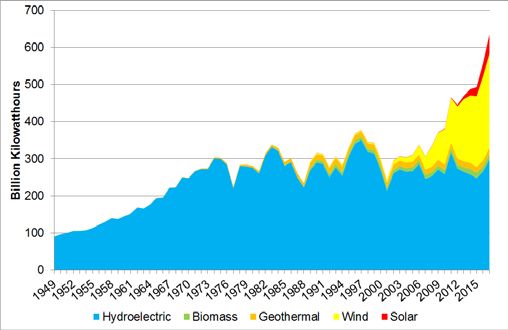
More recent U.S. data on energy-related CO2 emissions reports a 14% decline between 2005 and 2017 (EIA
2018f), which reflects significant changes in the country’s energy mix (Figure 1). The share of electricity
generation from natural gas–fired power plants increased from around 23% in 2010 to 30% in 2017 (EIA
2018h). In contrast, the share of electricity generation from coal-fired power plants declined from 46% in
2010 to 31% in 2017 (EIA 2018h). The change in the energy mix reflects the sustained low prices for natural
gas that have made the fuel competitive with coal. Renewables provided 17% of the total electricity
generation in the U.S. in 2017 (EIA 2018h) with wind and solar reaching record shares in the same year that
6.3 GW of coal-fired capacity shut down (EIA 2018a).
Figure 1 Electricity net generation from fossil fuel and nuclear power plants (left) and
renewables (right)
Source: EIA (2018h).
The extent to which the recently observed trend towards the decarbonisation of the power sector (and the
economy overall) will continue became more uncertain following the election of Donald Trump to the White
House, who campaigned on reversing several of the Obama administration’s key climate change policies.
After more than one year in office, the Trump administration fully intends to follow through on promises
made during the election campaign:
• On the 1st of June, 2017, Donald Trump announced that the United States would withdraw
from the Paris climate accord (Washington Post 2017), which included a commitment by the
2 PE 626.058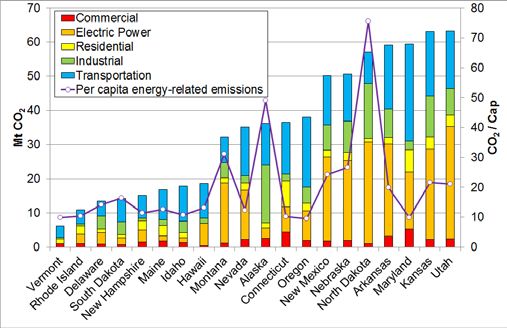
Global Climate Action Summit, San Francisco, 12-14 September, 2018
U.S. to reduce their economy-wide GHG emissions by 26-28% below 2005 levels by 2025
(United States of America 2015);
• On the 10th of October, 2017, the EPA Administrator Scott Pruitt 3 issued a Notice of Proposed
Rulemaking, proposing to repeal the Clean Power Plan (CPP), which set state by state targets
for CO2 emissions that would have reduced national electricity sector emissions by 32% below
2005 levels by 2030; 4
• On the 21st of August, 2018, the EPA revealed a proposal to relax federal limits on GHG
emissions from power plants. The proposal would provide states with leeway to define their
own emissions-reduction goals and this represents a shift away from the CPP previously
advocated by the Obama administration (Nature 2018).
Whilst these headline policy reversals by the Trump administration have received a lot of publicity, the actual
implementation of these changes will not happen overnight as the U.S. cannot quit the Paris Agreement
until 2020 and attempts to repeal the CPP are likely to be litigated for many years to come.
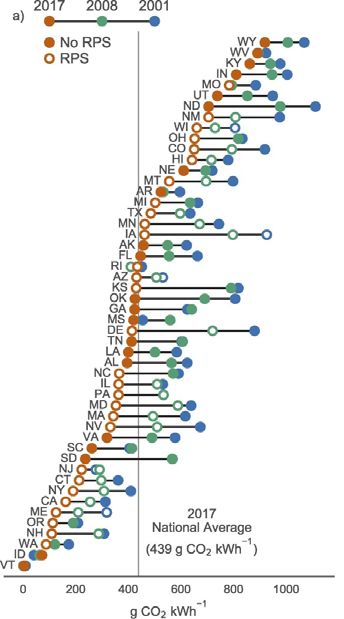
Donald Trump aims at reinvigorating the coal industry; however, this is against a backdrop of relatively
higher costs for U.S. coal power plants (Carbon Tracker 2018) while the cost of renewables and natural gas
continues to decline (Figure 2). Indeed, the abundance of cheap natural gas following a sharp increase in
domestic production – as a result of horizontal drilling and hydraulic fracturing techniques (EIA 2017) – is
making coal even less competitive (Figure 2). Galik et al. (2018) argue that if Trump fulfilled an election
campaign promise to reduce regulation and open more lands to oil and gas production, this would ”further
drive down natural gas prices even lower, marginalizing coal in the process”. Interestingly, Bloomberg New
Energy Finance (2018) have suggested, that with cost improvements in batteries, 5 it may be possible to add
four hour battery energy storage to existing wind or solar plants that would enable renewables to compete
with gas plants, even in the U.S. with its cheap gas generation.
Figure 2 Changes in the Levelized Cost of Energy 6 of different generation technologies (left)
and natural gas gross withdrawals 7 compared to the spot price (right)
Source: Lazard (2017) ; EIA (2018g); EIA (2018c).
State level
The variation in CO2 emissions by U.S. states reflects the use of different fuels for electricity generation,
different climates and different sources of economic output. Texas and California were the highest CO2
emitting U.S. states in 2015 (Figure 3), which was driven by their large population and economic size.
However, both states perform better when such driving factors are taken into account. California only
emitted 9.3 metric tons of (energy related) CO2 per person in 2015 reflecting its energy efficiency programs
and the benefits of a milder climate. Texas emitted more than double the per capita (energy related) CO2
emissions of California in 2015, due in part to its reliance upon coal (Figure 4) with around 40% of the coal-
PE 626.058 3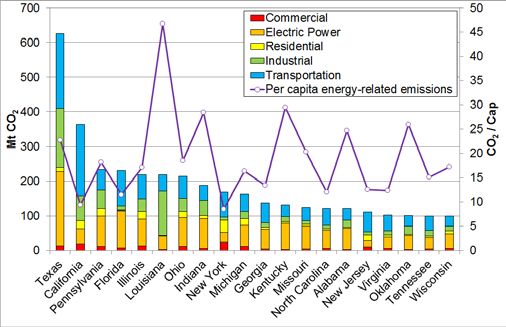
IPOL | Policy Department for Economic, Scientific and Quality of Life Policies

fired power plants in the state burning lignite for electricity generation (EIA 2018e). In contrast, California
relies more heavily upon less CO2 intensive natural gas imports but efficiently uses the fuel, especially
relative to other states (Figure 4).

Vermont was the lowest CO2 emitting U.S. state in 2015 (Figure 3), which reflects the fact that its electric
power sector is virtually free of fossil fuel consumption (EIA 2018b). The main source of emissions originated
from the residential sector, as petroleum products are used as the main heating fuel (Figure 4) in a relatively
cold climate. In contrast, the residential sector represented a minimal share of the CO2 emissions in Hawaii
in 2015 due to the relatively warm climate. The transport sector represents a considerable share of CO2
emissions in all of the U.S. states shown in Figure 3 for the year 2015.

Figure 3           Top 20 U.S. states with the highest (left) and lowest (right) CO2 emissions by sector
                   in 2015

Source: EIA (2018d).

Figure 4           Top 20 U.S. states with the highest (left) and lowest (right) CO2 emissions by fuel type
                   in 2015

Source: EIA (2018d).

From 2000 to 2015, CO2 emissions declined in 41 states and increased in 9 states (EIA 2018b). The greatest
decrease in CO2 emissions (in percentage terms) occurred in Maine (25%) while Nebraska accounted for the
largest percent rise (22%) in CO2 emissions (Figure 5). An explanatory factor for the reduction in the CO2
emissions observed in the majority of states between 2000 and 2015 was the decline in the carbon intensity
of energy supplies, however again the extent of decarbonisation in the power sector varies.

                                                           4                                        PE 626.058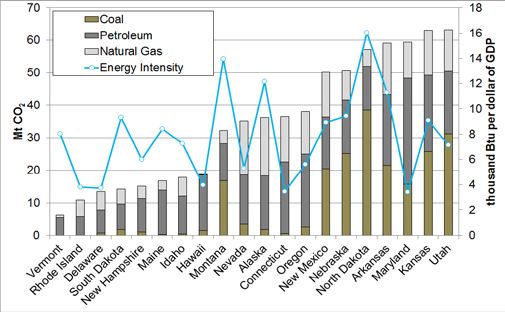
Global Climate Action Summit, San Francisco, 12-14 September, 2018

Figure 5           Change in total CO2 emissions between 2000 and 2015 by the top 20 (left) and
                   bottom 20 (right) performing U.S. states

Source: EIA (2018d).

Impact of Renewable Portfolio Standards on CO2 intensity:

Schivley et al (2018) calculated the annual CO2 intensity of electricity generation within each state for 2001,
2008 and 2017. The hollow circle markers indicate that the state had requirements for renewable
generation as part of a RPS. Key findings include:

 States with large declines in CO2 intensity are not limited only to
 those that have implemented a RPS. Delaware & Iowa had largest
 declines with the implementation of a RPS. Oklahoma, North
 Dakota and South Dakota also experienced large declines without
 a RPS (but do have voluntary renewable energy goals).
 States without an RPS have achieved a reduction in their annual
 CO2 intensity via coal to gas fuel switch. Florida, Arkansas,
 Georgia, and Tennessee, which ended 2017 close to the national
 average, all increased generation from natural gas and decreased
 generation from coal.
 Idaho, where nearly all power generation is from hydro, added
 some natural gas generation and is the only state that increased
 their CO2 intensity between 2001 and 2017.
 Schivley et al (2018) illustrate that reductions in the CO2 intensity
 of electricity generation have also occurred in states without an
 RPS. The switching from coal to gas over time reflects a change
 in market fundamentals but may also have been further
 encouraged by policies at the state level, such as the
 introduction of a CO2 price via emissions trading (i.e. Regional
 Greenhouse Gas Initiative (RGGI), California ETS) as well as other
 forms of state regulation to improve energy efficiency.

The deployment of wind and solar has historically been driven by state renewable portfolio standards
(RPSs). 8 According to Barbose (2017), around half of all growth in U.S. renewable electricity generation and
capacity since 2000 is associated with state implementation of RPS requirements. The impact of RPS
policies on renewable energy deployment varies geographically. In certain regions, RPS policies continue

PE 626.058                                           5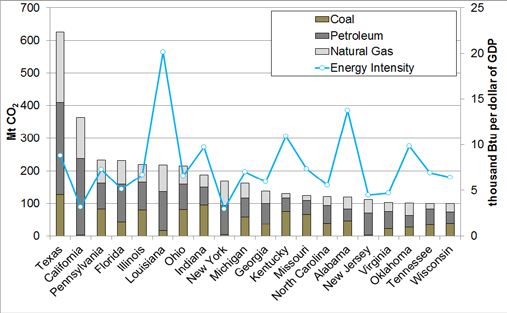
IPOL | Policy Department for Economic, Scientific and Quality of Life Policies

to play a significant role. 9 However, in certain states (i.e. Texas) the growth in renewable energy far
exceeded the RPS requirements due to favourable wind resource and federal economic incentives (i.e.
Production Tax Credit). Furthermore, renewables are now often being voluntarily installed in response to
recent falls in cost.

The Global Climate Action Summit
Main issues at stake

The main issue at stake involves the inadequate level of ambition that has been collectively pledged so far
by Parties to the Paris Agreement in order to prevent, or at least limit, the most detrimental impacts of
climate change. The GCAS aims to facilitate new commitments by a range of non-state actors, which will
contribute to meeting the Paris Agreement. In doing so, the Summit intends to demonstrate to national
governments ahead of COP 24 that more ambitious climate action is “necessary, desirable and achievable”
(GCAS 2018a) .

Summit participants (including states, and local governments; businesses and investors; civil society,
members of the faith community and other influencers; national governments and tribes; and individuals
committed to climate action) are expected to make substantial climate commitments to support climate
action in five key areas (GCAS 2018a):

    1) Healthy Energy Systems: “A global shift toward clean and equitable energy and mobility
       systems advances climate progress and enable healthy people and places”;
    2) Inclusive Economic Growth: “Climate leadership, and the clean technology and energy
       transition generate good jobs, broad-based economic opportunity, and inclusive, resilient
       growth”;
    3) Sustainable Communities: “Sustainable buildings, cities, communities, and infrastructure are
       clean, healthy and livable and improve quality of life for all”;
    4) Land and Ocean Stewardship: “Forests, food, lands and other ecosystems play a critical role in
       mitigating climate change and making our world more resilient, while also ensuring
       sufficient food supplies for a growing population”;
    5) Transformative Climate Investments: “Investments are mobilized on the scale needed to
       achieve the Paris Agreement, spur innovation and accelerate a clean and resilient economy”.

Positions of key participating actors

The failure to reach a consensus on several climate commitments at the recent G7 meeting in Canada,
demonstrates the need for non-state actors to further encourage their national governments to increase the
level of their climate ambition.

In the communique's section on climate change, every member of the G7 except the United States
supported the Paris Agreement:

”Canada, France, Germany, Italy, Japan, the United Kingdom and the European Union reaffirm their strong
commitment to implement the Paris Agreement, through ambitious climate action” (G7 2018)

Instead, U.S. negotiators prepared their own paragraph for the climate section of the communique that
focused on promoting the burning of fossil fuels:

“The United States will endeavour to work closely with other countries to help them access and use fossil fuels
more cleanly and efficiently and help deploy renewable and other clean energy sources, given the importance of
energy access and security in their Nationally Determined Contributions” (G7 2018).

                                                           6                                        PE 626.058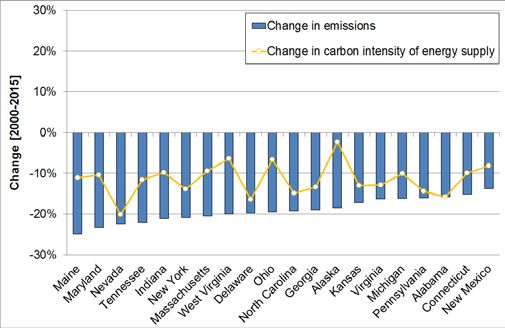
Global Climate Action Summit, San Francisco, 12-14 September, 2018

The United States Climate Alliance was created on the 1st of June, 2017, in an immediate response to the
Trump administration’s decision to withdraw from the Paris Agreement. The alliance currently consists of 17
governors (representing 40% of the U.S. population and a $9 trillion economy) that are all committed to
reducing GHG emissions in line with the goals of the Paris Agreement (U.S. Climate Alliance 2018). The U.S.
Climate Alliance states are currently on track to meet their share of the Paris Agreement emissions target by
2025 and new areas of collaboration have recently been announced, which include reducing super
pollutants, mobilizing finance for climate projects, grid modernisation, renewable energy, appliance
efficiency standards, building resilient communities and infrastructure, increasing carbon storage in the
landscape and deploying clean transportation (GCAS 2018b). Governors from the U.S. Climate Alliance plan
to attend the GCAS in September and will provide an update on 2018 initiatives at the Summit.

In addition, the We Are Still In coalition released a declaration on the 5th of June, 2017 in support of the
Paris Agreement that has subsequently been signed by more than 2,800 leaders (i.e. mayors, county
executives, governors, tribal leaders, college and university leaders, businesses, faith groups, and investors)
from America – representing more than 160 million Americans and $6.2 trillion of the U.S. economy (We Are
Still In 2017). In a further statement of intent, the We Are Still In coalition opened an U.S. Climate Action
Pavilion during the recent COP 23 in Bonn to confirm that their network of states, cities, universities, faith
groups and environmental activists continue to work towards the achievement of the U.S. GHG reduction
pledge under the Paris Agreement. The We Are Still In coalition intends to contribute to the upcoming GCAS
in San Francisco by showcasing the climate actions submitted by a range of stakeholders via their U.S.
Climate Action Contribution tool (We Are Still In 2018)

America’s Pledge is another separate initiative, which was formed in July 2017 with the objective of
quantifying and reporting on how the actions of ambitious U.S. cities, states and businesses can compensate
for federal inaction. Indeed, America's Pledge (2018b) reported that in 2017 “non-federal climate action and
sustained investment in clean energy technology resulted in energy-related U.S. carbon dioxide emissions
falling to their lowest levels in 25 years”. In advance of the GCAS in September, America’s Pledge will present
their 2018 U.S. report on Bottom-Up Climate Action, which will “estimate the emission reductions associated
with specific, ambitious policies and actions that can be taken by U.S. cities, states and businesses”
(America's Pledge 2018a).

With momentum continuing to build, the Chicago Climate Charter was subsequently signed in December
2017 by more than 50 cities, and tens of millions of people – representing a first-of-its-kind international
charter on climate change. By signing the Chicago Climate Charter at the North American Climate Summit
(City of Chicago 2017), cities pledged, amongst other goals, to:

    •   “Achieve a percent reduction in carbon emissions in line with the Paris Agreement”;
    •   “Quantify, track and publicly report city emissions, consistent with standards and best
        practices of measurement and transparency”;

The leading role of cities looks set to continue at the GCAS in San Francisco with C40 Cities inviting mayors
globally to further step up their climate actions. “City actions are being collected under the One Planet
Charter, which is designed to provide cities with a swift, yet achievable road map for bold and inclusive
climate action” (C40 Cities 2018).

The We Mean Business coalition consists of over 700 leading businesses around the world that have all
made strategic climate commitments in the Take Action campaign. These commitments involve delivering
emission reductions at scale, creating a low carbon energy system, re-imagining cities and transport,
removing deforestation, cutting industry’s carbon footprint, building climate competent companies and
mitigating the impact of climate change (We Mean Business Coalition 2018b). These companies are
collectively achieving a real impact; representing 2.62 gigatons of emissions (equivalent to the total annual
emissions in India). Out of the 700+ companies involved in the Take Action campaign, over 130 of these
companies have committed to go 100% renewable as part of the RE100 initiative, which corresponds to an

PE 626.058                                          7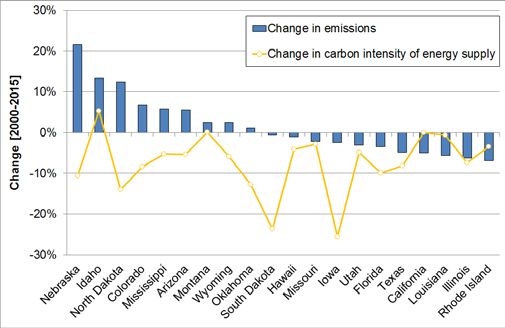
IPOL | Policy Department for Economic, Scientific and Quality of Life Policies

annual demand of 162 TWh of renewable electricity. It is expected that by the GCAS in September, over 500
companies will have committed to setting an approved scientifically based target (We Mean Business
Coalition 2018a).

The Under2 Coalition is made up of in excess of 200 governments (representing over 1.3 billion people and
nearly 40% of the global economy) that are all committed to keeping global temperature rise to less than
2°C. The Climate Group is the Secretariat to the Under2 Coalition and works with governments to accelerate
climate action through the following three work streams (The Climate Group 2018b):

    •   2050 Pathways: “Deep decarbonization pathway planning: supporting governments to
        develop robust medium and long-term (2050) emissions reduction plans in line with the goals
        of the Paris Climate Agreement”;
    •   Policy Action: “Scaling innovative policy solutions: spreading today’s best climate policies and
        developing new policies to ensure full decarbonization”;
    •   Transparency: “Mainstreaming transparency: supporting governments so they have the
        expertise and systems in place to assess their emissions accurately, track progress and ensure
        policies remain fit for delivering against climate targets”.

The Climate Group will host the Under2 Coalition General Assembly at the GCAS on the 12th of September,
where state and regional governments that have participated in the Under2 Coalition will show the progress
they’ve made, and how they will further step up ambition (The Climate Group 2018a).

Rise for Climate Jobs and Justice is a movement, representing all aspects of civil society, to demand a “just,
equitable and resilient 100% renewable energy economy that rapidly expands economic opportunity,
creates family sustaining jobs, and protects vulnerable communities, workers and future generations” (Rise
for Climate Jobs and Justice 2018). In order to raise further awareness, marches are being organised around
the world that will take place on the 8th of September in advance of the GCAS.

Relationship to other global summits on climate change

The adoption of the Paris Agreement at COP 21 in December 2015 framed the international action against
climate change for the post-2020 period (UNFCCC 2015).

    •   Parties promised to limit the global temperature rise to well below 2°C compared to pre-
        industrial levels and to also continue efforts to keep the increase below 1.5°C (refer to Article
        2 of the Paris Agreement);
    •   Parties aim to also reach the global peaking of GHG emissions as soon as possible so as to
        achieve a balance between anthropogenic emissions by sources and removals by sinks of
        GHGs in the second half of this century (refer to Article 4 of the Paris Agreement).

To deliver on that collective ambition, Parties will have to submit Nationally Determined Contributions
(NDCs) every 5 years. By 2023, a global stocktake will assess these contributions to determine whether the
collective efforts of the Parties are aligned with the temperature objectives they committed to in the Paris
Agreement. In addition, it was decided at COP 21 to “convene a facilitative dialogue among Parties in 2018
to take stock of the collective efforts of Parties” (UNFCCC 2018), which was subsequently renamed the
“Talanoa Dialogue”. Given that the current NDCs are not ambitious enough to limit global warming to 2°C
(Climate Action Tracker 2018), the outcome of these discussions under the Talanoa Dialogue need to lead
to more ambitious NDCs. The Dialogue aims to address three questions about climate action:

    •   Where are we?
    •   Where do we want to go?
    •   How do we get there?

                                                           8                                         PE 626.058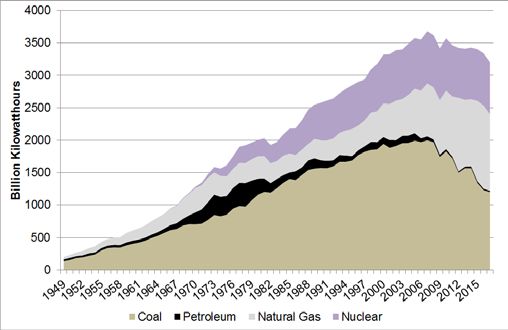
Global Climate Action Summit, San Francisco, 12-14 September, 2018

Answers from non-state actors responding to at least one of the three questions can be submitted by the
29th of October for the high-level political segment during COP 24 in Katowice, Poland. A wide array of
events over the course of 2018, such as the Global Climate Action Summit in California on the 12-14th of
September and the One Planet Summit on the 26th of September (which will provide an opportunity for
state and non-state stakeholders to account for the implementation of the commitments made in the
previous year), 10 can be held in support of the Dialogue and play an important role in creating momentum
and galvanizing stronger action. UN secretary general António Guterres has warned that nations
that choose not to rapidly shift away from fossil fuels will be “left behind”. The message was clear:

“The sustainability train has left the station. Get on board or get left behind… Those who fail to bet on the green
economy will be living in a grey future” (United Nations 2017).

In order to encourage leaders from around the world to advance a more positive agenda, the secretary
general announced he would convene a climate summit in 2019. Guterres said the meeting would “make
sure we reach the critical first review of Paris implementation with the strong wind of a green economy at
our backs” (United Nations 2017).

Conclusion
Despite the Trump administration’s decision to withdraw from the Paris Agreement and support for coal
power, environmental progress continues in the U.S. with energy-related CO2 emissions declining by 14%
from 2005 to 2017.The abundance of cheap natural gas following a sharp increase in domestic production,
as a result of horizontal drilling and hydraulic fracturing techniques has resulted in a significant change in
the energy mix. Attempts by the Trump administration to weaken federal financial support for renewables
in a tax reform bill was met with strong bi-partisan resistance in Congress, which demonstrate the checks
and balances on the Trump administration’s energy agenda. The decision to withdraw from the Paris
Agreement has acted as a catalyst for more ambition at the state level to offset policies at the federal level.
This is a welcome development given the fact that the NDCs pledged by the Parties are currently insufficient
to limit global warming to 2°C. The GCAS will build upon the efforts of previous summits such as COP 23 and
the One Planet Summit by providing a platform for states and non-state actors to showcase their climate
actions, ahead of COP 24, to demonstrate to national governments that more ambitious climate action is
“necessary, desirable and achievable” (GCAS 2018a).

Bibliography
America's Pledge (2018a): Bottom-Up Opportunity Agenda for U.S. State, City and Business Action on
Climate. America's Pledge. Available online at :
https://www.americaspledgeonclimate.com/news/americas-pledge-outlines-bottom-opportunity-
agenda/.

America's Pledge (2018b): One Year Later, American Climate Leadership Forges Ahead. America's Pledge.
Available online at https://www.americaspledgeonclimate.com/news/one-year-later-american-climate-
leadership-forges-ahead/.

Barbose, Galen (2017): U.S. Renewables Portfolio Standards. 2017 Annual Status Report. Lawrence Berkeley
National Laboratory. Available online at http://eta-publications.lbl.gov/sites/default/files/2017-annual-rps-
summary-report.pdf, checked on 7/28/2018.

Bloomberg New Energy Finance (2018): Fossil Fuels Squeezed by Plunge in Cost of Renewables, BNEF Says.
Bloomberg New Energy Finance.

PE 626.058                                            9
IPOL | Policy Department for Economic, Scientific and Quality of Life Policies

C40 Cities (2018): Cities Urged to Step Up Climate Action and Ambition Ahead of Global Climate Action
Summit. C40 Cities. Available online at https://www.c40.org/other/cities-urged-to-step-up-climate-action-
and-ambition-ahead-of-global-climate-action-summit.

Carbon Tracker (2018): Understanding the operating costs of coal power: US example. Carbon Tracker.
Available online at https://www.carbontracker.org/understanding-operating-cost-coal-fired-power-us-
example/.

City of Chicago (2017): Mayor Emanuel and Global Mayors Sign the Chicago Climate Charter at the North
American Climate Summit. Available
online at https://www.cityofchicago.org/content/dam/city/depts/mayor/Press%20Room/Press%20Releas
es/2017/December/120517_ChicagoCharterClimateSummit.pdf.

Climate Action Tracker (2018): Temperatures. Addressing global warming. Climate Action Tracker. Available
online at https://climateactiontracker.org/global/temperatures/.

EIA (2017): Natural Gas Explained. EIA.
Available online at https://www.eia.gov/energyexplained/index.php?page=natural_gas_where.

EIA (2018a): Electricity generation from fossil fuels declined in 2017 as renewable generation rose. EIA.
Available online at https://www.eia.gov/todayinenergy/detail.php?id=35412.

EIA (2018b): Energy-Related Carbon Dioxide Emissions by State, 2000–2015. EIA. Available online at
https://www.eia.gov/environment/emissions/state/analysis/pdf/stateanalysis.pdf, checked on 7/27/2018.
EIA (2018c): Henry Hub Natural Gas Spot Price. EIA.
Available online at https://www.eia.gov/dnav/ng/hist/rngwhhdM.htm.

EIA (2018d): State Carbon Dioxide Emissions Data. EIA.
Available online at https://www.eia.gov/environment/emissions/state/.

EIA (2018e): Texas. State Profile and Energy Estimates. EIA.
Available online at https://www.eia.gov/state/?sid=TX.

EIA (2018f): U.S. energy-related CO2 emissions expected to rise slightly in 2018, remain flat in 2019. EIA.
Available online at https://www.eia.gov/todayinenergy/detail.php?id=34872.

EIA (2018g): U.S. Natural Gas Gross Withdrawals and Production. EIA. Available online at
http://www.eia.gov/dnav/ng/ng_prod_sum_dc_nus_mmcf_m.htm.

EIA (2018h): Monthly Energy Review. Table 7.2b Electricity Net Generation: Electric Power Sector. EIA.
Available online at https://www.eia.gov/totalenergy/data/monthly/.

EPA (2018): Inventory of U.S. Greenhouse Gas Emissions and Sinks: 1990-2016. EPA. Available online at
https://www.epa.gov/sites/production/files/2018-01/documents/2018_complete_report.pdf, checked on
7/27/2018.

G7 (2018): The Charlevoix G7 Summit Communique. G7. Available online at https://g7.gc.ca/wp-
content/uploads/2018/06/G7SummitCommunique.pdf.

Galik; DeCarolis; Fell (2018): Evaluating the US Mid-Century Strategy for Deep Decarbonization amidst early
century uncertainty. In Climate Policy 17 (8), pp. 1046–1056, checked on 7/27/2018.

                                                           10                                    PE 626.058
Global Climate Action Summit, San Francisco, 12-14 September, 2018 GCAS (2018a): Frequently Asked Questions. Global Climate Action Summit. Available online at http://globalclimateactionsummit.org/faq/. GCAS (2018b): Governors in U.S. Climate Alliance to Announce New Wave of Climate Actions in Advance of Global Climate Action Summit. Global Climate Action Summit. Available online at https://globalclimateactionsummit.org/governors-in-u-s-climate-alliance-to-announce-new-wave-of- climate-actions-in-advance-of-global-climate-action-summit/. Lazard (2017): Lazard’s Levelized Cost of Energy Analysis—Version 11.0. Lazard. Available online at https://www.lazard.com/media/450337/lazard-levelized-cost-of-energy-version-110.pdf, checked on 7/28/2018. Nature (2018): Trump unveils plan to weaken greenhouse-gas limits on power plants. Nature. Available online at https://www.nature.com/articles/d41586-018-06018-8. NREL (2018): Simple Levelized Cost of Energy (LCOE) Calculator Documentation. NREL. Available online at https://www.nrel.gov/analysis/tech-lcoe-documentation.html. One Planet Summit (2017): The 12 #OnePlanet commitments. One Planet Summit. Available online at https://www.oneplanetsummit.fr/en/the-12-oneplanet-commitments/. Rise for Climate Jobs and Justice (2018): September 8th: Rise for Climate Jobs and Justice - California. Rise for Climate Jobs and Justice. Available online at https://ca.riseforclimate.org/. The Climate Group (2018a): Global Climate Action Summit. The Climate Group. Available online at https://www.under2coalition.org/event/global-climate-action-summit. The Climate Group (2018b): Under2 Coalition. The Climate Group. Available online at https://www.theclimategroup.org/project/under2-coalition. The Guardian (2018): Scott Pruitt, Trump's embattled EPA chief, resigns amid ethics scandals. The Guardian. Available online at https://www.theguardian.com/environment/2018/jul/05/scott-pruitt-resigns-epa- trump-latest-news-resignation. U.S. Climate Alliance (2018): Seventeen Governors in U.S. Climate Alliance Mark One-Year Anniversary with New Wave of Climate Actions. U.S. Climate Alliance. Available online at https://www.usclimatealliance.org/publications/oneyearanniversary . UNFCCC (2015): Paris Agreement. Available at http://unfccc.int/files/essential_background/convention/application/pdf/english_paris_agreement.pdf, checked on 10/20/2017. UNFCCC (2018): 2018 Talanoa Dialogue Platform. UNFCCC. Available online at https://unfccc.int/process- and-meetings/the-paris-agreement/2018-talanoa-dialogue-platform. United Nations (2017): Secretary-General Pledges Higher Bar on Climate Action, Energy Efficiency, Stressing Dire Consequences of Failure to Embrace Green Economy. United Nations. Available online at https://www.un.org/press/en/2017/sgsm18543.doc.htm. United States of America (2015): U.S. Cover Note, INDC and Accompanying Information. United States of America, checked on 7/27/2018. PE 626.058 11
IPOL | Policy Department for Economic, Scientific and Quality of Life Policies

Washington Post (2017): Trump Will Withdraw U.S. From Paris Climate Agreement. Washington Post.
Available online at https://www.nytimes.com/2017/06/01/climate/trump-paris-climate-agreement.html.

We Are Still In (2017): "We Are Still In" Declaration. We Are Still In. Available online at
https://www.wearestillin.com/we-are-still-declaration.

We Are Still In (2018): We Are Taking Action: How American Leaders Can Step Up in 2018.

We Are Still In. Available online at https://www.wearestillin.com/we-are-taking-action-how-american-
leaders-can-step-2018.

We Mean Business Coalition (2018a): 700+ leading companies are now driving climate action. We Mean
Business Coalition. Available online at https://www.wemeanbusinesscoalition.org/blog/700-leading-
companies-now-driving-climate-action/.

We Mean Business Coalition (2018b): Take Action. We Mean Business Coalition. Available online at
https://www.wemeanbusinesscoalition.org/take-action/.

1
     Gross emissions total excludes emissions and removals from Land Use, Land-Use Change, and Forestry (LULUCF).
     Overall, net total emissions in 2016 were 11.1% below 2005 levels (EPA 2018).
2
     Totals may not add up to 100% due to rounding. Data taken from the EPA Greenhouse Gas Inventory Data Explorer
     (access here:
     https://www3.epa.gov/climatechange/ghgemissions/inventoryexplorer/#tabs-6).
3
     Scot Pruitt has since resigned on the 5th of July, 2018 following a series of ethic scandals and his deputy Andrew
     Wheeler has taken over as acting administrator (The Guardian 2018).
4
     Refer to https://archive.epa.gov/epa/cleanpowerplan/fact-sheet-overview-clean-power-plan.html
5
     Lithium-ion batteries have declined by 79% in costs since 2010 (Bloomberg New Energy Finance 2018).
6
     The Levelized Cost of Energy (LCOE) “is an economic assessment of the cost of the energy-generating system
     including all the costs over its lifetime: initial investment, operations and maintenance, cost of fuel, cost of capital”
     (NREL 2018).
7
     Gross withdrawals are defined as “full well-stream volume, including all natural gas plant liquids and all non-
     hydrocarbon gases, but excluding lease condensate. Also includes amounts delivered as royalty payments or
     consumed in field operations” (EIA 2018g).
8
     Renewable Portfolio Standards (RPS) requires utilities to ensure that a percentage, or a specified amount, of the
     electricity they sell comes from renewable resources.
9
     RPS policies accounted for 70-90% of 2016 renewable energy capacity additions in the West, Mid-Atlantic and
     Northeast (Barbose 2017).
10
     Twelve Commitments were made at the One Planet Summit in 2017, which included co-ordinated action towards
     a zero emissions target, a sectoral shift towards a decarbonized economy, achieving zero pollution in transport
     and commitments by several countries to establishing a more significant carbon price (One Planet Summit 2017).

Disclaimer and copyright. The opinions expressed in this document are the sole responsibility of the authors and do not necessarily represent the
official position of the European Parliament. Reproduction and translation for non-commercial purposes are authorised, provided the source is
acknowledged and the European Parliament is given prior notice and sent a copy. © European Union, 2018.

Administrator responsible: Georgios AMANATIDIS       Editorial assistant: Irene VERNACOTOLA
Contact: Poldep-Economy-Science@ep.europa.eu

This document is available on the internet at: www.europarl.europa.eu/supporting-analyses
IP/A/ENVI/2018-13
Print     ISBN 978-92-846-3794-2 | doi: 10.2861/838376| QA-01-18-905-EN-C
PDF       ISBN 978-92-846-3795-9| doi: 10.2861/424507| QA-01-18-905-EN-N

                                                                       12                                                          PE 626.058
You can also read