Action Recognition from Skeleton Data via Analogical Generalization over Qualitative Representations
←
→
Page content transcription
If your browser does not render page correctly, please read the page content below
Action Recognition from Skeleton Data
           via Analogical Generalization over Qualitative Representations
                                              Kezhen Chen and Kenneth D. Forbus
                                                            Northwestern University
                                                      KezhenChen2021@u.northwestern.edu

                              Abstract                                        This paper draws on research in qualitative spatial reason-
   Human action recognition remains a difficult problem for AI.            ing and cognitive simulation of visual problem-solving and
   Traditional machine learning techniques can have high                   analogy to provide a new approach with high accuracy and
   recognition accuracy, but they are typically black boxes                a novel explanation ability to recognize human actions from
   whose internal models are not inspectable and whose results
                                                                           Kinect skeleton data. Instead of computing frame-based fea-
   are not explainable. This paper describes a new pipeline for
   recognizing human actions from skeleton data via analogical             tures (Wang et al. 2016; Li, Chen, and Sun. 2016), the video
   generalization. Specifically, starting with Kinect data, we             stream is divided into sketch graphs, consisting of multiple
   segment each human action by temporal regions where the                 sequences of snapshots. Each snapshot is like a panel in a
   direction of motion is constant, creating a sketch graph that           comic strip: It consists of a motion segment described by a
   provides a form of qualitative representation of the behavior
                                                                           single qualitative state, which might correspond to many
   that is easy to visualize. Models are learned from sketch
   graphs via analogical generalization, which are then used for           frames. Each body point has its own sequence of such states.
   classification via analogical retrieval. The retrieval process          The trajectories within these states and relationships across
   also produces links between the new example and compo-                  these states are described qualitatively, using automatically
   nents of the model that provide explanations. To improve                constructed visual representations. The sketch graphs for
   recognition accuracy, we implement dynamic feature selec-
                                                                           each instance of a behavior type are combined via analogical
   tion to pick reasonable relational features. We show the ex-
   planation advantage of our approach by example, and results             generalization, to automatically construct probabilistic rela-
   on three public datasets illustrate its utility.                        tional schemas (plus outliers) characterizing that behavior
                                                                           type. To categorize a new behavior, a set of sketch graph
                                                                           representations is computed for it, and analogical retrieval
                          Introduction                                     is used across the entire set of trained behavior models to
Human action recognition is an important but difficult prob-               retrieve the closest schema (or outlier). We begin by sum-
lem. Traditional machine learning relies on extracting large               marizing the work we build on, including CogSketch and
numbers of features and using techniques such as deep                      analogical processing. We then describe the learning pipe-
learning (Baccouche et al. 2011). However, these techniques                line and how classification works. We show how explana-
have some disadvantages. A key problem is that they are                    tion sketches enable understanding recognition decisions
black boxes: They can produce results, but do not provide                  made via analogy. Results on three public Kinect action da-
explanations for their answers. This makes their results dif-              tasets are described, and we close with related and future
ficult to trust and to debug (Lowd and Meek. 2005). When                   work.
people perform recognition, even for visual tasks, they often
can describe the reasons for their classification. There is ev-                                  Background
idence that relational representations are important in hu-
man cognition (Marr 1982; Palmer 1999). By working with                    Our approach combines ideas from sketch understanding
human-inspired relational representations, we provide evi-                 and analogical processing. We discuss each in turn.
dence that analogical models can produce high accuracy
while providing explanations.

Copyright © 2018, Association for the Advancement of Artificial Intelli-
gence (www.aaai.org). All rights reserved.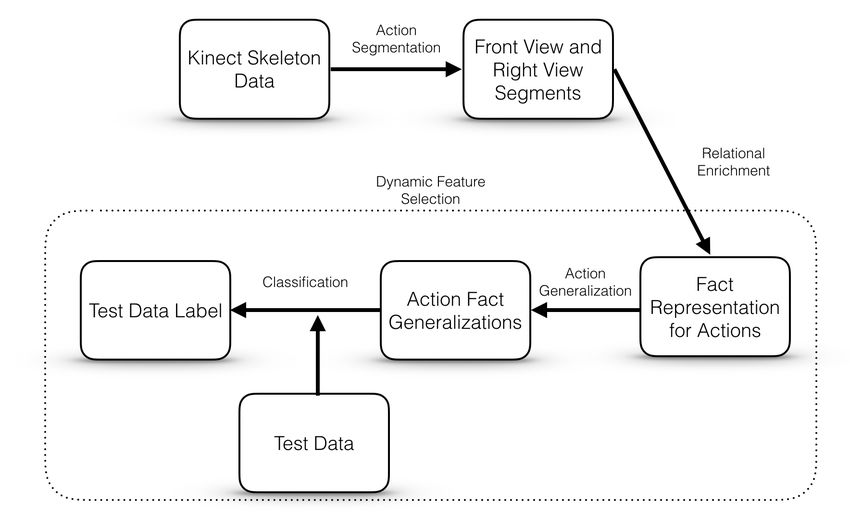
CogSketch                                                            SME takes as input two structured, relational representa-
CogSketch (Forbus et al. 2011) is a sketch understanding          tions and produces one or more mappings that describe how
system that provides a model of high-level visual pro-            they align. These mappings include correspondences (i.e.
cessing. It provides multiple, hierarchical levels of visual      what goes with what), a similarity score, and candidate in-
representation, including decomposing digital ink into            ferences that suggest how statements from one description
edges, combining edges into entities, and gestalt grouping        can be projected to the other. SME has been used in a variety
methods. The qualitative visual representations that it auto-     of AI systems and cognitive models.
matically computes from digital ink have enabled it to model         Analogical retrieval is performed by MAC/FAC, which
a variety of visual problem-solving tasks (e.g. Lovett and        stands for “Many are Called/Few are Chosen”, because it
Forbus, 2011). These relations include qualitative topology       uses two stages of map/reduce for scalability. The inputs
(Gohn et al. 1997), positional relations (e.g. above, leftOf),    consist of a probe case and a case library. The MAC stage
and directional information (e.g. quadrants). We extended         computes, in parallel, dot products over vectors that are au-
the OpenCyc ontology with these relations. Every sketch           tomatically constructed from structured descriptions, such
has one or more subsketches, each of which contains glyphs.       that each predicate, attribute, and logical function are di-
Glyphs are the constitutes of sketches. Subsketches can par-      mensions in the vector and whose magnitude in each dimen-
ticipate in relationships.                                        sion reflects their relative prevalence in the original struc-
   The representations produced by CogSketch have been            tured description. The best mapping, and up to two others
used to model human performance on several visual tasks,          (if they are sufficiently close) are passed to the FAC stage.
including Ravens’ Progressive Matrices, one of the most           FAC compares the best structured descriptions from the
common tests used to measure human fluid intelligence.            MAC stage to the input probe using SME. Again, the best
The CogSketch model uses SME (described below) at mul-            match, with up to two others if sufficiently close, are re-
tiple levels of visual representations, including re-represent-   turned. This provides scalability (because the MAC stage is
ing visual descriptions automatically as needed. Its perfor-      inexpensive) as well as structural sensitivity (because the
mance places it in the 75th percentile for American adults,       content vector dot product is a coarse estimate of SME sim-
better than most adult Americans (Lovett and Forbus, 2017).       ilarity, followed by using SME itself).
Ravens and the other visual problems that CogSketch and              Analogical generalization is performed by the Sequential
SME have been used with are static, this paper marks the          Analogical Generalization Engine (SAGE). Every concept
first time they have been used with dynamic visual data.          to be learned by analogy is represented by a generalization
In this paper, subsketches are used to implement sketch           pool, which maintains both generalizations and outlying ex-
graphs. CogSketch’s visual processing is used to construct        amples. Examples are added incrementally. The closest
additional relations within and between subsketches. This         matching item (example or generalization) is retrieved via
includes the qualitative representations mentioned above. In      MAC/FAC, using the contents of the generalization pool as
each subsketch, relations within an action segment are ex-        a case library. If there is no item, or the similarity to what
tracted. The metalayer in CogSketch enables multiple              is retrieved is less than an assimilation threshold, the new
subsketches and relationships between them to be displayed,       example is added as an outlier. Otherwise, if the item re-
to support visualization.                                         trieved is an example, the two are combined into a new gen-
                                                                  eralization. This process involves merging them, replacing
Analogical Processing                                             non-identical entities by skolems, and assigning a probabil-
                                                                  ity to each statement depending on whether it was in just one
We build on models inspired by Gentner’s structure-map-           description or both. If the item retrieved was a generaliza-
ping theory of analogy and similarity (Gentner, 1983). Its        tion, that generalization is updated with skolems and proba-
notion of comparison is based on structured descriptions, in-     bilities based on its alignment with the new example. Gen-
cluding both attributes and relations. There is considerable      eralizations in SAGE are thus probabilistic, but still concrete
psychological evidence supporting structure-mapping, mak-         – skolem entities may become more abstract due to fewer
ing it attractive for use in AI systems so that, with the right   high-probability statements about them, but logical varia-
representations, what looks similar to us will look similar to    bles are not introduced. Instead, candidate inferences are
our software and vice-versa. We use Structure-Mapping             used for schema application.
Engine (SME; Forbus et al. 2016) for analogical matching,            SAGE also supports classification, by treating the union
MAC/FAC (Forbus, Gentner, and Law. 1995) for analogical           of generalization pools as a large case library. The case li-
retrieval, and SAGE (McLure, Friedman and Forbus. 2015)           brary which contained the closest item is taken as the clas-
for analogical generalization. Since these operations are at      sification of that example, with the correspondences of the
the heart of our learning approach, we summarize each in          match constituting an explanation of why it is a good match.
turn.                                                             Since a generalization pool can have multiple generaliza-
                                                                  tions, SAGE naturally handles disjunctive concepts.
Our Approach intervals describing the motion of particular body parts. A
track is a sequence of point coordinates from each frame for
Our approach focuses on human skeleton action recognition a specific body point. As CogSketch needs 2D sketches, we
via analogical generalization over qualitative representa- map each 3D coordinate into front-view and right-view. To
tions. It is implemented as a pipeline with four stages: Ac- segment movements of a track (a body point) in a view, we
tion Segmentation, Relational Enrichment, Action General- compute the azimuth (the angle that is clockwise relative to
ization and Classification. A dynamic feature selection pro- the north) changes of the track frame by frame to find the
cess picks reasonable additional features for different ac- direction change. Intervals of time over which the motion
tions before the final training. All sketches and relations are has similar azimuth are grouped into one segment. In the ex-
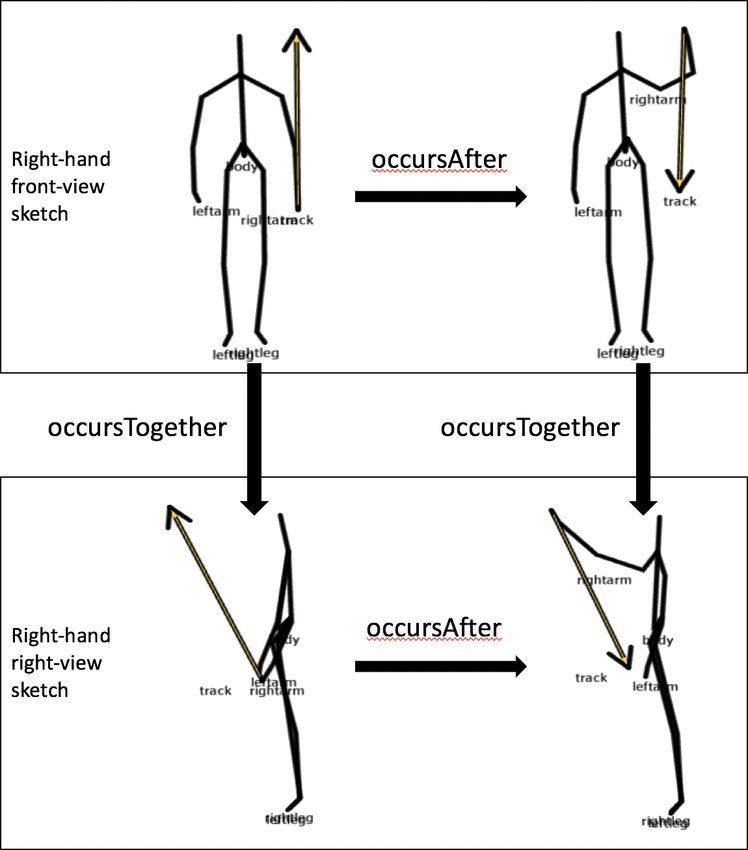
computed from our system automatically. Figure 1 shows periments reported here, we use only the right-hand, left-
the pipeline of our system. We describe each stage in turn, hand, right-hip and left-hip in front-view and right-view, be-
and describe explanation sketches. cause the motions in the datasets used can be described as
the movements of these four body parts.
For each track in a view, we first compute the spatial re-
lation Moving or Stationary (MOS), with 0.02 quantization
factor via QSRlib (Gatsoulis et al. 2016), a library of quali-
tative spatial relations and calculi, for the four main body
points. MOS relations can show whether a point in a frame
is moving (label ‘m’) or stationary (label ‘0’). An MOS re-
lation sequence could be as follows:
[0,0,0,0,m,m,m,m,m,m,m,0,0,]
After motion detection, eight MOS sequences corre-
sponding to four points in two views are extracted. All
frames with label ‘m’ are segmented by computing the car-
tographical azimuth changes between each pair of two con-
secutive moving points. When the azimuth change between
Figure 1: pipeline of our algorithm two consecutive point pairs is larger than 88 degrees, the
movement of the track is segmented into two parts. After
Action Segmentation action segmentation, we get eight sequences of segments,
The skeleton data produced by a Kinect (or other 3D sen- four points in the front-view and four points in the right-
sors) contains many points per frame, representing each view.
body part such as the head or right-hand. We use 20 body We use two techniques to reduce segmentation noise.
points tracked by Kinect V1 to represent 20 body parts and First, after action segmentation, all segments in a track are
connect these body points to provide a concise body skele- merged again when the average azimuth between start-
ton graph, as shown in Figure 2. point and end-point is smaller than fifty degrees. Second,
segments are also merged when the distance between start-
point and end-point of the segment is smaller than half of
average distance between start-point and end-point of all
segments.
Relational Enrichment
The relational enrichment stage involves automatically add-
ing additional relationships via CogSketch, to provide more
information about the motions within and between seg-
ments. Each example of a behavior is imported into Cog-
Sketch as a set of sketches, one per track, with each panel
(segment) within a track being represented by a separate
subsketch. Within each panel, the skeleton is represented by
a set of glyphs, including an arrow from start-point to end-
point of the track panel to represent the direction of motion.
Figure 2: Kinect body skeleton graph
Figure 3 shows two sketches from eight sketches of raising
the right-hand and putting it down and the relations within
Each instance of an action consists of a continuous move-
same sketch and between different sketches. As only the
ment stream, sampled via many frames, each frame contain-
right-hand has movements in this action, we only show the
ing coordinates for these points. The first step of our pipe-
two sketches of right-hand movements.
line abstracts away from frames into qualitatively distinctTo summarize, each action is represented by eight Sequence information between segment panels is repre-
sketches in CogSketch: right-hand in front-view, right-hand sented using the occursAfter and occursTogether relations.
in right-view, left-hand in front-view, left-hand in right- occursAfter indicates that two segments occur successively
view, right-hip in front-view, right-hip in right-view, left- and is used to connect segments from same track in same
hip in front-view and left-hip in right-view. In each sketch view. occurTogether means that two segments have eighty
and subsketch, CogSketch is used to compute relationships percent time overlap and connects the segments from differ-
between body parts, e. g. the relative position of the right- ent track in same view, e. g.
hand to the head. (occursAfter
(KinectMotionFn RightHand Front SingleHand D1RHFS2)
(KinectMotionFn RightHand Front SingleHand D1RHFS4))
This representation enables facts from different segments
to be included in one unified case representation and is ex-
tracted totally automatically. Table 1 provides the full set of
relationships that we compute for every track.
Relations Descriptions
(trackMotionTowards The track moving direction from
) start-point to end-point.
(quadDirBetween The elbow direction with respect
to corresponding hand.
)
(bodyStatus Whether the body bends larger
) than 45 degrees.
(handPosition Whether the hand bends raising
larger than 90 degrees.
)
(armStatus Whether the arm bends larger than
90 degrees.
)
(motionRange Whether the movement range is
) larger than half of body length.
(twoArmRela Whether the two arms are cross
) with each other.
(legStatus Whether the leg bends larger than
45 degrees.
)
(moveRespectArm Whether the hand is moving to-
Figure 3: Two sketches of raising hand action wards inside of the arm or outside
) of the arm.
(distRespectBody Whether the distance of x coordi-
We use the following logical function to denote panels in ) nates between hand and spine is
a sketch graph: larger than 25.
(KinectMotionFn ) Table 1: basic features in each case
is from the four main body points: right-hand,
left-hand, right-hip, left-hip. is front or right view. Action Generalization
describes the type of movement: single-hand,
All facts for each segment are combined as a case represent-
two-hand or full-body. is a unique identifier denot-
ing the entire action. Each such action instance is added to
ing the segment.
the generalization pool being used to learn that concept. For
In each segment subsketch, additional details can be pro-
all experiments reported here, we used an assimilation
vided via Cyc’s holdsIn relation. For example, spatial rela-
tions are helpful to determine the locations of body points, threshold of 0.7. SAGE also uses a probability cutoff, i.e. if
so these relations are added. In each segment motion, we use a fact’s probability drops below this value, it is removed
entities from CogSketch’s qualitative representation of ori- from the generalization. We used a probability cutoff of 0.2
entation to describe the direction of motion, i.e. the quadrant in all experiments. Each action type is represented as a dis-
representations Quad1, Quad2, Quad3, Quad4, the pure di- tinct generalization pool and all action type generalization
rections Up, Down, Left, and Right, plus the constant pools are combined into a case library.
NoMotion indicating lack of motion. The motion direction
information is connected with the motion segment via hold- Classification
sIn. For example: By treating the union of generalization pools for action types
(holdsIn
as one large case library, our system can classify new exam-
(KinectMotionFn RightHand Front SingleHand D1RHFS2)
(trackMotionTowards Quad1)) ples based on which library the closest retrieved item came
from. Given a new case, MAC/FAC is used to retrieve theclosest generalization or outlier from the union of the gen- Explanation Sketches
eralization pools. The action label of the generalization pool Sketch graphs carve motions up into a discrete set of snap-
it came from is assigned to the test instance. shots, much like comic strips, an easy to apprehend visuali-
zation for people. The generalizations are also sketch
Dynamic feature selection graphs, enabling them to be inspected more easily than, for
As shown in Table 1, ten basic relations are extracted to rep- example, large vectors. The analogical mapping that justi-
resent each segment. However, representing the direction of fies a recognition decision can be displayed by drawing the
motion more precisely relative to different reference points correspondences between panels in the two sketch graphs
can be very useful. The relation qualDirBetween represents and their constituents.
the direction of motion with respect to a reference point. Its This is the basis for the explanation sketch. It depicts
first argument is the start or end point of the motion. Its se- how a retrieved sketch graph for a generalization (or an
cond argument is the reference point. Its third argument is outlier) aligns with a sketch graph for a new behavior. The
the direction. For example, skeleton glyphs from corresponding segments are visual-
(holdsIn ized in two boxes side-by side. Correspondences within
(KinectMotionFn RightHand Front SingleHand D1RHFS1) the segments are indicated by dashed lines. Thus, the ex-
(qualDirBetween RightHand-StartPoint Head Quad4)) planation sketch provides a visualization for how a model
indicates that that the start-point of the motion D1RHFS1 is explains a behavior, based on their overlap. Figure 4 shows
in the Quad4 direction, with respect to the head, in the first two examples. Figure 4 (a) shows a perfect match with
segment of the right-hand track within the front-view. five dashed lines for all five different parts. Figure 4 (b)
In these experiments we use head, shoulder-center, spine shows a different movement corresponding, which only
and hip-center as the possible reference points. Directions has same facts for left-arm, left-leg and right-leg.
are described either in terms of quadrants or broad direc- The explanation sketch could be used to answer why-not
tions, i.e. Left/Right or Up/Down, each of which are the un- question. Given a behavior and asked why a specific classi-
ions of two quadrants. For conciseness, we will abbreviate fication was not used, the most similar generalization or
subsets of these representation via the template -, i.e. the statement above would be compared. The non-overlapping aspects provide the gist
an example of Head-Quad. for why that category was not chosen.
Dynamic feature selection is used to select which families
of direction representations are used for a dataset. Given the
distinctions above, there are 12 families of qualDirBetween
relations that can be computed. The algorithm starts with the
basic set of features plus a single family of optional features,
doing training and testing with each independently. The
highest accuracy optional feature is retained. On subsequent
rounds, the search is constrained by limiting it to the two
unused features that perform best where the choices so far
perform the worst. The search stops either when a cutoff is
reached (here, the cutoff is four optional features, which pro- Figure 4 (a): perfect matching
vides a reasonable tradeoff between accuracy and effi-
ciency) or when all the additions lead to lower accuracy.
We evaluated dynamic feature selection on the Florence
3D Action dataset (Seidenari et al. 2013), which contains
nine activities: wave, drink from a bottle, answer phone,
clap, tie lace, sit down, stand up, read watch, bow. Ten sub-
jects were asked to perform the nine actions two or three
times. Two groups of additional features are tested: one is
picked manually and the other one is picked via the algo-
rithm above. Cross-subject validation was used. The results,
shown in Table 2, show that dynamic feature selection im-
proves accuracy by ten percent.
Methods Features Accuracy results (%) Figure 4 (b): Partial matching
Manual-feature-se- Head-Quad, Spine-Quad, 63.6
lection Hip-Center-Quad
Dynamic-feature- Head-Quad 74.2 Experimental Results and Discussion
selection Spine-Up-Down
Hip-Center-Up-Down While we view the ability to produce understandable expla-
Table 2: Recognition results with dynamic-feature-selection nations as an important part of our approach, we note thatother approaches do not explore explanation, so we confine Table 3: Accuracy (%) for each action from the two action sets
ourselves here to comparing with others using their metrics.
Three datasets are tested and we describe each in turn. Method Accuracy (%)
Inertial (Chen et al. 2015) 67.2
UTD-MHAD Dataset Kinect & Inertial (Chen et al. 2015) 79.1
CNN (Wang et al. 2016) 85.81
The University of Texas at Dallas Multimodal Human Ac-
Our Method 65.82
tion Dataset (UTD-MHAD) was collected as part of re-
Our Method (19 actions) 80.3
search on human action recognition by Chen et al. (Chen et
Table 4: Recognition Rates (%) comparison on the UTD-MHAD
al. 2015). This dataset contains eight different subjects (4
females and 4 males) performing twenty-seven actions in a As shown in the two tables above, our method has 80.3%
controlled environment. Data was collected using Kinect V1 accuracy on the set with 19 actions, which is only lower than
sensor with 4 repetitions per action. the CNN approach. Again, one reason is that the qualitative
Qualitative spatial relations are computed for all target relation encoding can cause information loss if the available
body points and dynamic feature selection is used. From dy- relationships do not provide fine enough distinctions. For
namic feature selection, Head-Quad, Head-Up-Down, Hip- examples, the “swipe-right” action can be segmented into
Center-Up-Down and Spine-Quad were picked as four ad- three parts: raise hand, swipe, and put down hand. But these
ditional features. We used the same cross-subject testing segments could form a triangle in the air, which is similar to
method from (Chen, et al ,2015) in our experiments. Our the “draw-triangle” action. With spatial relations we defined
method achieves 65.82% accuracy. One reason why our here, some instances of “draw triangle” with larger move-
method does not have relatively good performance on this ment range may be represented by same relational facts of
dataset is that there are many similar actions in this dataset “swipe-right”. This resolution/accuracy tradeoff is worth
such as “Arm-curl” and “clap”. Some pairs of similar ac- exploring in the future work.
tions have the same qualitative representations, so SME has
trouble recognizing them. Consequently, we also test our Florence 3D Actions Dataset
method on a subset of actions containing nineteen actions
(we remove 6 similar actions and 2 actions with large noise). We ran an experiment on this dataset but followed the leave
Table 3 shows the accuracy for each action tested on the two one out cross-validation protocol (LOOCV) (Seidenari et al.
different action sets. The average result of existing methods 2013) to compare with their methods. With this protocol,
is in Table 4. there are more training data than the experiment in previous
Accuracy (%) 27 actions Accuracy(%) 19 actions section. Dynamic feature selection picked Head-Quad,
Swipe left 68.75 Swipe left 75 Spine-Up-Down, Hip-Center-Up-Down as additional fea-
Swipe right 62.5 Swipe right 68.75
Wave 81.25 Wave 81.25
tures. The average accuracy compared with other methods
Clap 56.25 Arm cross 68.75 is shown in Table 5.
Throw 43.75 Basketball shoot 81.28 Method Accuracy (%)
Arm Cross 62.5 Draw circle 87.5
Devanne et al. 2014 87.04
Clockwise
Basketball shoot 81.25 Draw triangle 87.5 Vemulapalli, Arrate, and 90.88
Draw X 50 Bowling 62.5 Chelappa. 2014
Draw circle 75 Boxing 87.5
Clockwise Our Method 86.9
Draw circle 25 Baseball swing 87.5 Table 5: Recognition Rates (%) on the Florence dataset
Counter clockwise
Draw triangle 68.5 Tennis serve 62.5 As Table 5 shows, our method has comparable results
Bowling 62.5 Push 62.5
Boxing 87.5 Catch 81.25
with (Devanne et al, 2014) and a little lower than (Vemula-
Baseball swing 81.25 Pickup and throw 81.25 palli, Arrate, and Chelappa. 2014) results. In this dataset, our
Tennis swing 37.5 Jog 100 algorithm has relatively low accuracy on “drink from a bot-
Arm curl 50 Sit to stand 75 tle” and “answer phone” among all nine actions because
Tennis serve 62.5 Stand to sit 81.25
Push 56.25 Lunge 93.75 some instances of them cannot be distinguished from the
Knock 62.5 Squat 100 “wave” action. All three can be segmented into a motion that
Catch 75 Overall 80.3 subject raises the right-hand to the position near the head,
Pickup and throw 81.25 and our qualitative representations did not have sufficient
Jog 62.5
Walk 43.75 resolution to distinguish them. However, we note that when
Sit to stand 75 people are asked to review the skeleton data for these two
Stand to sit 81.25 actions, they also find it hard to describe the differences.
Lunge 93.75 Consequently, we do not necessarily view our system’s per-
Squat 100
Overall 65.82 formance on these actions as a negative.UTKinect-Action3D Dataset an elastic metric to compare the similarity between trajecto-
To further evaluate our method, we ran an experiment on the ries, actions can be classified. In (Vemulapalli, Arrate, and
UTKinect-Action3D dataset (Xia, Chen, and Aggarwal. Chelappa. 2014), the skeleton data movements are repre-
2012). This Kinect dataset has 10 actions performed by 10 sented as Lie group and mapped to its Lie algebra. Then, the
different subjects. For each action, each person performs it authors test this representation with Fourier temporal pyra-
twice so there are 200 behaviors in this dataset. The ten ac- mid representation and linear SVM. In (Xia et al. 2012), his-
tions are: walk, sit down, stand up, pick up, carry, throw, tograms of 3D joint locations with LDA are extracted from
push, pull, wave, and clap hands. skeleton data and HMM models are trained to classify ac-
With dynamic feature selection, Head-Up-Down, Spine- tions. In (Theodorakopoulos et al. 2014), the system uses
Quad and Hip-Center-Up-Down are picked as the additional sparse representations in dissimilarity space to encode ac-
features for this dataset. We follow the leave one out cross tion movements and performs classification on these repre-
validation protocol (LOOCV) for comparability. Table 6 sentations.
shows the recognition rates corresponding to the different All approaches mentioned above only use statistical mod-
actions and compares our accuracy with two other methods. els on quantitative data, which makes it hard for them to ex-
Action Xia, Chen, Theodorakopoulos et al. Ours
and Ag- 2014
plain their results. To the best of our knowledge, this is the
garwal. 2012 first work to do skeleton action recognition via analogical
Walk 96.5 90 100 generalization on qualitative relations instead of pattern
Sit down 91.5 100 90
recognition or machine learning. We also note that none of
Stand up 93.5 95 85 the algorithms above address explanation, whereas our ap-
Pick up 97.5 85 100
Carry 97.5 100 85 proach does. As far as we know, this is the first paper to
Throw 59.0 75 60 provide visual explanations for skeleton action recognition
Push 81.5 90 70 problems. Admittedly, qualitative representations do lose
Pull 92.5 95 95 details of action movements, so some methods have slightly
Wave 100 100 100 better performance on accuracy than ours. However, expla-
Clap hands 100 80 100 nation ability is also essential in recognition tasks, to pro-
Overall 90.92 90.95 88.50 vide people a better understanding of the results.
Table 6: Recognition Rates (%) on the UTKinect-Action dataset
As shown in the Table 6, the three algorithms present Conclusions and Future Work
comparable performance for different actions. Our average
accuracy is 88.5%. Our system has relatively lower accuracy This paper presents a new approach with high accuracy and
on some actions such as throw and push. In this dataset, novel explanation ability, based on qualitative representa-
some subjects did not face the Kinect directly when they tions and analogical generalization, for learning how to clas-
performed the actions. As our method needs to extract front- sify human actions from skeleton data. Our pipeline uses az-
view and right-view sketches from the data, this noise could imuth changes to segment tracks, a cognitive model of hu-
have influenced on our algorithm. man high-level vision to enrich descriptions of motion and
configuration, and analogical generalization to provide
learning via inspectable, relational models. Explanation
Related Work sketches are used to visualize the correspondences and map-
Human action recognition from Kinect data is a popular pings between different segments. Experiments on three
topic and various methods have been used on this problem. public datasets provide evidence for the utility of this ap-
In (Wang et al. 2016), the spatial-temporal information from proach.
3D skeleton data was projected into three 2D images (Joint There are several avenues to explore next. The first is to
Trajectory Maps), and Convolutional Neural Networks were test it with additional datasets, both to explore noise and dy-
used for action recognition. In (Chen et al. 2015), three dif- namic encoding issues. The second is to explore the effec-
ferent depth motion maps of front, side and top views are tiveness of explanation sketches in helping system trainers
extracted as features form depth video sequences. Addition- improve performance and to implement the extension to
ally, each skeleton data sequence is partitioned into N tem- SAGE, which constructs near-misses (McLure, Friedman
poral windows and some statistical features are extracted in and Forbus. 2015), to improve our explanation sketches.
each window. A collaborative representation classifier is Furthermore, we plan to explore using this same approach
used to classify the actions with the features above. In (De- to analyze video more broadly, including RGB and depth
vanne et al. 2014), the skeleton data is modeled as a multi- data.
dimensional vector and the trajectories described by this
vector are interpreted in a Riemannian manifold. By usingAcknowledgements Lovett, A., and Forbus, K. 2011. Cultural commonalities and dif-
ferences in spatial problem-solving: A computational analysis.
This research was supported by the Machine Learning, Rea- Cognition, 121(2), pp.281-287.
soning, and Intelligence Program of the Office of Naval Re- Lovett, A., and Forbus, K. 2017. Modeling visual problem solving
search. as analogical reasoning. Psychological Review, 124 (1), p.60
Lowd, D., and Meek, C. 2005. Adversarial learning. In Proceed-
ings of the eleventh ACM SIGKDD international conference on
Reference Knowledge discovery in data mining (pp. 641-647). ACM.
Marr, D. 1982. Vision: A computation approach.
Baccouche, M., Mamalet, F., Wolf, C., Garcia C., and Baskurt, A.
2011. Sequential Deep Learning for Human Action Recognition. McLure, M., Friedman, S., and Forbus, K.D. 2015. Extending An-
Human Behavior Understanding, 29-39. alogical Generalization with Near-Misses. In AAAI. (pp. 565-571)
Chen, C., Jafari, R., and Kehtarnavaz, N. 2015. UTD-MHAD: A Palmer, S.E. 1999. Vision Science: Photons to Phenomenology.
Multimodal Dataset for Human Action Recognition Utilizing a MIT Press.
Depth Camera and a Wearable Inertial Sensor. Image Processing Seidenari, L., Varano, V., Berretti, S., Bimbo, A., and Pala, P.
(ICIP), 2015 IEEE International Conference on (pp. 168-172). 2013. Recognizing actions from depth cameras as weakly aligned
IEEE. multi-part bag-of poses. In Proceedings of the IEEE Conference on
Cohn, A. G., Bennett, B., Gooday, J., and Gotts, N. M. 1997. Qual- Computer Vision and Pattern Recognition Workshops (pp. 479-
itative Spatial Representation and Reasoning with the Region Con- 485).
nection Calculus. GeoInformatica, 1(3), pp.275-316. Theodorakopoulos, I., Kastaniotis, D., Economou, G., and
Devanne, M., Wannous, H., Berretti, S., Pala, P., Daoudi, M., and Fotopoulos, S. 2014. Pose-based human action recognition via
Del Bimbo, A. 2014. 3D human action recognition by shape anal- sparse representation in dissimilarity space. Journal of Visual
ysis of motion trajectories on Riemannian manifold. IEEE transac- Communication and Image Representation, 25(1), pp.12-23.
tions on cybernetics, 45(7), 1340-1352. Thippur, A., Burbridge, B., Kunze, L., Alberti, M., Folkesson, J.,
Duckworth, P., Gatsoulis, Y., Jovan, F., Hawes, N., Hogg, D.C., Jensfelt, P., and Hawes, N. 2015. A Comparison of Qualitative and
and Cohn, A.G., 2016. Unsuperivised Learning of Qualitative Mo- Metric Spatial Relation Models for Scene Understanding. In AAAI
tion Behaviours by a Mobile Robot. In Proceedings of the 2016 (pp. 1632-1640).
International Conference on Autonomous Agents & Multiagent Van de Weghe, N., Cohn, A., De Tre, G., and De Maeyer, P. 2006.
Systems (pp. 1043-1051). International Foundation for Autono- A Qualitative Trajectory Calculus as a basis for representing mov-
mous Agents and Multiagent Systems. ing objects in Geographical Information Systems. Control and Cy-
Forbus, K., Gentner, D., and Law, K. 1995. MAC/FAC: A Model bernetics, 35(1), pp. 97-119.
of Similarity-based Retreval. Cognitive Science, 19(2), pp.141- Vemulapalli, R., Arrate, F., and Chelappa, R. 2014. Human action
205. recognition by representing 3D skeletons as points in a lie group.
Forbus, K., Ferguson, R., Lovett, A., and Gentner, D. 2016. Ex- In Proceedings of the IEEE conference on computer vision and pat-
tending SME to Handle Large-Scalle Cognitive Modeling. Cogni- tern recognition, (pp. 588-595).
tive Science. Cognitive Science, 41(5), pp. 1152-1201. Wang, P., Li, W., Li, C., and Hou, Y. 2016. Action Recognition
Forbus, K., Liang, C., and Rabkina, I. 2017. Representation and Based on Joint Trajectory Maps with Convolutional Neural Net-
Computation in Cognitive Models. Topics in Cognitive Science, works. IEEE Transactions on Cybernetics.
9(3), pp.694-718. Xia, L., Chen, C., and Aggarwal, J. 2012. View invariant human
Forbus, K., Usher, J., Lovett, A., Lockwood, K., and Wetzel, J. action recognition using histograms of 3D joints. In computer vi-
2011. CogSketch: Sketch Understanding for Cognitive Science sion and pattern recognition workshops(CVPRW), 2012 IEEE
Research and for Education. Topics in Conitive Science, 3(4), pp. Computer Society Conference on (pp. 20-27). IEEE.
648-666.
Gatsoulis, Y., Alomari, M., Burbridge, C., Doudrup, C., Duck-
worth, P., Lightbody, P., Hanheide, M., Hawes, N., Hogg, D.C. and
Gohn, A.G. 2016. QSRlib: a software library for online acquisition
of Qualitative Spatial Relations from Video. QR.
Gentner, D. 1983. Structure-mapping: A theoretical framework for
analogy. Cognitive Science, 7(2), pp.155-170.
Kunze, L., Burbridge, C., Alberti, M., Tippur, A., Folkesson, J.,
Jensfelt, P., and Hawes, N. 2014. Combining Top-down Spatial
Reasoning and Botton-up Object Class Recognition for Scene Un-
derstanding. In Intelligent Robots and Systems (IROS 2014), 2014
IEEE/RSJ International Conference on (pp. 2910-2915). IEEE.
Li, J., Chen, J and Sun, L., 2016. Joint Motion Similarity (JMS)-
based Human Action Recognition Using Kinect. In Digital Image
Computing: Techniques and Applications (DICTA), 2016 Interna-
tional Conference on (pp. 1-8). IEEE.You can also read